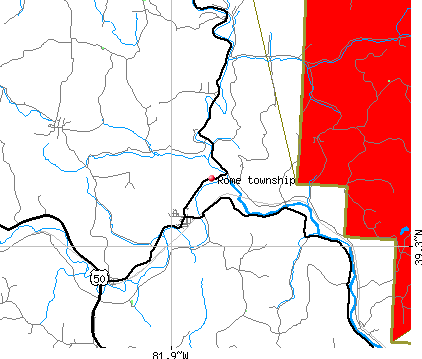
Rome township, Athens County, Ohio (OH) detailed profile
Number of foreign born residents: 1 (50% naturalized citizens)
| Rome township: | 1.4% |
| Whole state: | 3.0% |
56% of Rome township residents lived in the same house 5 years ago.
Out of people who lived in different houses, 68% lived in this county.
Out of people who lived in different counties, 43% lived in Ohio.
Place of birth for U.S.-born residents:
- This state: 997
- Northeast: 57
- Midwest: 40
- South: 386
- West: 13
Median price asked for vacant for-sale houses in 2000: $9,999
Percentage of households with unmarried partners: 5.3%
Likely homosexual households (counted as self-reported same-sex unmarried-partner households)
- Lesbian couples: 0.0% of all households
- Gay men: 0.8% of all households

Housing units in structures:
- One, detached: 426
- Mobile homes: 178
Median worth of mobile homes: $30,200
Housing units in Rome township with a mortgage: 118 (15 second mortgage, 7 home equity loan, 0 both second mortgage and home equity loan)
Houses without a mortgage: 80
- Educational services (13%)
- Motor vehicle and parts dealers (8%)
- Agriculture, forestry, fishing and hunting (7%)
- Metal and metal products (6%)
- Construction (6%)
- Food and beverage stores (6%)
- Accommodation and food services (5%)
- Educational services (14%)
- Public administration (11%)
- Finance and insurance (9%)
- Health care (9%)
- Department and other general merchandise stores (8%)
- Food and beverage stores (6%)
- Social assistance (6%)
- Electrical equipment mechanics and other installation, maintenance, and repair occupations including supervisors (9%)
- Other production occupations including supervisors (8%)
- Cashiers (6%)
- Other sales and related workers including supervisors (5%)
- Driver/sales workers and truck drivers (5%)
- Other management occupations except farmers and farm managers (4%)
- Vehicle and mobile equipment mechanics, installers, and repairers (4%)
- Other office and administrative support workers including supervisors (11%)
- Building and grounds cleaning and maintenance occupations (9%)
- Bookkeeping, accounting, and auditing clerks (9%)
- Secretaries and administrative assistants (6%)
- Financial clerks except bookkeeping, accounting, and auditing clerks (5%)
- Nursing, psychiatric, and home health aides (5%)
- Child care workers (4%)
Most common first ancestries reported in Rome township:
- German (18.7%)
- United States or American (14.9%)
- Irish (12.1%)
- English (8.8%)
- Scottish (7.5%)
- Russian (3.5%)
- Scotch-Irish (3.3%)
Most common places of birth for the foreign-born residents:
- Philippines (30%)
- Trinidad and Tobago (25%)
- Canada (25%)
- Dominican Republic (20%)
Means of transportation to work:
- Drove a car alone: 461 (82%)
- Carpooled: 45 (8%)
- Walked: 11 (2%)
- Other means: 20 (4%)
- Worked at home: 24 (4%)
Most commonly used house heating fuel:
- Utility gas (46%)
- Electricity (24%)
- Bottled, tank, or LP gas (19%)
- Wood (5%)
- Fuel oil, kerosene, etc. (4%)
- Other fuel (2%)
96.6% of residents of Rome township speak English at home.
2.1% of residents speak Spanish at home (100% speak English very well).
0.8% of residents speak other Indo-European language at home (100% speak English very well).
0.4% of residents speak Asian or Pacific Island language at home (100% speak English very well).
Household type by relationship:
Households: 1,521- In family households: 1,372 (363 male householders, 72 female householders)
383 spouses, 474 children (456 natural, 5 adopted, 13 stepchildren), 9 grandchildren, 0 brothers or sisters, 9 parents, 8 other relatives, 54 non-relatives
- In nonfamily households: 149 (81 male householders (66 living alone)), 17 female householders (17 living alone)), 51 nonrelatives
Size of family households: 206 2-persons, 60 3-persons, 101 4-persons, 59 5-persons, 5 6-persons, 4 7-or-more-persons,
Size of nonfamily households: 83 1-person, 6 2-persons, 4 3-persons, 5 5-persons,
274 married couples with children.
62 single-parent households (13 men, 49 women).
Private vs. public school enrollment:
Students in private schools in grades 1 to 8 (elementary and middle school): 0
| Here: | 0.0% |
| Ohio: | 14.2% |
Students in private schools in grades 9 to 12 (high school): 20
| Here: | 18.2% |
| Ohio: | 10.9% |
Students in private undergraduate colleges: 0
| Here: | 0.0% |
| Ohio: | 23.4% |