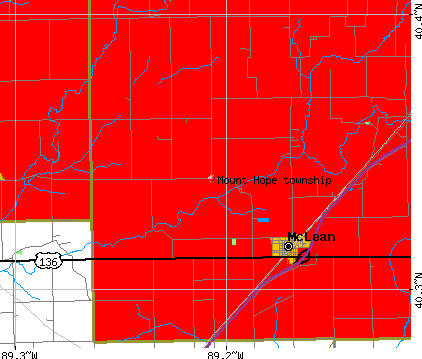
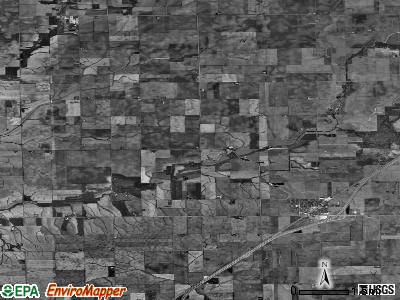
Mount Hope township, McLean County, Illinois (IL) detailed profile
Number of foreign born residents: 1 (100% naturalized citizens)
| Mount Hope township: | 1.0% |
| Whole state: | 12.3% |
75% of Mount Hope township residents lived in the same house 5 years ago.
Out of people who lived in different houses, 67% lived in this county.
Out of people who lived in different counties, 79% lived in Illinois.
Place of birth for U.S.-born residents:
- This state: 937
- Northeast: 6
- Midwest: 84
- South: 61
- West: 18
Median price asked for vacant for-sale houses in 2000: $72,500
Percentage of households with unmarried partners: 3.5%
Likely homosexual households (counted as self-reported same-sex unmarried-partner households)
- Lesbian couples: 0.5% of all households
- Gay men: 0.0% of all households
44 people in nursing homes
Housing units in structures:
- One, detached: 427
- Two: 5
- 3 or 4: 2
- 10 to 19: 2
- Mobile homes: 10
Median worth of mobile homes: $27,500
Housing units in Mount Hope township with a mortgage: 205 (23 second mortgage, 33 home equity loan, 0 both second mortgage and home equity loan)
Houses without a mortgage: 114
- Construction (15%)
- Agriculture, forestry, fishing and hunting (11%)
- Truck transportation (8%)
- Finance and insurance (6%)
- Transportation equipment (6%)
- Administrative and support and waste management services (6%)
- Educational services (4%)
- Finance and insurance (26%)
- Health care (12%)
- Educational services (10%)
- Administrative and support and waste management services (7%)
- Social assistance (7%)
- Accommodation and food services (6%)
- Professional, scientific, and technical services (4%)
- Other production occupations including supervisors (10%)
- Farmers and farm managers (9%)
- Driver/sales workers and truck drivers (8%)
- Electrical equipment mechanics and other installation, maintenance, and repair occupations including supervisors (7%)
- Building and grounds cleaning and maintenance occupations (7%)
- Vehicle and mobile equipment mechanics, installers, and repairers (5%)
- Construction laborers (4%)
- Other office and administrative support workers including supervisors (10%)
- Secretaries and administrative assistants (9%)
- Information and record clerks except customer service representatives (6%)
- Other production occupations including supervisors (5%)
- Business operations specialists (5%)
- Computer specialists (4%)
- Financial clerks except bookkeeping, accounting, and auditing clerks (4%)
Most common first ancestries reported in Mount Hope township:
- German (31.7%)
- United States or American (29.3%)
- English (10.9%)
- Irish (9.1%)
- Italian (3.3%)
- French (except Basque) (2.2%)
- Swedish (2.2%)
Most common places of birth for the foreign-born residents:
- Taiwan (33%)
- United Kingdom (25%)
- Jordan (25%)
- India (17%)
Means of transportation to work:
- Drove a car alone: 517 (86%)
- Carpooled: 40 (7%)
- Walked: 7 (1%)
- Other means: 9 (1%)
- Worked at home: 29 (5%)
Most commonly used house heating fuel:
- Utility gas (74%)
- Bottled, tank, or LP gas (20%)
- Electricity (4%)
- Fuel oil, kerosene, etc. (2%)
44 people in nursing homes
98.8% of residents of Mount Hope township speak English at home.
0.2% of residents speak Spanish at home (100% don't speak English at all).
0.5% of residents speak other Indo-European language at home (100% speak English very well).
0.4% of residents speak Asian or Pacific Island language at home (100% speak English well).
0.2% of residents speak other language at home (100% speak English well).
Household type by relationship:
Households: 1,076- In family households: 1,006 (293 male householders, 53 female householders)
312 spouses, 322 children (313 natural, 5 adopted, 4 stepchildren), 5 grandchildren, 2 brothers or sisters, 7 parents, 0 other relatives, 12 non-relatives
- In nonfamily households: 70 (19 male householders (19 living alone)), 48 female householders (46 living alone)), 3 nonrelatives
- In group quarters: 44 (all institutionalized)
Size of family households: 169 2-persons, 69 3-persons, 83 4-persons, 25 5-persons,
Size of nonfamily households: 65 1-person, 2 2-persons,
220 married couples with children.
59 single-parent households (18 men, 41 women).
Private vs. public school enrollment:
Students in private schools in grades 1 to 8 (elementary and middle school): 9
| Here: | 7.6% |
| Illinois: | 13.4% |
Students in private schools in grades 9 to 12 (high school): 2
| Here: | 2.9% |
| Illinois: | 11.1% |
Students in private undergraduate colleges: 0
| Here: | 0.0% |
| Illinois: | 25.8% |