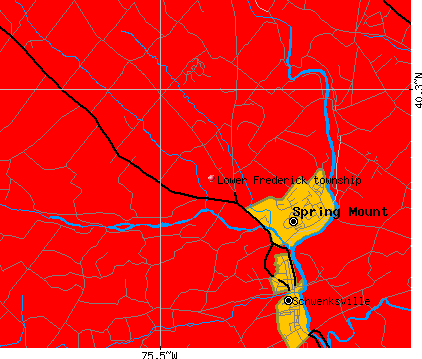
Lower Frederick township, Montgomery County, Pennsylvania (PA) detailed profile
Number of foreign born residents: 0 (40% naturalized citizens)
| Lower Frederick township: | 0.1% |
| Whole state: | 4.1% |
53% of Lower Frederick township residents lived in the same house 5 years ago.
Out of people who lived in different houses, 59% lived in this county.
Out of people who lived in different counties, 31% lived in Pennsylvania.
Place of birth for U.S.-born residents:
- This state: 506
- Northeast: 19
- Midwest: 100
- South: 155
- West: 98
Median price asked for vacant for-sale houses in 2000: $30,000
Percentage of households with unmarried partners: 6.0%
Likely homosexual households (counted as self-reported same-sex unmarried-partner households)
- Lesbian couples: 0.4% of all households
- Gay men: 0.0% of all households
Housing units in structures:
- One, detached: 268
- One, attached: 2
- Mobile homes: 79
Median worth of mobile homes: $42,500
Housing units in Lower Frederick township with a mortgage: 47 (7 second mortgage, 0 home equity loan, 0 both second mortgage and home equity loan)
Houses without a mortgage: 27
- Metal and metal products (14%)
- Food (13%)
- Construction (11%)
- Agriculture, forestry, fishing and hunting (11%)
- Truck transportation (7%)
- Educational services (4%)
- Arts, entertainment, and recreation (4%)
- Health care (12%)
- Food (12%)
- Electrical equipment, appliances, and components (10%)
- Department and other general merchandise stores (10%)
- Educational services (5%)
- Social assistance (5%)
- Accommodation and food services (5%)
- Other production occupations including supervisors (13%)
- Electrical equipment mechanics and other installation, maintenance, and repair occupations including supervisors (12%)
- Driver/sales workers and truck drivers (10%)
- Metal workers and plastic workers (9%)
- Farmers and farm managers (5%)
- Agricultural workers including supervisors (4%)
- Laborers and material movers, hand (4%)
- Assemblers and fabricators (10%)
- Other production occupations including supervisors (9%)
- Retail sales workers except cashiers (7%)
- Other office and administrative support workers including supervisors (6%)
- Secretaries and administrative assistants (5%)
- Cooks and food preparation workers (5%)
- Bookkeeping, accounting, and auditing clerks (5%)
Most common first ancestries reported in Lower Frederick township:
- United States or American (34.4%)
- German (16.8%)
- Irish (12.6%)
- English (7.9%)
- Italian (2.5%)
- Swedish (2.2%)
- European (2.0%)
Most common places of birth for the foreign-born residents:
- Mexico (60%)
- Germany (40%)
Means of transportation to work:
- Drove a car alone: 285 (80%)
- Carpooled: 54 (15%)
- Walked: 2 (1%)
- Other means: 9 (3%)
- Worked at home: 8 (2%)
Most commonly used house heating fuel:
- Bottled, tank, or LP gas (54%)
- Wood (26%)
- Electricity (14%)
- Utility gas (5%)
- Other fuel (1%)
- No fuel used (1%)
97.7% of residents of Lower Frederick township speak English at home.
0.5% of residents speak Spanish at home (100% speak English very well).
1.1% of residents speak other Indo-European language at home (100% speak English very well).
0.2% of residents speak Asian or Pacific Island language at home (100% speak English very well).
0.5% of residents speak other language at home (100% speak English very well).
Household type by relationship:
Households: 883- In family households: 795 (203 male householders, 42 female householders)
200 spouses, 284 children (236 natural, 20 adopted, 28 stepchildren), 25 grandchildren, 4 brothers or sisters, 0 parents, 7 other relatives, 30 non-relatives
- In nonfamily households: 88 (42 male householders (30 living alone)), 20 female householders (18 living alone)), 26 nonrelatives
Size of family households: 90 2-persons, 53 3-persons, 61 4-persons, 22 5-persons, 14 6-persons, 5 7-or-more-persons,
Size of nonfamily households: 48 1-person, 4 2-persons, 8 3-persons, 2 4-persons,
1,135 married couples with children.
205 single-parent households (64 men, 141 women).
Private vs. public school enrollment:
Students in private schools in grades 1 to 8 (elementary and middle school): 2
| Here: | 1.4% |
| Pennsylvania: | 16.0% |
Students in private schools in grades 9 to 12 (high school): 0
| Here: | 0.0% |
| Pennsylvania: | 13.1% |
Students in private undergraduate colleges: 2
| Here: | 11.8% |
| Pennsylvania: | 37.3% |