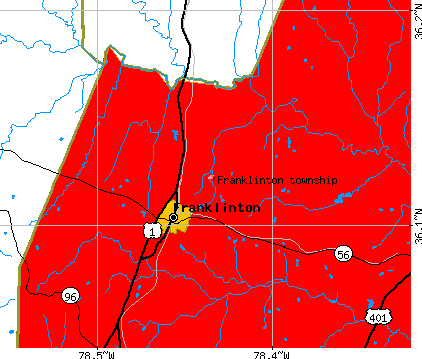
Franklinton township, Franklin County, North Carolina (NC) detailed profile
Number of foreign born residents: 0 (22% naturalized citizens)
| Franklinton township: | 0.1% |
| Whole state: | 5.3% |
55% of Franklinton township residents lived in the same house 5 years ago.
Out of people who lived in different houses, 52% lived in this county.
Out of people who lived in different counties, 6% lived in North Carolina.
Place of birth for U.S.-born residents:
- This state: 145
- Northeast: 6
- Midwest: 37
- South: 91
- West: 33
Median price asked for vacant for-sale houses in 2000: $75,000
Percentage of households with unmarried partners: 5.4%
Likely homosexual households (counted as self-reported same-sex unmarried-partner households)
- Lesbian couples: 0.3% of all households
- Gay men: 0.4% of all households
2 people in other noninstitutional group quarters

Housing units in structures:
- One, detached: 102
- One, attached: 2
- Mobile homes: 43
Median worth of mobile homes: $13,800
Housing units in Franklinton township with a mortgage: 12 (0 second mortgage, 0 home equity loan, 0 both second mortgage and home equity loan)
Houses without a mortgage: 11
- Agriculture, forestry, fishing and hunting (16%)
- Construction (16%)
- Food (9%)
- Transportation equipment (9%)
- Repair and maintenance (7%)
- Building material and garden equipment and supplies dealers (4%)
- Department and other general merchandise stores (4%)
- Health care (12%)
- Accommodation and food services (12%)
- Agriculture, forestry, fishing and hunting (10%)
- Educational services (7%)
- Food (6%)
- Computer and electronic products (6%)
- Department and other general merchandise stores (6%)
- Driver/sales workers and truck drivers (16%)
- Other production occupations including supervisors (12%)
- Farmers and farm managers (8%)
- Construction trades workers except carpenters, electricians, painters, plumbers, and construction laborers (8%)
- Agricultural workers including supervisors (5%)
- Building and grounds cleaning and maintenance occupations (4%)
- Vehicle and mobile equipment mechanics, installers, and repairers (4%)
- Other production occupations including supervisors (10%)
- Health technologists and technicians (9%)
- Other management occupations except farmers and farm managers (7%)
- Other office and administrative support workers including supervisors (7%)
- Waiters and waitresses (6%)
- Agricultural workers including supervisors (6%)
- Farmers and farm managers (4%)
Most common first ancestries reported in Franklinton township:
- United States or American (29.2%)
- English (13.1%)
- Irish (8.1%)
- German (7.6%)
- Dutch (5.1%)
- British (3.4%)
- Norwegian (3.0%)
Most common places of birth for the foreign-born residents:
- Mexico (78%)
- Panama (22%)
Means of transportation to work:
- Drove a car alone: 114 (73%)
- Carpooled: 27 (17%)
- Walked: 4 (3%)
- Worked at home: 12 (8%)
Most commonly used house heating fuel:
- Bottled, tank, or LP gas (48%)
- Wood (39%)
- Electricity (13%)
2 people in other noninstitutional group quarters
91.5% of residents of Franklinton township speak English at home.
7.8% of residents speak Spanish at home (67% speak English very well, 33% speak English not well).
0.7% of residents speak other Indo-European language at home (100% speak English very well).
Household type by relationship:
Households: 329- In family households: 290 (98 male householders, 3 female householders)
96 spouses, 70 children (60 natural, 2 adopted, 8 stepchildren), 18 grandchildren, 0 brothers or sisters, 0 parents, 5 other relatives, 0 non-relatives
- In nonfamily households: 39 (19 male householders (14 living alone)), 13 female householders (13 living alone)), 7 nonrelatives
Size of family households: 57 2-persons, 20 3-persons, 10 4-persons, 9 5-persons, 2 6-persons, 3 7-or-more-persons,
Size of nonfamily households: 27 1-person, 3 2-persons, 2 4-persons,
1,110 married couples with children.
550 single-parent households (120 men, 430 women).
Private vs. public school enrollment:
Students in private schools in grades 1 to 8 (elementary and middle school): 0
| Here: | 0.0% |
| North Carolina: | 8.2% |
Students in private schools in grades 9 to 12 (high school): 0
| Here: | 0.0% |
| North Carolina: | 6.9% |
Students in private undergraduate colleges: 2
| Here: | 50.0% |
| North Carolina: | 20.2% |