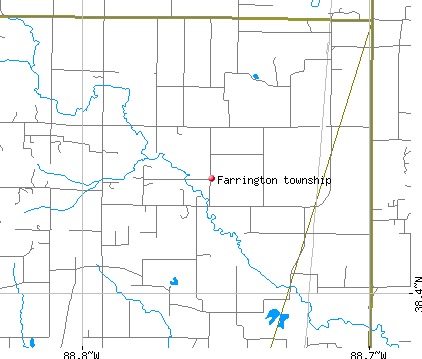
Farrington township, Jefferson County, Illinois (IL) detailed profile
Number of foreign born residents: 7 (47% naturalized citizens)
| Farrington township: | 6.5% |
| Whole state: | 12.3% |
64% of Farrington township residents lived in the same house 5 years ago.
Out of people who lived in different houses, 59% lived in this county.
Out of people who lived in different counties, 91% lived in Illinois.
Place of birth for U.S.-born residents:
- This state: 2346
- Northeast: 41
- Midwest: 24
- South: 60
- West: 33
Median price asked for vacant for-sale houses in 2000: $91,700
Percentage of households with unmarried partners: 6.8%
No gay or lesbian households reported

Housing units in structures:
- One, detached: 938
- One, attached: 25
- Two: 12
- 3 or 4: 2
- 5 to 9: 34
- 20 to 49: 4
- Mobile homes: 76
Median worth of mobile homes: $42,200
Housing units in Farrington township with a mortgage: 391 (42 second mortgage, 69 home equity loan, 0 both second mortgage and home equity loan)
Houses without a mortgage: 281
- Plastics and rubber products (16%)
- Agriculture, forestry, fishing and hunting (11%)
- Construction (9%)
- Accommodation and food services (7%)
- Machinery, equipment, and supplies merchant wholesalers (6%)
- Building material and garden equipment and supplies dealers (4%)
- Repair and maintenance (4%)
- Health care (24%)
- Educational services (11%)
- Accommodation and food services (11%)
- Pharmacies and drug stores (9%)
- Department and other general merchandise stores (7%)
- Miscellaneous manufacturing (6%)
- Data processing, libraries, and other information services (4%)
- Other production occupations including supervisors (19%)
- Other sales and related workers including supervisors (10%)
- Farmers and farm managers (8%)
- Driver/sales workers and truck drivers (7%)
- Electrical equipment mechanics and other installation, maintenance, and repair occupations including supervisors (5%)
- Metal workers and plastic workers (5%)
- Other management occupations except farmers and farm managers (3%)
- Other management occupations except farmers and farm managers (7%)
- Cooks and food preparation workers (7%)
- Cashiers (7%)
- Material recording, scheduling, dispatching, and distributing workers (7%)
- Other office and administrative support workers including supervisors (7%)
- Health technologists and technicians (5%)
- Supervisors and other personal care and service workers except personal appearance, transportation, and child care workers (5%)
Most common first ancestries reported in Farrington township:
- German (46.7%)
- United States or American (15.1%)
- English (6.9%)
- Irish (5.4%)
- Italian (4.4%)
- Dutch (2.7%)
- Scotch-Irish (2.1%)
Most common places of birth for the foreign-born residents:
- Korea (53%)
- Cambodia (28%)
- Other Eastern Europe (11%)
- India (8%)
Means of transportation to work:
- Drove a car alone: 883 (80%)
- Carpooled: 162 (15%)
- Walked: 15 (1%)
- Worked at home: 42 (4%)
Most commonly used house heating fuel:
- Fuel oil, kerosene, etc. (51%)
- Electricity (30%)
- Wood (8%)
- Bottled, tank, or LP gas (6%)
- Other fuel (2%)
- Coal or coke (2%)
- No fuel used (1%)
96.4% of residents of Farrington township speak English at home.
0.2% of residents speak Spanish at home (100% speak English very well).
2.3% of residents speak other Indo-European language at home (65% speak English very well, 27% speak English well, 7% speak English not well).
1.1% of residents speak Asian or Pacific Island language at home (31% speak English very well, 54% speak English well, 15% speak English not well).
Household type by relationship:
Households: 2,374- In family households: 2,108 (653 male householders, 73 female householders)
657 spouses, 667 children (599 natural, 12 adopted, 56 stepchildren), 14 grandchildren, 13 brothers or sisters, 11 parents, 8 other relatives, 12 non-relatives
- In nonfamily households: 266 (112 male householders (88 living alone)), 118 female householders (112 living alone)), 36 nonrelatives
- In group quarters: 171 (162 institutionalized population)
Size of family households: 353 2-persons, 196 3-persons, 114 4-persons, 38 5-persons, 14 6-persons, 11 7-or-more-persons,
Size of nonfamily households: 200 1-person, 23 2-persons, 7 3-persons,
111 married couples with children.
30 single-parent households (9 men, 21 women).
Private vs. public school enrollment:
Students in private schools in grades 1 to 8 (elementary and middle school): 20
| Here: | 7.2% |
| Illinois: | 13.4% |
Students in private schools in grades 9 to 12 (high school): 17
| Here: | 14.5% |
| Illinois: | 11.1% |
Students in private undergraduate colleges: 8
| Here: | 22.9% |
| Illinois: | 25.8% |