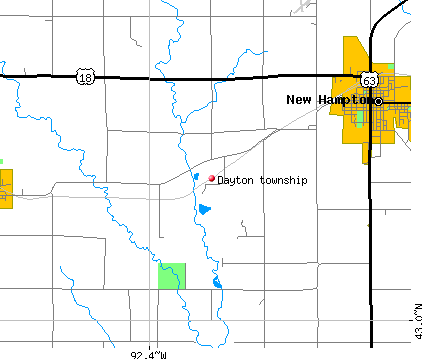
Dayton township, Chickasaw County, Iowa (IA) detailed profile
Number of foreign born residents: 0 (100% naturalized citizens)
| Dayton township: | 0.1% |
| Whole state: | 3.1% |
66% of Dayton township residents lived in the same house 5 years ago.
Out of people who lived in different houses, 77% lived in this county.
Out of people who lived in different counties, 48% lived in Iowa.
Place of birth for U.S.-born residents:
- This state: 681
- Northeast: 0
- Midwest: 125
- South: 76
- West: 29
Median price asked for vacant for-sale houses in 2000: $12,500
Percentage of households with unmarried partners: 4.3%
Likely homosexual households (counted as self-reported same-sex unmarried-partner households)
- Lesbian couples: 0.3% of all households
- Gay men: 0.0% of all households
32 people in other noninstitutional group quarters
12 people in homes for the mentally retarded
Housing units in structures:
- One, detached: 267
- 5 to 9: 5
- Mobile homes: 93
Median worth of mobile homes: $26,200
Housing units in Dayton township with a mortgage: 79 (2 second mortgage, 0 home equity loan, 0 both second mortgage and home equity loan)
Houses without a mortgage: 51
- Construction (25%)
- Wood products (14%)
- Metal and metal products (9%)
- Miscellaneous manufacturing (9%)
- Motor vehicle and parts dealers (8%)
- Agriculture, forestry, fishing and hunting (7%)
- Machinery (6%)
- Health care (16%)
- Social assistance (9%)
- Miscellaneous manufacturing (9%)
- Computer and electronic products (8%)
- Wood products (7%)
- Accommodation and food services (6%)
- Plastics and rubber products (5%)
- Other production occupations including supervisors (15%)
- Metal workers and plastic workers (13%)
- Pipelayers, plumbers, pipefitters, and steamfitters (7%)
- Building and grounds cleaning and maintenance occupations (7%)
- Electrical equipment mechanics and other installation, maintenance, and repair occupations including supervisors (7%)
- Driver/sales workers and truck drivers (6%)
- Farmers and farm managers (5%)
- Assemblers and fabricators (21%)
- Health technologists and technicians (8%)
- Other management occupations except farmers and farm managers (7%)
- Cashiers (7%)
- Registered nurses (6%)
- Cooks and food preparation workers (6%)
- Metal workers and plastic workers (6%)
Most common first ancestries reported in Dayton township:
- United States or American (38.6%)
- German (15.0%)
- Irish (13.5%)
- English (8.1%)
- Czech (1.7%)
- Canadian (1.6%)
- French (except Basque) (1.4%)
Most common places of birth for the foreign-born residents:
- Philippines (100%)
Means of transportation to work:
- Drove a car alone: 326 (72%)
- Carpooled: 104 (23%)
- Walked: 10 (2%)
- Worked at home: 12 (3%)
Most commonly used house heating fuel:
- Bottled, tank, or LP gas (64%)
- Wood (24%)
- Electricity (6%)
- Fuel oil, kerosene, etc. (4%)
- Utility gas (2%)
32 people in other noninstitutional group quarters
12 people in homes for the mentally retarded
97.5% of residents of Dayton township speak English at home.
1.3% of residents speak Spanish at home (100% speak English very well).
0.9% of residents speak other Indo-European language at home (38% speak English very well, 63% speak English not well).
0.2% of residents speak Asian or Pacific Island language at home (100% speak English very well).
Household type by relationship:
Households: 914- In family households: 857 (238 male householders, 24 female householders)
266 spouses, 303 children (267 natural, 7 adopted, 29 stepchildren), 6 grandchildren, 0 brothers or sisters, 0 parents, 1 other relatives, 19 non-relatives
- In nonfamily households: 57 (32 male householders (28 living alone)), 18 female householders (15 living alone)), 7 nonrelatives
Size of family households: 102 2-persons, 74 3-persons, 49 4-persons, 33 5-persons, 4 6-persons,
Size of nonfamily households: 43 1-person, 7 2-persons,
340 married couples with children.
78 single-parent households (16 men, 62 women).
Private vs. public school enrollment:
Students in private schools in grades 1 to 8 (elementary and middle school): 14
| Here: | 12.6% |
| Iowa: | 10.8% |
Students in private schools in grades 9 to 12 (high school): 0
| Here: | 0.0% |
| Iowa: | 7.1% |
Students in private undergraduate colleges: 2
| Here: | 4.2% |
| Iowa: | 25.4% |