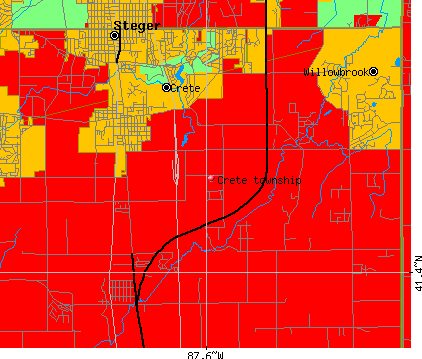
Crete township, Will County, Illinois (IL) detailed profile
Number of foreign born residents: 3 (55% naturalized citizens)
| Crete township: | 3.2% |
| Whole state: | 12.3% |
63% of Crete township residents lived in the same house 5 years ago.
Out of people who lived in different houses, 28% lived in this county.
Out of people who lived in different counties, 83% lived in Illinois.
Place of birth for U.S.-born residents:
- This state: 18202
- Northeast: 436
- Midwest: 2216
- South: 1510
- West: 393
Median price asked for vacant for-sale houses in 2000: $119,200
Percentage of households with unmarried partners: 4.7%
Likely homosexual households (counted as self-reported same-sex unmarried-partner households)
- Lesbian couples: 0.2% of all households
- Gay men: 0.1% of all households
People in group quarters in Crete township, Illinois:
- 128 people in nursing homes
- 108 people in other group homes
- 10 people in other noninstitutional group quarters
- 2 people in religious group quarters
Housing units in structures:
- One, detached: 6,628
- One, attached: 436
- Two: 373
- 3 or 4: 144
- 5 to 9: 224
- 10 to 19: 446
- 20 to 49: 161
- 50 or more: 365
- Mobile homes: 684
Median worth of mobile homes: $29,300
Housing units in Crete township with a mortgage: 4,361 (466 second mortgage, 594 home equity loan, 11 both second mortgage and home equity loan)
Houses without a mortgage: 1,588
- Construction (17%)
- Metal and metal products (5%)
- Professional, scientific, and technical services (5%)
- Educational services (5%)
- Public administration (4%)
- Transportation equipment (4%)
- Administrative and support and waste management services (4%)
- Health care (15%)
- Educational services (14%)
- Finance and insurance (8%)
- Accommodation and food services (7%)
- Professional, scientific, and technical services (6%)
- Construction (4%)
- Public administration (4%)
- Electrical equipment mechanics and other installation, maintenance, and repair occupations including supervisors (6%)
- Other management occupations except farmers and farm managers (6%)
- Other production occupations including supervisors (5%)
- Driver/sales workers and truck drivers (5%)
- Building and grounds cleaning and maintenance occupations (4%)
- Metal workers and plastic workers (4%)
- Other sales and related workers including supervisors (4%)
- Other office and administrative support workers including supervisors (7%)
- Preschool, kindergarten, elementary and middle school teachers (5%)
- Secretaries and administrative assistants (5%)
- Registered nurses (5%)
- Other management occupations except farmers and farm managers (4%)
- Bookkeeping, accounting, and auditing clerks (4%)
- Customer service representatives (4%)
Most common first ancestries reported in Crete township:
- German (20.9%)
- Italian (10.9%)
- Irish (10.3%)
- Polish (10.0%)
- English (5.5%)
- Dutch (4.0%)
- United States or American (3.6%)
Most common places of birth for the foreign-born residents:
- Mexico (23%)
- Germany (9%)
- Poland (9%)
- Yugoslavia (7%)
- United Kingdom (6%)
- Philippines (5%)
- Canada (4%)
Means of transportation to work:
- Drove a car alone: 10,004 (84%)
- Carpooled: 879 (7%)
- Bus or trolley bus: 12 (0%)
- Subway or elevated: 44 (0%)
- Railroad: 444 (4%)
- Motorcycle: 5 (0%)
- Bicycle: 5 (0%)
- Walked: 137 (1%)
- Other means: 34 (0%)
- Worked at home: 410 (3%)
Most commonly used house heating fuel:
- Utility gas (91%)
- Electricity (6%)
- Bottled, tank, or LP gas (1%)
People in group quarters in Crete township, Illinois:
- 128 people in nursing homes
- 108 people in other group homes
- 10 people in other noninstitutional group quarters
- 2 people in religious group quarters
94.1% of residents of Crete township speak English at home.
2.7% of residents speak Spanish at home (66% speak English very well, 21% speak English well, 12% speak English not well, 1% don't speak English at all).
2.5% of residents speak other Indo-European language at home (74% speak English very well, 10% speak English well, 15% speak English not well, 1% don't speak English at all).
0.3% of residents speak Asian or Pacific Island language at home (65% speak English very well, 9% speak English well, 26% speak English not well).
0.4% of residents speak other language at home (68% speak English very well, 18% speak English well, 15% speak English not well).
Household type by relationship:
Households: 23,365- In family households: 20,556 (5,413 male householders, 1,250 female householders)
5,399 spouses, 7,062 children (6,607 natural, 222 adopted, 233 stepchildren), 419 grandchildren, 158 brothers or sisters, 179 parents, 304 other relatives, 372 non-relatives
- In nonfamily households: 2,809 (1,121 male householders (926 living alone)), 1,317 female householders (1,204 living alone)), 371 nonrelatives
- In group quarters: 246 (127 institutionalized population)
Size of family households: 2,848 2-persons, 1,582 3-persons, 1,369 4-persons, 611 5-persons, 172 6-persons, 81 7-or-more-persons,
Size of nonfamily households: 2,130 1-person, 267 2-persons, 24 3-persons, 10 4-persons, 7 5-persons,
4,009 married couples with children.
1,022 single-parent households (268 men, 754 women).
Private vs. public school enrollment:
Students in private schools in grades 1 to 8 (elementary and middle school): 648
| Here: | 25.8% |
| Illinois: | 13.4% |
Students in private schools in grades 9 to 12 (high school): 295
| Here: | 22.1% |
| Illinois: | 11.1% |
Students in private undergraduate colleges: 260
| Here: | 22.7% |
| Illinois: | 25.8% |