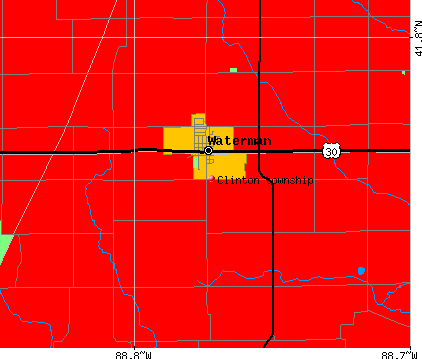
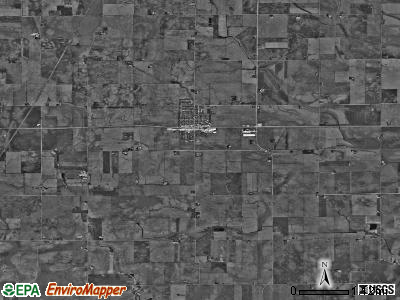
Clinton township, DeKalb County, Illinois (IL) detailed profile
Number of foreign born residents: 1 (54% naturalized citizens)
| Clinton township: | 1.4% |
| Whole state: | 12.3% |
63% of Clinton township residents lived in the same house 5 years ago.
Out of people who lived in different houses, 44% lived in this county.
Out of people who lived in different counties, 91% lived in Illinois.
Place of birth for U.S.-born residents:
- This state: 1468
- Northeast: 28
- Midwest: 115
- South: 61
- West: 10
Median price asked for vacant for-sale houses in 2000: $137,500
Percentage of households with unmarried partners: 3.1%
Likely homosexual households (counted as self-reported same-sex unmarried-partner households)
- Lesbian couples: 0.2% of all households
- Gay men: 0.3% of all households
Housing units in structures:
- One, detached: 526
- One, attached: 19
- Two: 36
- 3 or 4: 6
- 5 to 9: 6
- 10 to 19: 20
- 20 to 49: 30
- Mobile homes: 13
Median worth of mobile homes: $18,300
Housing units in Clinton township with a mortgage: 253 (19 second mortgage, 38 home equity loan, 0 both second mortgage and home equity loan)
Houses without a mortgage: 117
- Agriculture, forestry, fishing and hunting (16%)
- Construction (14%)
- Educational services (8%)
- Machinery (6%)
- Motor vehicle and parts dealers (5%)
- Professional, scientific, and technical services (4%)
- Public administration (3%)
- Educational services (14%)
- Health care (14%)
- Agriculture, forestry, fishing and hunting (9%)
- Accommodation and food services (7%)
- Finance and insurance (7%)
- Social assistance (7%)
- Professional, scientific, and technical services (4%)
- Farmers and farm managers (10%)
- Driver/sales workers and truck drivers (9%)
- Other production occupations including supervisors (7%)
- Sales representatives, services, wholesale and manufacturing (4%)
- Metal workers and plastic workers (4%)
- Engineers (3%)
- Building and grounds cleaning and maintenance occupations (3%)
- Registered nurses (7%)
- Building and grounds cleaning and maintenance occupations (6%)
- Other office and administrative support workers including supervisors (6%)
- Secretaries and administrative assistants (5%)
- Material recording, scheduling, dispatching, and distributing workers (5%)
- Cooks and food preparation workers (5%)
- Retail sales workers except cashiers (4%)
Most common first ancestries reported in Clinton township:
- German (30.0%)
- Norwegian (11.6%)
- United States or American (11.4%)
- English (7.8%)
- Irish (7.5%)
- Polish (5.8%)
- Italian (3.9%)
Most common places of birth for the foreign-born residents:
- Mexico (38%)
- Greece (21%)
- Philippines (17%)
- Germany (13%)
- Other Northern Europe (8%)
Means of transportation to work:
- Drove a car alone: 640 (76%)
- Carpooled: 61 (7%)
- Walked: 25 (3%)
- Other means: 2 (0%)
- Worked at home: 109 (13%)
Most commonly used house heating fuel:
- Utility gas (72%)
- Electricity (12%)
- Bottled, tank, or LP gas (11%)
- Fuel oil, kerosene, etc. (5%)
97.5% of residents of Clinton township speak English at home.
1.3% of residents speak Spanish at home (52% speak English very well, 19% speak English well, 29% speak English not well).
0.9% of residents speak other Indo-European language at home (100% speak English very well).
0.3% of residents speak Asian or Pacific Island language at home (100% speak English well).
Household type by relationship:
Households: 1,719- In family households: 1,547 (372 male householders, 98 female householders)
410 spouses, 626 children (573 natural, 20 adopted, 33 stepchildren), 12 grandchildren, 0 brothers or sisters, 2 parents, 8 other relatives, 19 non-relatives
- In nonfamily households: 172 (101 male householders (90 living alone)), 56 female householders (54 living alone)), 15 nonrelatives
Size of family households: 175 2-persons, 77 3-persons, 124 4-persons, 68 5-persons, 26 6-persons,
Size of nonfamily households: 144 1-person, 10 2-persons, 3 3-persons,
400 married couples with children.
69 single-parent households (12 men, 57 women).
Private vs. public school enrollment:
Students in private schools in grades 1 to 8 (elementary and middle school): 13
| Here: | 5.1% |
| Illinois: | 13.4% |
Students in private schools in grades 9 to 12 (high school): 5
| Here: | 3.8% |
| Illinois: | 11.1% |
Students in private undergraduate colleges: 11
| Here: | 19.3% |
| Illinois: | 25.8% |