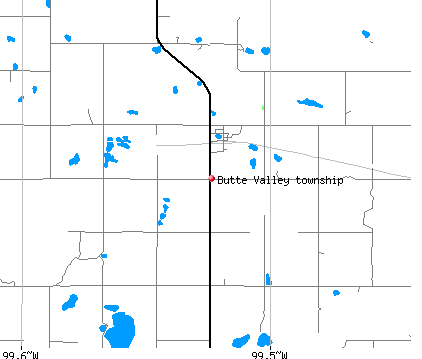
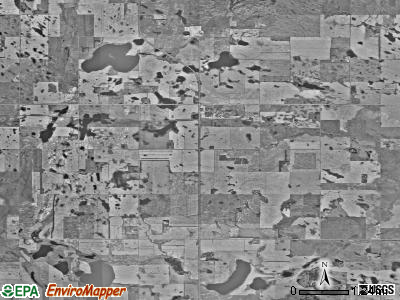
Butte Valley township, Benson County, North Dakota (ND) detailed profile
Land area: 35.4 sq. mi.
Water area: 0.6 sq. mi.
Population: 87 (all rural)
| Males: 57 | |
| Females: 30 |
Occupied houses/apartments: 87 (59 owner occupied, 28 renter occupied)
| % of renters here: | 32% |
| State: | 33% |
Races in Butte Valley township:
- White Non-Hispanic: 100.0%
Median age of males: 37.5
Median age of females: 37.5
Discuss North Dakota on our huge forum. We have over 16 million posts!
Average household size: 2.49
| Butte Valley township: | 2.5 people |
| North Dakota: | 2.4 people |
Average family size: 3.26
| Butte Valley township: | $37,861 |
| North Dakota: | $55,759 |
| Here: | $244 |
| State: | $622 |
Estimated median house or condo value in 2013: $61,972 (it was $32,200 in 2000)
| : | $61,972 |
| North Dakota: | $155,400 |
| Population density: 2 people per square mile | (very low). |
| This township: | 29.1% |
| Whole state: | 11.9% |
| This township: | 9.2% |
| Whole state: | 4.9% |
Notable locations in this township outside city limits:
Cemetery: Our Saviors Cemetery (1). Display/hide its location on the map
Lakes and swamps: Fish Lake (A), Sheep Lake (B). Display/hide their locations on the map
33% of Butte Valley township residents lived in the same house 5 years ago.
Out of people who lived in different houses, 4% lived in this county.
Out of people who lived in different counties, 12% lived in North Dakota.
Place of birth for U.S.-born residents:
- This state: 151
- Northeast: 3
- Midwest: 108
- South: 39
- West: 3
Percentage of households with unmarried partners: 0.0%
No gay or lesbian households reported
Housing units in structures:
- One, detached: 46
Housing units in Butte Valley township with a mortgage: 13 (0 second mortgage, 0 home equity loan, 0 both second mortgage and home equity loan)
Houses without a mortgage: 21
- Transportation equipment (12%)
- Construction (12%)
- Food (11%)
- Miscellaneous manufacturing (6%)
- Metal and metal products (5%)
- Electrical equipment, appliances, and components (4%)
- Accommodation and food services (4%)
- Health care (11%)
- Accommodation and food services (8%)
- Electrical equipment, appliances, and components (8%)
- Miscellaneous manufacturing (7%)
- Food (6%)
- Educational services (6%)
- Finance and insurance (5%)
- Other production occupations including supervisors (13%)
- Metal workers and plastic workers (8%)
- Assemblers and fabricators (6%)
- Laborers and material movers, hand (6%)
- Material recording, scheduling, dispatching, and distributing workers (6%)
- Driver/sales workers and truck drivers (4%)
- Electrical equipment mechanics and other installation, maintenance, and repair occupations including supervisors (4%)
- Other production occupations including supervisors (10%)
- Assemblers and fabricators (5%)
- Cashiers (5%)
- Other office and administrative support workers including supervisors (5%)
- Metal workers and plastic workers (5%)
- Other management occupations except farmers and farm managers (4%)
- Material recording, scheduling, dispatching, and distributing workers (4%)
Most common first ancestries reported in Butte Valley township:
- German (48.8%)
- Czech (14.0%)
- Irish (7.0%)
- Norwegian (3.9%)
- Welsh (2.3%)
Means of transportation to work:
- Drove a car alone: 67 (93%)
- Other means: 5 (7%)
Most commonly used house heating fuel:
- Bottled, tank, or LP gas (42%)
- Electricity (40%)
- Fuel oil, kerosene, etc. (9%)
- Wood (9%)
All residents speak only English at home
Household type by relationship:
Households: 133- In family households: 133 (31 male householders, 6 female householders)
30 spouses, 55 children (50 natural, 0 adopted, 5 stepchildren), 0 grandchildren, 0 brothers or sisters, 2 parents, 0 other relatives, 9 non-relatives
- In nonfamily households: 0 (0 male householders (0 living alone)), 0 female householders (0 living alone)), 0 nonrelatives
- In group quarters: 171 (0 institutionalized population)
Size of family households: 12 2-persons, 13 3-persons, 2 4-persons, 4 5-persons, 6 7-or-more-persons,
20 married couples with children.
5 single-parent households (3 men, 2 women).
Private vs. public school enrollment:
Students in private schools in grades 1 to 8 (elementary and middle school): 12
| Here: | 8.1% |
| North Dakota: | 7.1% |
Students in private schools in grades 9 to 12 (high school): 13
| Here: | 32.5% |
| North Dakota: | 6.0% |