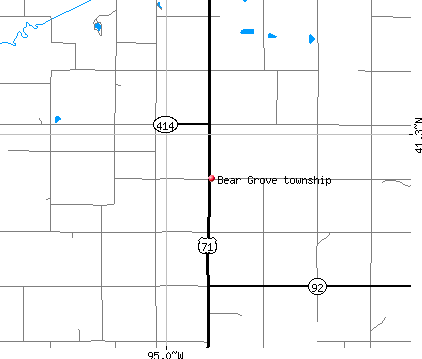
Bear Grove township, Cass County, Iowa (IA) detailed profile
Number of foreign born residents: 111 (22% naturalized citizens)
| Bear Grove township: | 110.7% |
| Whole state: | 3.1% |
59% of Bear Grove township residents lived in the same house 5 years ago.
Out of people who lived in different houses, 54% lived in this county.
Out of people who lived in different counties, 63% lived in Iowa.
Place of birth for U.S.-born residents:
- This state: 5017
- Northeast: 254
- Midwest: 135
- South: 492
- West: 77
Median price asked for vacant for-sale houses in 2000: $61,700
Percentage of households with unmarried partners: 3.0%
No gay or lesbian households reported
Housing units in structures:
- One, detached: 1,798
- One, attached: 39
- Two: 144
- 3 or 4: 77
- 5 to 9: 104
- 10 to 19: 27
- 20 to 49: 35
- 50 or more: 6
- Mobile homes: 626
Median worth of mobile homes: $28,600
Housing units in Bear Grove township with a mortgage: 603 (68 second mortgage, 165 home equity loan, 0 both second mortgage and home equity loan)
Houses without a mortgage: 473
- Construction (21%)
- Metal and metal products (12%)
- Food (10%)
- Truck transportation (8%)
- Repair and maintenance (6%)
- Agriculture, forestry, fishing and hunting (4%)
- Department and other general merchandise stores (4%)
- Truck transportation (9%)
- Educational services (9%)
- Repair and maintenance (9%)
- Food and beverage stores (7%)
- Department and other general merchandise stores (7%)
- Health care (7%)
- Accommodation and food services (6%)
- Driver/sales workers and truck drivers (12%)
- Vehicle and mobile equipment mechanics, installers, and repairers (10%)
- Other production occupations including supervisors (9%)
- Carpenters (7%)
- Metal workers and plastic workers (6%)
- Food processing workers (5%)
- Laborers and material movers, hand (5%)
- Cashiers (7%)
- Secretaries and administrative assistants (7%)
- Textile, apparel, and furnishings workers (7%)
- Cooks and food preparation workers (6%)
- Bookkeeping, accounting, and auditing clerks (6%)
- Material recording, scheduling, dispatching, and distributing workers (6%)
- Laborers and material movers, hand (6%)
Most common first ancestries reported in Bear Grove township:
- United States or American (35.8%)
- English (8.3%)
- Irish (5.2%)
- German (4.1%)
- Scotch-Irish (3.6%)
- Scottish (2.3%)
- Italian (1.9%)
Most common places of birth for the foreign-born residents:
- Mexico (61%)
- Guatemala (7%)
- India (6%)
- Turkey (5%)
- El Salvador (5%)
- Japan (3%)
- China, excluding Hong Kong and Taiwan (2%)
Means of transportation to work:
- Drove a car alone: 2,101 (72%)
- Carpooled: 610 (21%)
- Bus or trolley bus: 5 (0%)
- Subway or elevated: 2 (0%)
- Motorcycle: 5 (0%)
- Bicycle: 7 (0%)
- Walked: 76 (3%)
- Other means: 36 (1%)
- Worked at home: 58 (2%)
Most commonly used house heating fuel:
- Electricity (45%)
- Bottled, tank, or LP gas (26%)
- Utility gas (22%)
- Fuel oil, kerosene, etc. (5%)
- Wood (1%)
92.9% of residents of Bear Grove township speak English at home.
5.7% of residents speak Spanish at home (38% speak English very well, 13% speak English well, 34% speak English not well, 15% don't speak English at all).
0.8% of residents speak other Indo-European language at home (100% speak English very well).
0.7% of residents speak Asian or Pacific Island language at home (34% speak English very well, 50% speak English well, 16% speak English not well).
Household type by relationship:
Households: 6,304- In family households: 5,224 (1,292 male householders, 475 female householders)
1,246 spouses, 1,799 children (1,683 natural, 33 adopted, 83 stepchildren), 127 grandchildren, 55 brothers or sisters, 53 parents, 103 other relatives, 74 non-relatives
- In nonfamily households: 1,080 (364 male householders (283 living alone)), 531 female householders (488 living alone)), 185 nonrelatives
Size of family households: 803 2-persons, 457 3-persons, 334 4-persons, 120 5-persons, 39 6-persons, 14 7-or-more-persons,
Size of nonfamily households: 771 1-person, 88 2-persons, 22 3-persons, 10 4-persons, 4 7-or-more-persons,
71 married couples with children.
8 single-parent households (4 men, 4 women).
Private vs. public school enrollment:
Students in private schools in grades 1 to 8 (elementary and middle school): 19
| Here: | 2.8% |
| Iowa: | 10.8% |
Students in private schools in grades 9 to 12 (high school): 17
| Here: | 5.8% |
| Iowa: | 7.1% |
Students in private undergraduate colleges: 11
| Here: | 6.5% |
| Iowa: | 25.4% |