Races in Winthrop Harbor, Illinois (IL) Detailed Stats
Data:
Races - White alone (%)
Races - White alone (% change since 2000)
Races - Black alone (%)
Races - Black alone (% change since 2000)
Races - American Indian alone (%)
Races - American Indian alone (% change since 2000)
Races - Asian alone (%)
Races - Asian alone (% change since 2000)
Races - Hispanic (%)
Races - Hispanic (% change since 2000)
Races - Native Hawaiian and Other Pacific Islander alone (%)
Races - Native Hawaiian and Other Pacific Islander alone (% change since 2000)
Races - Two or more races(%)
Races - Two or more races(% change since 2000)
Races - Other race alone (%)
Races - Other race alone (% change since 2000)
Racial diversity
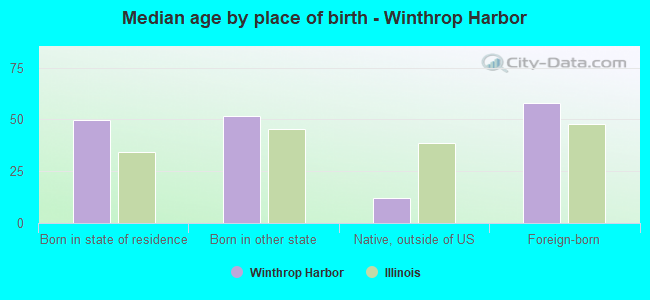
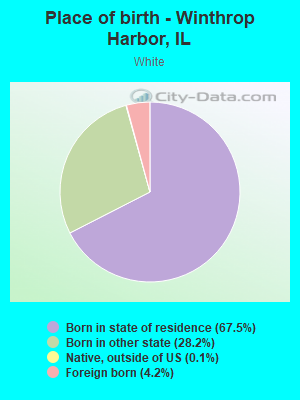
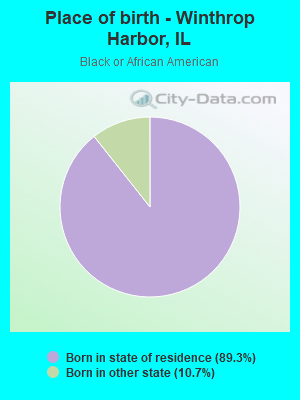
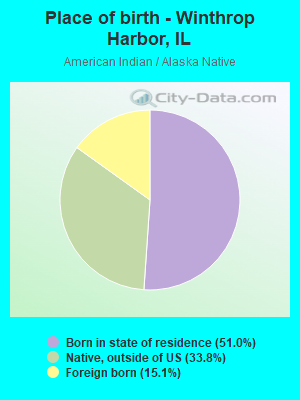
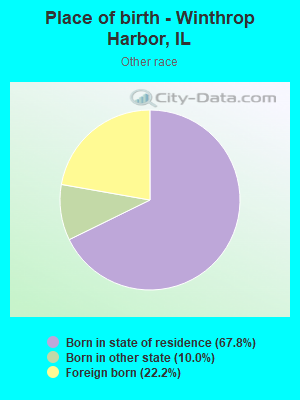
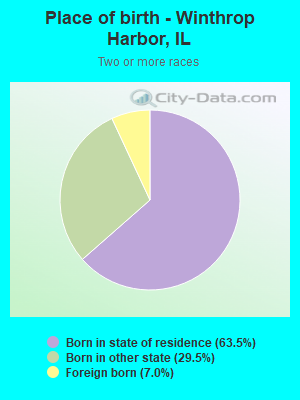
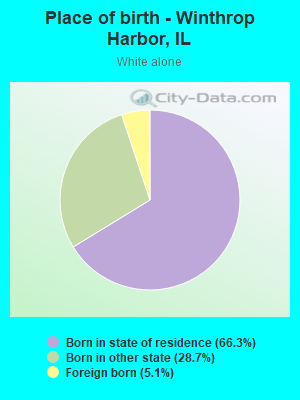
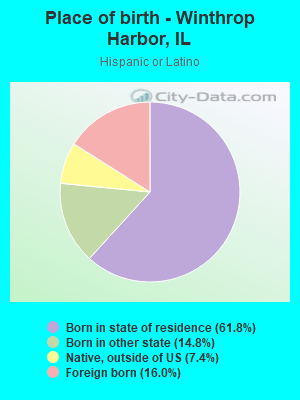
Place of birth - Born in state of residence (%)
Place of birth - Born in state of residence (%) - White
Place of birth - Born in state of residence (%) - Black or African American
Place of birth - Born in state of residence (%) - Asian
Place of birth - Born in state of residence (%) - Hispanic or Latino
Place of birth - Born in state of residence (%) - American Indian and Alaska Native
Place of birth - Born in state of residence (%) - Multirace
Place of birth - Born in state of residence (%) - Other Race
Place of birth - Born in other state (%)
Place of birth - Born in other state (%) - White
Place of birth - Born in other state (%) - Black or African American
Place of birth - Born in other state (%) - Asian
Place of birth - Born in other state (%) - Hispanic or Latino
Place of birth - Born in other state (%) - American Indian and Alaska Native
Place of birth - Born in other state (%) - Multirace
Place of birth - Born in other state (%) - Other Race
Place of birth - Native, outside of US (%)
Place of birth - Native, outside of US (%) - White
Place of birth - Native, outside of US (%) - Black or African American
Place of birth - Native, outside of US (%) - Asian
Place of birth - Native, outside of US (%) - Hispanic or Latino
Place of birth - Native, outside of US (%) - American Indian and Alaska Native
Place of birth - Native, outside of US (%) - Multirace
Place of birth - Native, outside of US (%) - Other Race
Place of birth - Foreign born (%)
Place of birth - Foreign born (%) - White
Place of birth - Foreign born (%) - Black or African American
Place of birth - Foreign born (%) - Asian
Place of birth - Foreign born (%) - Hispanic or Latino
Place of birth - Foreign born (%) - American Indian and Alaska Native
Place of birth - Foreign born (%) - Multirace
Place of birth - Foreign born (%) - Other Race
Residents speaking English at home (%)
Residents speaking English at home - Born in the United States (%)
Residents speaking English at home - Native, born elsewhere (%)
Residents speaking English at home - Foreign born (%)
Residents speaking Spanish at home (%)
Residents speaking Spanish at home - Born in the United States (%)
Residents speaking Spanish at home - Native, born elsewhere (%)
Residents speaking Spanish at home - Foreign born (%)
Residents speaking other language at home (%)
Residents speaking other language at home - Born in the United States (%)
Residents speaking other language at home - Native, born elsewhere (%)
Residents speaking other language at home - Foreign born (%)
Marital status - Never married (%)
Marital status - Now married (%)
Marital status - Separated (%)
Marital status - Widowed (%)
Marital status - Divorced (%)
Ancestries Reported - Arab (%)
Ancestries Reported - Czech (%)
Ancestries Reported - Danish (%)
Ancestries Reported - Dutch (%)
Ancestries Reported - English (%)
Ancestries Reported - French (%)
Ancestries Reported - French Canadian (%)
Ancestries Reported - German (%)
Ancestries Reported - Greek (%)
Ancestries Reported - Hungarian (%)
Ancestries Reported - Irish (%)
Ancestries Reported - Italian (%)
Ancestries Reported - Lithuanian (%)
Ancestries Reported - Norwegian (%)
Ancestries Reported - Polish (%)
Ancestries Reported - Portuguese (%)
Ancestries Reported - Russian (%)
Ancestries Reported - Scotch-Irish (%)
Ancestries Reported - Scottish (%)
Ancestries Reported - Slovak (%)
Ancestries Reported - Subsaharan African (%)
Ancestries Reported - Swedish (%)
Ancestries Reported - Swiss (%)
Ancestries Reported - Ukrainian (%)
Ancestries Reported - United States (%)
Ancestries Reported - Welsh (%)
Ancestries Reported - West Indian (%)
Ancestries Reported - Other (%)
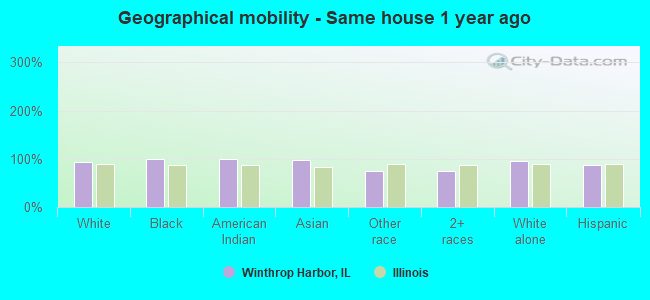
Geographical mobility - Same house 1 year ago (%)
Geographical mobility - Same house 1 year ago (%) - White
Geographical mobility - Same house 1 year ago (%) - Black or African American
Geographical mobility - Same house 1 year ago (%) - Asian
Geographical mobility - Same house 1 year ago (%) - Hispanic or Latino
Geographical mobility - Same house 1 year ago (%) - American Indian and Alaska Native
Geographical mobility - Same house 1 year ago (%) - Multirace
Geographical mobility - Same house 1 year ago (%) - Other Race
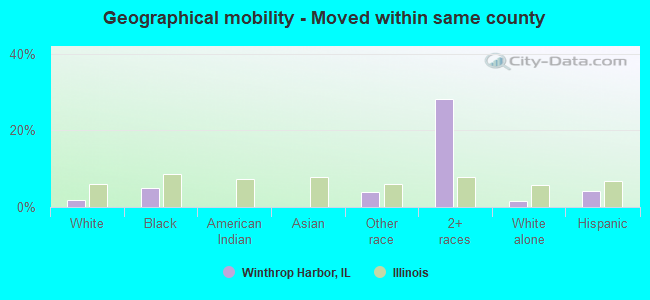
Geographical mobility - Moved within same county (%)
Geographical mobility - Moved within same county (%) - White
Geographical mobility - Moved within same county (%) - Black or African American
Geographical mobility - Moved within same county (%) - Asian
Geographical mobility - Moved within same county (%) - Hispanic or Latino
Geographical mobility - Moved within same county (%) - American Indian and Alaska Native
Geographical mobility - Moved within same county (%) - Multirace
Geographical mobility - Moved within same county (%) - Other Race
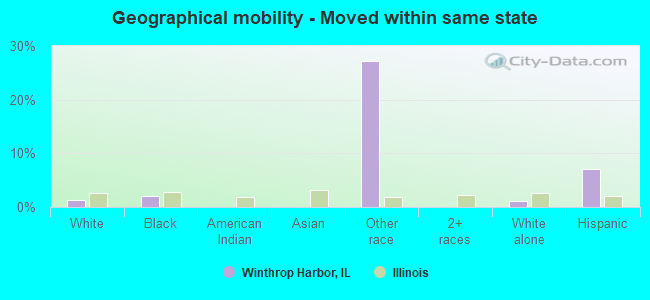
Geographical mobility - Moved from different county within same state (%)
Geographical mobility - Moved from different county within same state (%) - White
Geographical mobility - Moved from different county within same state (%) - Black or African American
Geographical mobility - Moved from different county within same state (%) - Asian
Geographical mobility - Moved from different county within same state (%) - Hispanic or Latino
Geographical mobility - Moved from different county within same state (%) - American Indian and Alaska Native
Geographical mobility - Moved from different county within same state (%) - Multirace
Geographical mobility - Moved from different county within same state (%) - Other Race
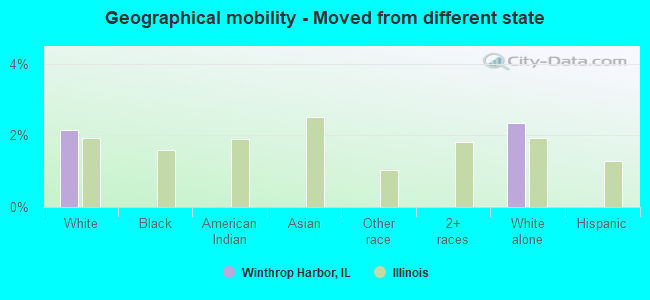
Geographical mobility - Moved from different state (%)
Geographical mobility - Moved from different state (%) - White
Geographical mobility - Moved from different state (%) - Black or African American
Geographical mobility - Moved from different state (%) - Asian
Geographical mobility - Moved from different state (%) - Hispanic or Latino
Geographical mobility - Moved from different state (%) - American Indian and Alaska Native
Geographical mobility - Moved from different state (%) - Multirace
Geographical mobility - Moved from different state (%) - Other Race
Geographical mobility - Moved from abroad (%)
Geographical mobility - Moved from abroad (%) - White
Geographical mobility - Moved from abroad (%) - Black or African American
Geographical mobility - Moved from abroad (%) - Asian
Geographical mobility - Moved from abroad (%) - Hispanic or Latino
Geographical mobility - Moved from abroad (%) - American Indian and Alaska Native
Geographical mobility - Moved from abroad (%) - Multirace
Geographical mobility - Moved from abroad (%) - Other Race
Place of birth for the foreign-born population - Ireland (%)
Place of birth for the foreign-born population - Denmark (%)
Place of birth for the foreign-born population - Norway (%)
Place of birth for the foreign-born population - Sweden (%)
Place of birth for the foreign-born population - United Kingdom (%)
Place of birth for the foreign-born population - England (%)
Place of birth for the foreign-born population - Scotland (%)
Place of birth for the foreign-born population - Other Northern Europe (%)
Place of birth for the foreign-born population - Austria (%)
Place of birth for the foreign-born population - Belgium (%)
Place of birth for the foreign-born population - France (%)
Place of birth for the foreign-born population - Germany (%)
Place of birth for the foreign-born population - Netherlands (%)
Place of birth for the foreign-born population - Switzerland (%)
Place of birth for the foreign-born population - Other Western Europe (%)
Place of birth for the foreign-born population - Greece (%)
Place of birth for the foreign-born population - Italy (%)
Place of birth for the foreign-born population - Portugal (%)
Place of birth for the foreign-born population - Spain (%)
Place of birth for the foreign-born population - Other Southern Europe (%)
Place of birth for the foreign-born population - Albania (%)
Place of birth for the foreign-born population - Belarus (%)
Place of birth for the foreign-born population - Bosnia and Herzegovina (%)
Place of birth for the foreign-born population - Bulgaria (%)
Place of birth for the foreign-born population - Croatia (%)
Place of birth for the foreign-born population - Czechoslovakia (%)
Place of birth for the foreign-born population - Hungary (%)
Place of birth for the foreign-born population - Latvia (%)
Place of birth for the foreign-born population - Lithuania (%)
Place of birth for the foreign-born population - North Macedonia (Macedonia) (%)
Place of birth for the foreign-born population - Moldova (%)
Place of birth for the foreign-born population - Poland (%)
Place of birth for the foreign-born population - Romania (%)
Place of birth for the foreign-born population - Russia (%)
Place of birth for the foreign-born population - Serbia (%)
Place of birth for the foreign-born population - Ukraine (%)
Place of birth for the foreign-born population - Other Eastern Europe (%)
Place of birth for the foreign-born population - China (%)
Place of birth for the foreign-born population - Hong Kong (%)
Place of birth for the foreign-born population - Taiwan (%)
Place of birth for the foreign-born population - Japan (%)
Place of birth for the foreign-born population - Korea (%)
Place of birth for the foreign-born population - Other Eastern Asia (%)
Place of birth for the foreign-born population - Afghanistan (%)
Place of birth for the foreign-born population - Bangladesh (%)
Place of birth for the foreign-born population - India (%)
Place of birth for the foreign-born population - Iran (%)
Place of birth for the foreign-born population - Kazakhstan (%)
Place of birth for the foreign-born population - Nepal (%)
Place of birth for the foreign-born population - Pakistan (%)
Place of birth for the foreign-born population - Sri Lanka (%)
Place of birth for the foreign-born population - Uzbekistan (%)
Place of birth for the foreign-born population - Other South Central Asia (%)
Place of birth for the foreign-born population - Burma (%)
Place of birth for the foreign-born population - Cambodia (%)
Place of birth for the foreign-born population - Indonesia (%)
Place of birth for the foreign-born population - Laos (%)
Place of birth for the foreign-born population - Malaysia (%)
Place of birth for the foreign-born population - Philippines (%)
Place of birth for the foreign-born population - Singapore (%)
Place of birth for the foreign-born population - Thailand (%)
Place of birth for the foreign-born population - Vietnam (%)
Place of birth for the foreign-born population - Other South Eastern Asia (%)
Place of birth for the foreign-born population - Armenia (%)
Place of birth for the foreign-born population - Iraq (%)
Place of birth for the foreign-born population - Israel (%)
Place of birth for the foreign-born population - Jordan (%)
Place of birth for the foreign-born population - Kuwait (%)
Place of birth for the foreign-born population - Lebanon (%)
Place of birth for the foreign-born population - Saudi Arabia (%)
Place of birth for the foreign-born population - Syria (%)
Place of birth for the foreign-born population - Turkey (%)
Place of birth for the foreign-born population - Yemen (%)
Place of birth for the foreign-born population - Other Western Asia (%)
Place of birth for the foreign-born population - Eritrea (%)
Place of birth for the foreign-born population - Ethiopia (%)
Place of birth for the foreign-born population - Kenya (%)
Place of birth for the foreign-born population - Somalia (%)
Place of birth for the foreign-born population - Uganda (%)
Place of birth for the foreign-born population - Zimbabwe (%)
Place of birth for the foreign-born population - Other Eastern Africa (%)
Place of birth for the foreign-born population - Cameroon (%)
Place of birth for the foreign-born population - Congo (%)
Place of birth for the foreign-born population - Democratic Republic of Congo (Zaire) (%)
Place of birth for the foreign-born population - Other Middle Africa (%)
Place of birth for the foreign-born population - Egypt (%)
Place of birth for the foreign-born population - Morocco (%)
Place of birth for the foreign-born population - Sudan (%)
Place of birth for the foreign-born population - Other Northern Africa (%)
Place of birth for the foreign-born population - South Africa (%)
Place of birth for the foreign-born population - Other Southern Africa (%)
Place of birth for the foreign-born population - Cabo Verde (%)
Place of birth for the foreign-born population - Ghana (%)
Place of birth for the foreign-born population - Liberia (%)
Place of birth for the foreign-born population - Nigeria (%)
Place of birth for the foreign-born population - Senegal (%)
Place of birth for the foreign-born population - Sierra Leone (%)
Place of birth for the foreign-born population - Other Western Africa (%)
Place of birth for the foreign-born population - Australia (%)
Place of birth for the foreign-born population - New Zealand (%)
Place of birth for the foreign-born population - Fiji (%)
Place of birth for the foreign-born population - Micronesia (%)
Place of birth for the foreign-born population - Bahamas (%)
Place of birth for the foreign-born population - Barbados (%)
Place of birth for the foreign-born population - Cuba (%)
Place of birth for the foreign-born population - Dominica (%)
Place of birth for the foreign-born population - Dominican Republic (%)
Place of birth for the foreign-born population - Grenada (%)
Place of birth for the foreign-born population - Haiti (%)
Place of birth for the foreign-born population - Jamaica (%)
Place of birth for the foreign-born population - St. Vincent and the Grenadines (%)
Place of birth for the foreign-born population - Trinidad and Tobago (%)
Place of birth for the foreign-born population - West Indies (%)
Place of birth for the foreign-born population - Other Caribbean (%)
Place of birth for the foreign-born population - Belize (%)
Place of birth for the foreign-born population - Costa Rica (%)
Place of birth for the foreign-born population - El Salvador (%)
Place of birth for the foreign-born population - Guatemala (%)
Place of birth for the foreign-born population - Honduras (%)
Place of birth for the foreign-born population - Mexico (%)
Place of birth for the foreign-born population - Nicaragua (%)
Place of birth for the foreign-born population - Panama (%)
Place of birth for the foreign-born population - Other Central America (%)
Place of birth for the foreign-born population - Argentina (%)
Place of birth for the foreign-born population - Bolivia (%)
Place of birth for the foreign-born population - Brazil (%)
Place of birth for the foreign-born population - Chile (%)
Place of birth for the foreign-born population - Colombia (%)
Place of birth for the foreign-born population - Ecuador (%)
Place of birth for the foreign-born population - Guyana (%)
Place of birth for the foreign-born population - Peru (%)
Place of birth for the foreign-born population - Uruguay (%)
Place of birth for the foreign-born population - Venezuela (%)
Place of birth for the foreign-born population - Other South America (%)
Place of birth for the foreign-born population - Canada (%)
Place of birth for the foreign-born population - Other Northern America (%)
Place of birth for the foreign-born population - Other (%)
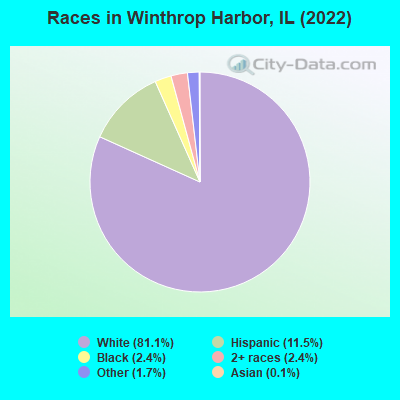
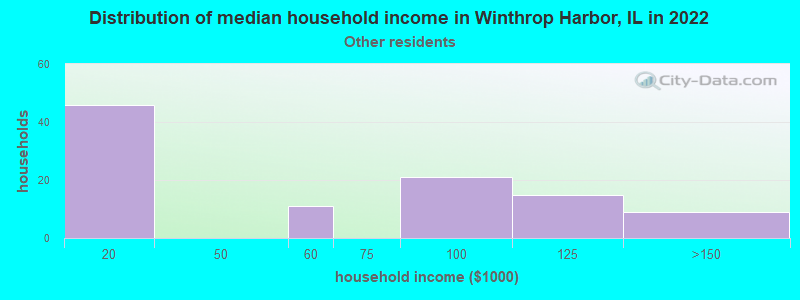
According to 2022 data, the most numerous races in Winthrop Harbor, IL are White alone (5,395 residents), Hispanic (764 residents), and Black alone (159 residents). 90.5% of Winthrop Harbor residents speak English at home. 5.8% of Winthrop Harbor, IL residents are foreign-born (2.2% born in Europe, 1.7% born in Latin America, 1.5% born in Africa), which is 141.4% less than the foreign-born rate of 14.0% across the entire state of Illinois.
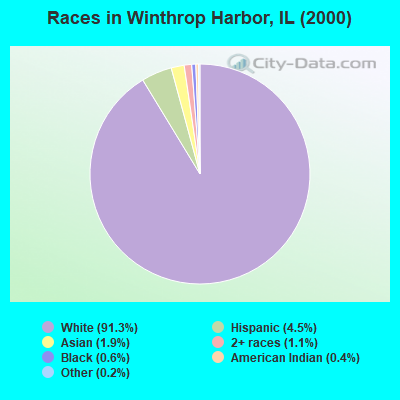
Race distribution in Winthrop Harbor
2000 2022
8,424,140 67.8% White alone 1,856,152 14.9% Black alone 1,530,262 12.3% Hispanic 419,916 3.4% Asian alone 153,996 1.2% Two or more races 13,479 0.1% Other race alone 18,232 0.1% American Indian alone 3,116 0.03% Native Hawaiian and Other
7,356,301 58.5% White alone 2,299,726 18.3% Hispanic 1,660,423 13.2% Black alone 747,296 5.9% Asian alone 458,599 3.6% Two or more races 45,386 0.4% Other race alone 10,405 0.08% American Indian alone 3,896 0.03% Native Hawaiian and Other
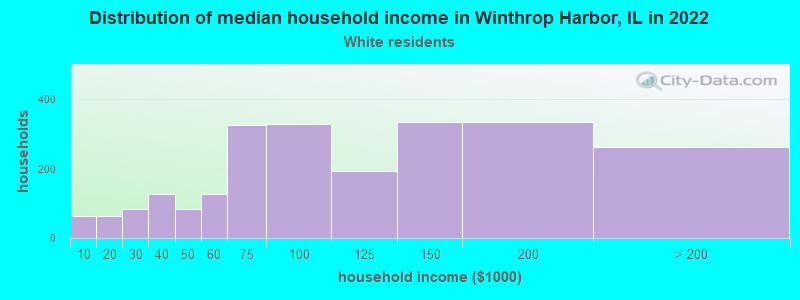
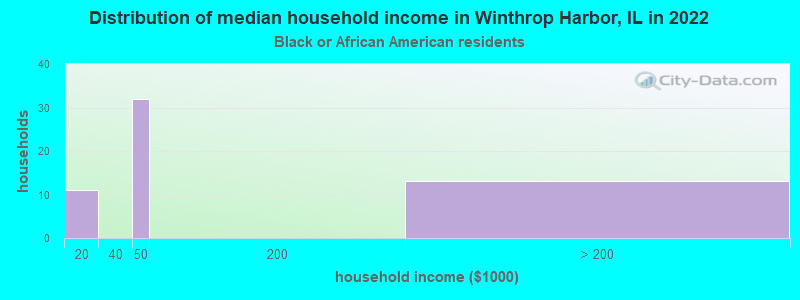
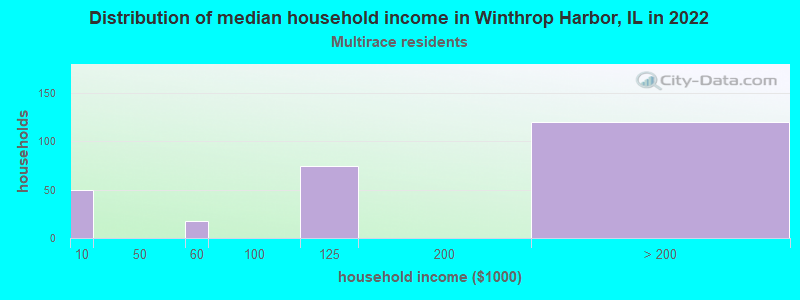
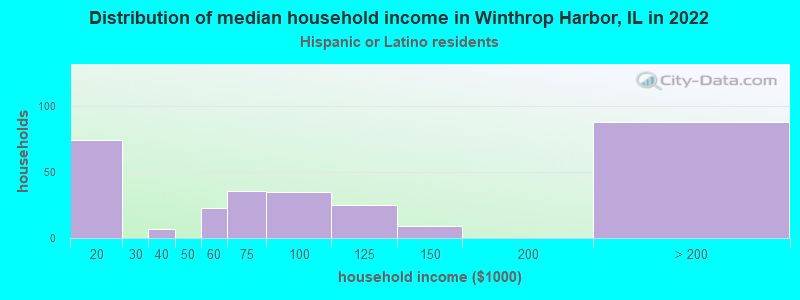
Income and house value in Winthrop Harbor Median household income in 2022 $94,379 White non-Hispanic householders$77,280 Hispanic or Latino race householdersMedian 2022 house value $240,681 White Non-Hispanic householders$374,505 Black or African American householders$187,252 American Indian or Alaska Native householders $665,786 Asian householders$193,577 Some other race householders$168,776 Two or more races householders$239,683 Hispanic or Latino householders
Median age by race in Winthrop Harbor
53.9 Median age for White residents51.2 57.4 55.5 Median age for Black or African American residents60.4 25.5 37.8 Median age for American Indian / Alaska Native residents49.9 17.0 -677,083,332.7 Median age for Asian residents-680,776,013.4 -678,663,238.4 -593,236,714.4 Median age for Native Hawaiian / Pacific Islander residents-658,536,584.7 -576,015,108.0 47.3 Median age for Other race residents47.2 36.9 29.1 Median age for Two or more races residents14.7 48.4 55.2 Median age for White alone residents51.8 57.0 31.8 Median age for Hispanic or Latino residents22.2 39.5
Owner/renter occupied households by race in Winthrop Harbor
House owners and renters - White residents 2,077 89.9% Owner occupied233 10.1% Renter occupiedHouse owners and renters - Black or African American residents 14 27.0% Owner occupied37 73.0% Renter occupiedHouse owners and renters - American Indian / Alaska Native residents 20 100.0% Owner occupiedHouse owners and renters - Other race residents 70 62.3% Owner occupied42 37.7% Renter occupiedHouse owners and renters - Two or more races residents 215 80.9% Owner occupied51 19.1% Renter occupiedHouse owners and renters - White alone residents 2,078 89.8% Owner occupied235 10.2% Renter occupiedHouse owners and renters - Hispanic or Latino residents 219 79.1% Owner occupied58 20.9% Renter occupied
Language usage in Winthrop Harbor
English speakers - Total 90.5% of residents of Winthrop Harbor speak English at home.
5.2% of residents speak Spanish at home 268 78.6% Speak English very well73 21.4% Speak English less than very well3.2% of residents speak other language at home 160 76.6% Speak English very well49 23.4% Speak English less than very well
English speakers - Born in the United States 97.2% of residents of Winthrop Harbor speak English at home.
1.7% of residents speak Spanish at home 28 100.0% Speak English very well0.8% of residents speak other language at home 13 100.0% Speak English less than very well
English speakers - Native, born elsewhere 11.3% of residents of Winthrop Harbor speak English at home.
92.5% of residents speak Spanish at home 49 100.0% Speak English very well
English speakers - Foreign-born 48.4% of residents of Winthrop Harbor speak English at home.
24.6% of residents speak Spanish at home 50 50.5% Speak English very well49 49.5% Speak English less than very well28.0% of residents speak other language at home 77 68.1% Speak English very well36 31.9% Speak English less than very well
White (Caucasian) - Speak only English Native:
100.0% (5,062)Foreign-born:
70.7% (161)
White (Caucasian) - Speak another language Native:
1.8% (90)Foreign-born:
44.3% (101)
American Indian / Alaska Native - Speak another language Native:
81.6% (119)Foreign-born:
100.0% (22)
Other race - Speak another language Native:
43.8% (93)Foreign-born:
94.8% (55)
Two or more races - Speak only English Native:
79.0% (260)Foreign-born:
86.2% (21)
White alone - Speak only English Native:
98.6% (4,954)Foreign-born:
60.3% (165)
White alone - Speak another language Native:
1.6% (81)Foreign-born:
41.5% (113)
Hispanic or Latino - Speak only English Native:
67.2% (397)Foreign-born:
18.0% (22)
Hispanic or Latino - Speak another language Native:
35.1% (208)Foreign-born:
85.5% (104)
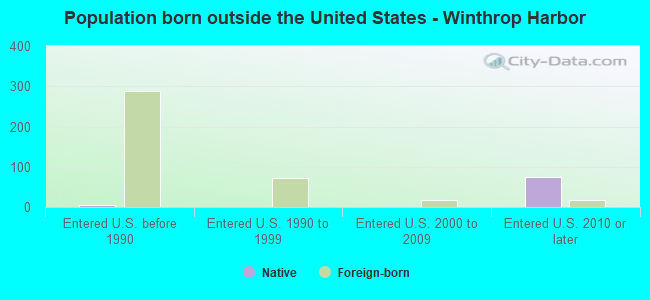
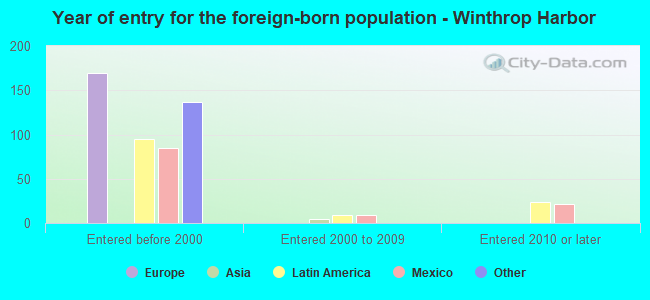
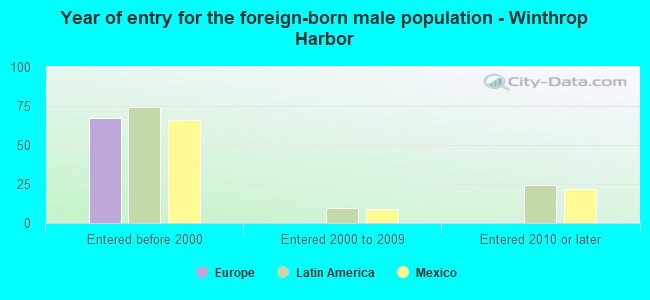
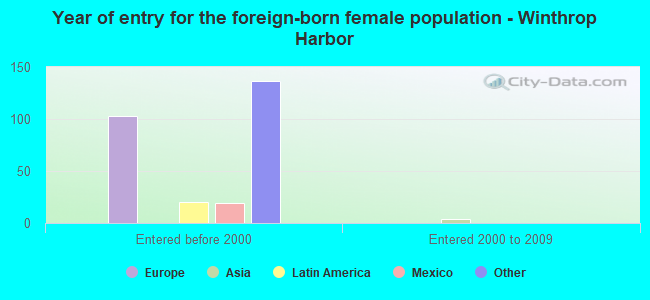
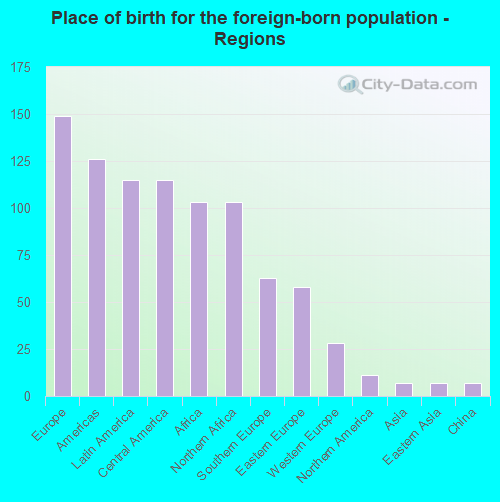
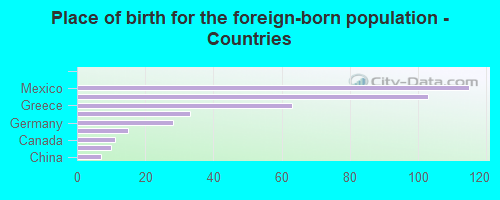
Foreign-born residents in Winthrop Harbor 386 residents are foreign born (2.2% Europe , 1.7% Latin America , 1.5% Africa ).
This city:
5.8%Illinois:
14.1%
Marital status for residents in Winthrop Harbor Marital status - White (Caucasian) population 15 years and over
Males 26.7% Never married63.3% Now married1.0% Separated2.3% Widowed6.8% DivorcedFemales 20.0% Never married59.6% Now married0.4% Separated8.6% Widowed11.4% DivorcedWomen who gave birth in the past 12 months Now married:
63.0% (30)Unmarried:
37.0% (18)
Women who did not give birth in the past 12 months Now married:
50.0% (433)Unmarried:
50.0% (433)
Marital status - Black or African American population 15 years and over
Males 0.0% Never married48.3% Now married23.3% Separated0.0% Widowed28.3% DivorcedFemales 55.3% Never married17.0% Now married27.7% Separated0.0% Widowed0.0% DivorcedWomen who did not give birth in the past 12 months Now married:
38.8% (24)Unmarried:
61.2% (37)
Marital status - American Indian / Alaska Native population 15 years and over
Males 0.0% Never married48.1% Now married0.0% Separated51.9% Widowed0.0% DivorcedFemales 55.2% Never married22.4% Now married0.0% Separated0.0% Widowed22.4% DivorcedWomen who did not give birth in the past 12 months Now married:
28.9% (22)Unmarried:
71.1% (53)
Marital status - Other race population 15 years and over
Males 11.0% Never married48.6% Now married0.0% Separated0.0% Widowed40.4% DivorcedFemales 0.0% Never married100.0% Now married0.0% Separated0.0% Widowed0.0% DivorcedWomen who did not give birth in the past 12 months Now married:
100.0% (29)Unmarried:
0.0% (0)
Marital status - Two or more races population 15 years and over
Males 76.3% Never married23.7% Now married0.0% Separated0.0% Widowed0.0% DivorcedFemales 38.9% Never married55.8% Now married0.0% Separated0.0% Widowed5.3% DivorcedWomen who did not give birth in the past 12 months Now married:
63.0% (92)Unmarried:
37.0% (54)
Marital status - White alone, not Hispanic / Latino population 15 years and over
Males 24.1% Never married65.2% Now married1.1% Separated2.4% Widowed7.2% DivorcedFemales 19.7% Never married60.0% Now married0.4% Separated8.9% Widowed11.0% DivorcedWomen who gave birth in the past 12 months Now married:
63.0% (32)Unmarried:
37.0% (19)
Women who did not give birth in the past 12 months Now married:
50.2% (432)Unmarried:
49.8% (429)
Marital status - Hispanic or Latino population 15 years and over
Males 40.6% Never married39.6% Now married0.0% Separated4.8% Widowed15.0% DivorcedFemales 24.3% Never married61.3% Now married0.0% Separated0.0% Widowed14.3% DivorcedWomen who did not give birth in the past 12 months Now married:
67.3% (140)Unmarried:
32.7% (68)
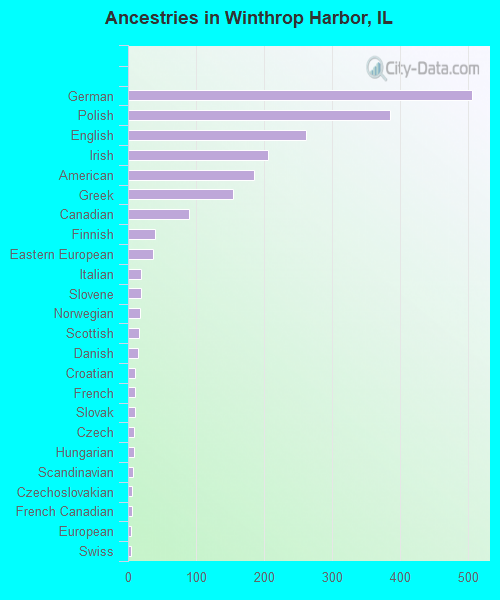
Ancestries in Winthrop Harbor
505 18.7% German385 14.2% Polish262 9.7% English205 7.6% Irish185 6.8% American154 5.7% Greek89 3.3% Canadian39 1.4% Finnish36 1.3% Eastern European19 0.7% Italian19 0.7% Slovene18 0.7% Norwegian16 0.6% Scottish15 0.6% Danish11 0.4% Croatian11 0.4% French10 0.4% Slovak9 0.3% Czech9 0.3% Hungarian7 0.3% Scandinavian6 0.2% Czechoslovakian6 0.2% French Canadian5 0.2% European5 0.2% Swiss4 0.1% British
Children Nativity (place of birth) in Winthrop Harbor
Children under 6 years - Living with two parents Both parents native 161 100.0% NativeChildren under 6 years - Living with one parent Native parent 50 100.0% NativeForeign-born parent 26 100.0% NativeChildren 6 to 17 years - Living with two parents Both parents native 400 97.6% Native10 2.4% Foreign-bornBoth parents foreign-born 10 100.0% NativeOne native, one foreign-born parent 73 100.0% NativeChildren 6 to 17 years - Living with one parent Native parent 102 100.0% NativeForeign-born parent 13 51.8% Native13 48.2% Foreign-born
Grandparents responsible for own grandchildren in Winthrop Harbor
Grandparents (30 to 59 years) White / Caucasian 106 100.0% Not responsible for grandchildrenBlack or African American 13 100.0% Not responsible for grandchildrenWhite alone, not Hispanic / Latino 111 100.0% Not responsible for grandchildrenGrandparents (60 years and over) White / Caucasian 59 49.7% Responsible for grandchildren59 50.3% Not responsible for grandchildrenWhite alone, not Hispanic / Latino 71 46.0% Responsible for grandchildren83 54.0% Not responsible for grandchildren