Races in White Center, Washington (WA) Detailed Stats
Data:
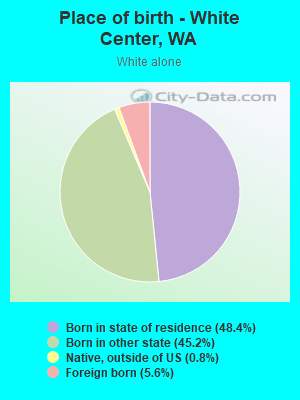
Races - White alone (%)
Races - White alone (% change since 2000)
Races - Black alone (%)
Races - Black alone (% change since 2000)
Races - American Indian alone (%)
Races - American Indian alone (% change since 2000)
Races - Asian alone (%)
Races - Asian alone (% change since 2000)
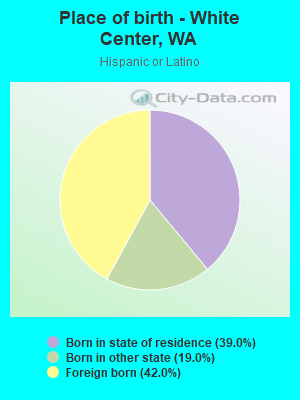
Races - Hispanic (%)
Races - Hispanic (% change since 2000)
Races - Native Hawaiian and Other Pacific Islander alone (%)
Races - Native Hawaiian and Other Pacific Islander alone (% change since 2000)
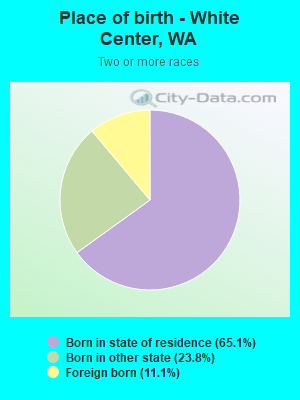
Races - Two or more races(%)
Races - Two or more races(% change since 2000)
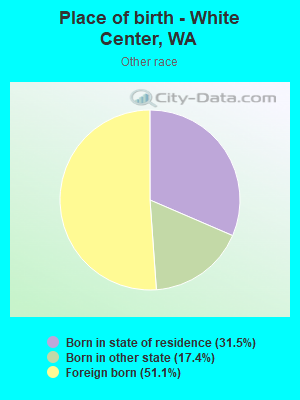
Races - Other race alone (%)
Races - Other race alone (% change since 2000)
Racial diversity
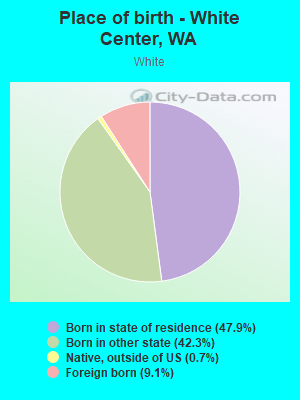
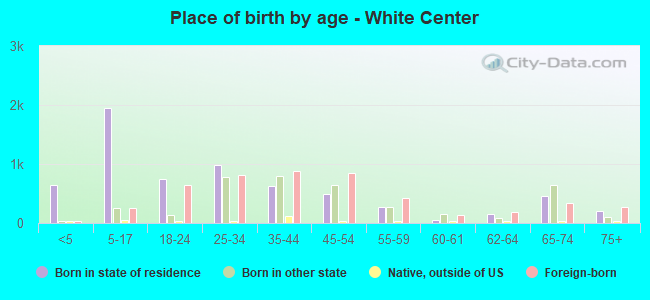
Place of birth - Born in state of residence (%)
Place of birth - Born in state of residence (%) - White
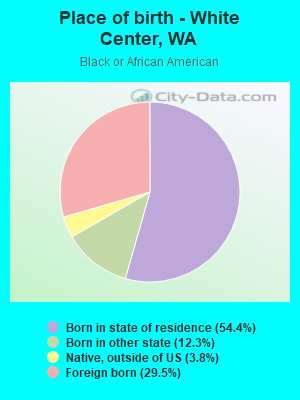
Place of birth - Born in state of residence (%) - Black or African American
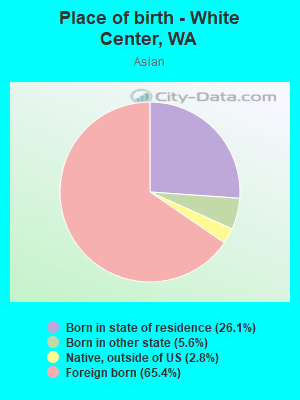
Place of birth - Born in state of residence (%) - Asian
Place of birth - Born in state of residence (%) - Hispanic or Latino
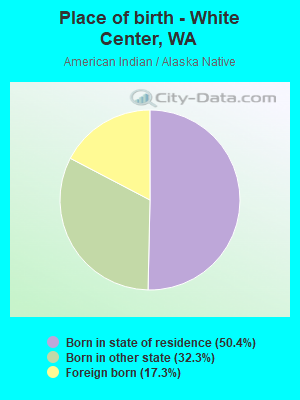
Place of birth - Born in state of residence (%) - American Indian and Alaska Native
Place of birth - Born in state of residence (%) - Multirace
Place of birth - Born in state of residence (%) - Other Race
Place of birth - Born in other state (%)
Place of birth - Born in other state (%) - White
Place of birth - Born in other state (%) - Black or African American
Place of birth - Born in other state (%) - Asian
Place of birth - Born in other state (%) - Hispanic or Latino
Place of birth - Born in other state (%) - American Indian and Alaska Native
Place of birth - Born in other state (%) - Multirace
Place of birth - Born in other state (%) - Other Race
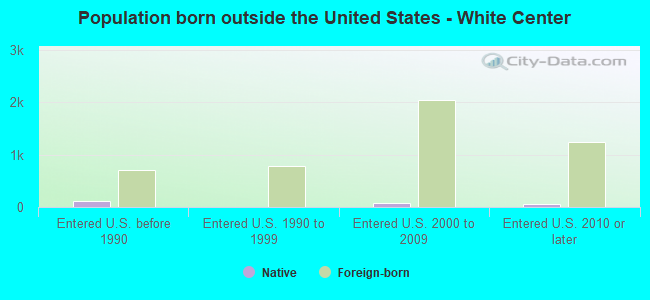
Place of birth - Native, outside of US (%)
Place of birth - Native, outside of US (%) - White
Place of birth - Native, outside of US (%) - Black or African American
Place of birth - Native, outside of US (%) - Asian
Place of birth - Native, outside of US (%) - Hispanic or Latino
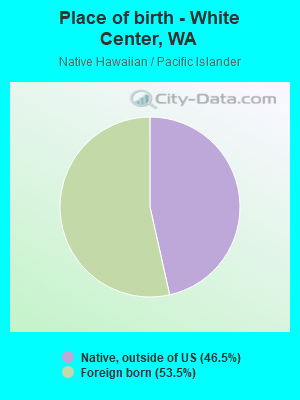
Place of birth - Native, outside of US (%) - American Indian and Alaska Native
Place of birth - Native, outside of US (%) - Multirace
Place of birth - Native, outside of US (%) - Other Race
Place of birth - Foreign born (%)
Place of birth - Foreign born (%) - White
Place of birth - Foreign born (%) - Black or African American
Place of birth - Foreign born (%) - Asian
Place of birth - Foreign born (%) - Hispanic or Latino
Place of birth - Foreign born (%) - American Indian and Alaska Native
Place of birth - Foreign born (%) - Multirace
Place of birth - Foreign born (%) - Other Race
Residents speaking English at home (%)
Residents speaking English at home - Born in the United States (%)
Residents speaking English at home - Native, born elsewhere (%)
Residents speaking English at home - Foreign born (%)
Residents speaking Spanish at home (%)
Residents speaking Spanish at home - Born in the United States (%)
Residents speaking Spanish at home - Native, born elsewhere (%)
Residents speaking Spanish at home - Foreign born (%)
Residents speaking other language at home (%)
Residents speaking other language at home - Born in the United States (%)
Residents speaking other language at home - Native, born elsewhere (%)
Residents speaking other language at home - Foreign born (%)
Marital status - Never married (%)
Marital status - Now married (%)
Marital status - Separated (%)
Marital status - Widowed (%)
Marital status - Divorced (%)
Ancestries Reported - Arab (%)
Ancestries Reported - Czech (%)
Ancestries Reported - Danish (%)
Ancestries Reported - Dutch (%)
Ancestries Reported - English (%)
Ancestries Reported - French (%)
Ancestries Reported - French Canadian (%)
Ancestries Reported - German (%)
Ancestries Reported - Greek (%)
Ancestries Reported - Hungarian (%)
Ancestries Reported - Irish (%)
Ancestries Reported - Italian (%)
Ancestries Reported - Lithuanian (%)
Ancestries Reported - Norwegian (%)
Ancestries Reported - Polish (%)
Ancestries Reported - Portuguese (%)
Ancestries Reported - Russian (%)
Ancestries Reported - Scotch-Irish (%)
Ancestries Reported - Scottish (%)
Ancestries Reported - Slovak (%)
Ancestries Reported - Subsaharan African (%)
Ancestries Reported - Swedish (%)
Ancestries Reported - Swiss (%)
Ancestries Reported - Ukrainian (%)
Ancestries Reported - United States (%)
Ancestries Reported - Welsh (%)
Ancestries Reported - West Indian (%)
Ancestries Reported - Other (%)
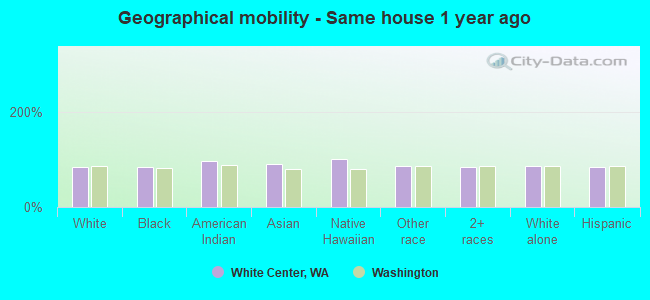
Geographical mobility - Same house 1 year ago (%)
Geographical mobility - Same house 1 year ago (%) - White
Geographical mobility - Same house 1 year ago (%) - Black or African American
Geographical mobility - Same house 1 year ago (%) - Asian
Geographical mobility - Same house 1 year ago (%) - Hispanic or Latino
Geographical mobility - Same house 1 year ago (%) - American Indian and Alaska Native
Geographical mobility - Same house 1 year ago (%) - Multirace
Geographical mobility - Same house 1 year ago (%) - Other Race
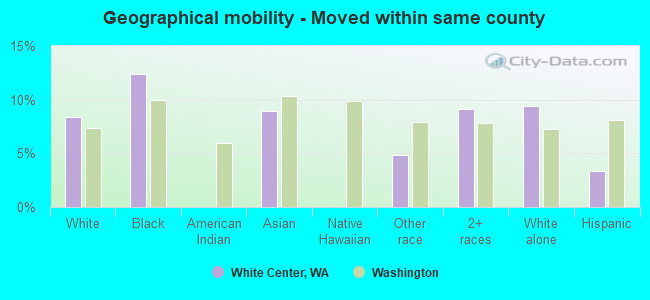
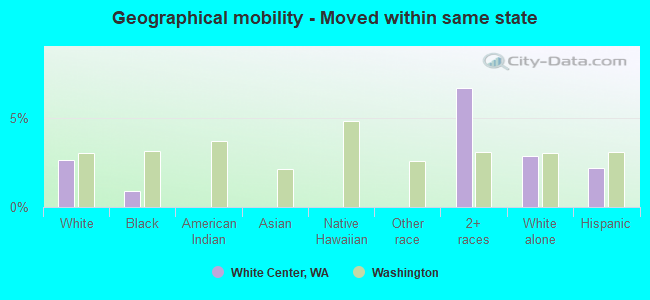
Geographical mobility - Moved within same county (%)
Geographical mobility - Moved within same county (%) - White
Geographical mobility - Moved within same county (%) - Black or African American
Geographical mobility - Moved within same county (%) - Asian
Geographical mobility - Moved within same county (%) - Hispanic or Latino
Geographical mobility - Moved within same county (%) - American Indian and Alaska Native
Geographical mobility - Moved within same county (%) - Multirace
Geographical mobility - Moved within same county (%) - Other Race
Geographical mobility - Moved from different county within same state (%)
Geographical mobility - Moved from different county within same state (%) - White
Geographical mobility - Moved from different county within same state (%) - Black or African American
Geographical mobility - Moved from different county within same state (%) - Asian
Geographical mobility - Moved from different county within same state (%) - Hispanic or Latino
Geographical mobility - Moved from different county within same state (%) - American Indian and Alaska Native
Geographical mobility - Moved from different county within same state (%) - Multirace
Geographical mobility - Moved from different county within same state (%) - Other Race
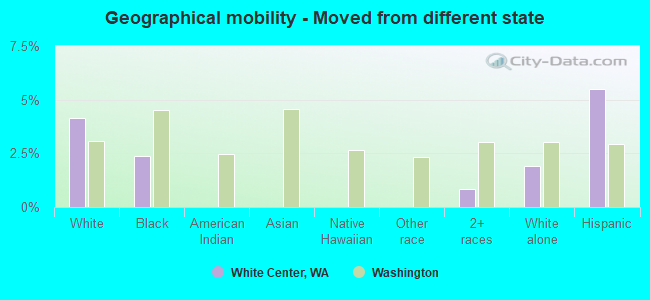
Geographical mobility - Moved from different state (%)
Geographical mobility - Moved from different state (%) - White
Geographical mobility - Moved from different state (%) - Black or African American
Geographical mobility - Moved from different state (%) - Asian
Geographical mobility - Moved from different state (%) - Hispanic or Latino
Geographical mobility - Moved from different state (%) - American Indian and Alaska Native
Geographical mobility - Moved from different state (%) - Multirace
Geographical mobility - Moved from different state (%) - Other Race
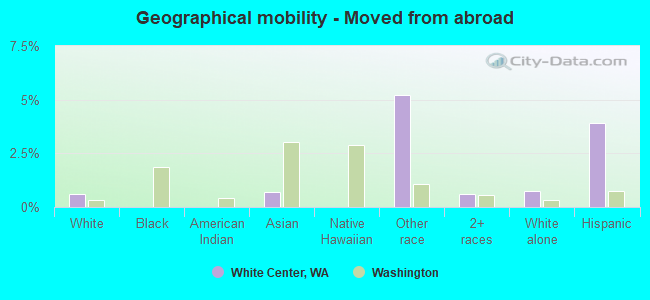
Geographical mobility - Moved from abroad (%)
Geographical mobility - Moved from abroad (%) - White
Geographical mobility - Moved from abroad (%) - Black or African American
Geographical mobility - Moved from abroad (%) - Asian
Geographical mobility - Moved from abroad (%) - Hispanic or Latino
Geographical mobility - Moved from abroad (%) - American Indian and Alaska Native
Geographical mobility - Moved from abroad (%) - Multirace
Geographical mobility - Moved from abroad (%) - Other Race
Place of birth for the foreign-born population - Ireland (%)
Place of birth for the foreign-born population - Denmark (%)
Place of birth for the foreign-born population - Norway (%)
Place of birth for the foreign-born population - Sweden (%)
Place of birth for the foreign-born population - United Kingdom (%)
Place of birth for the foreign-born population - England (%)
Place of birth for the foreign-born population - Scotland (%)
Place of birth for the foreign-born population - Other Northern Europe (%)
Place of birth for the foreign-born population - Austria (%)
Place of birth for the foreign-born population - Belgium (%)
Place of birth for the foreign-born population - France (%)
Place of birth for the foreign-born population - Germany (%)
Place of birth for the foreign-born population - Netherlands (%)
Place of birth for the foreign-born population - Switzerland (%)
Place of birth for the foreign-born population - Other Western Europe (%)
Place of birth for the foreign-born population - Greece (%)
Place of birth for the foreign-born population - Italy (%)
Place of birth for the foreign-born population - Portugal (%)
Place of birth for the foreign-born population - Spain (%)
Place of birth for the foreign-born population - Other Southern Europe (%)
Place of birth for the foreign-born population - Albania (%)
Place of birth for the foreign-born population - Belarus (%)
Place of birth for the foreign-born population - Bosnia and Herzegovina (%)
Place of birth for the foreign-born population - Bulgaria (%)
Place of birth for the foreign-born population - Croatia (%)
Place of birth for the foreign-born population - Czechoslovakia (%)
Place of birth for the foreign-born population - Hungary (%)
Place of birth for the foreign-born population - Latvia (%)
Place of birth for the foreign-born population - Lithuania (%)
Place of birth for the foreign-born population - North Macedonia (Macedonia) (%)
Place of birth for the foreign-born population - Moldova (%)
Place of birth for the foreign-born population - Poland (%)
Place of birth for the foreign-born population - Romania (%)
Place of birth for the foreign-born population - Russia (%)
Place of birth for the foreign-born population - Serbia (%)
Place of birth for the foreign-born population - Ukraine (%)
Place of birth for the foreign-born population - Other Eastern Europe (%)
Place of birth for the foreign-born population - China (%)
Place of birth for the foreign-born population - Hong Kong (%)
Place of birth for the foreign-born population - Taiwan (%)
Place of birth for the foreign-born population - Japan (%)
Place of birth for the foreign-born population - Korea (%)
Place of birth for the foreign-born population - Other Eastern Asia (%)
Place of birth for the foreign-born population - Afghanistan (%)
Place of birth for the foreign-born population - Bangladesh (%)
Place of birth for the foreign-born population - India (%)
Place of birth for the foreign-born population - Iran (%)
Place of birth for the foreign-born population - Kazakhstan (%)
Place of birth for the foreign-born population - Nepal (%)
Place of birth for the foreign-born population - Pakistan (%)
Place of birth for the foreign-born population - Sri Lanka (%)
Place of birth for the foreign-born population - Uzbekistan (%)
Place of birth for the foreign-born population - Other South Central Asia (%)
Place of birth for the foreign-born population - Burma (%)
Place of birth for the foreign-born population - Cambodia (%)
Place of birth for the foreign-born population - Indonesia (%)
Place of birth for the foreign-born population - Laos (%)
Place of birth for the foreign-born population - Malaysia (%)
Place of birth for the foreign-born population - Philippines (%)
Place of birth for the foreign-born population - Singapore (%)
Place of birth for the foreign-born population - Thailand (%)
Place of birth for the foreign-born population - Vietnam (%)
Place of birth for the foreign-born population - Other South Eastern Asia (%)
Place of birth for the foreign-born population - Armenia (%)
Place of birth for the foreign-born population - Iraq (%)
Place of birth for the foreign-born population - Israel (%)
Place of birth for the foreign-born population - Jordan (%)
Place of birth for the foreign-born population - Kuwait (%)
Place of birth for the foreign-born population - Lebanon (%)
Place of birth for the foreign-born population - Saudi Arabia (%)
Place of birth for the foreign-born population - Syria (%)
Place of birth for the foreign-born population - Turkey (%)
Place of birth for the foreign-born population - Yemen (%)
Place of birth for the foreign-born population - Other Western Asia (%)
Place of birth for the foreign-born population - Eritrea (%)
Place of birth for the foreign-born population - Ethiopia (%)
Place of birth for the foreign-born population - Kenya (%)
Place of birth for the foreign-born population - Somalia (%)
Place of birth for the foreign-born population - Uganda (%)
Place of birth for the foreign-born population - Zimbabwe (%)
Place of birth for the foreign-born population - Other Eastern Africa (%)
Place of birth for the foreign-born population - Cameroon (%)
Place of birth for the foreign-born population - Congo (%)
Place of birth for the foreign-born population - Democratic Republic of Congo (Zaire) (%)
Place of birth for the foreign-born population - Other Middle Africa (%)
Place of birth for the foreign-born population - Egypt (%)
Place of birth for the foreign-born population - Morocco (%)
Place of birth for the foreign-born population - Sudan (%)
Place of birth for the foreign-born population - Other Northern Africa (%)
Place of birth for the foreign-born population - South Africa (%)
Place of birth for the foreign-born population - Other Southern Africa (%)
Place of birth for the foreign-born population - Cabo Verde (%)
Place of birth for the foreign-born population - Ghana (%)
Place of birth for the foreign-born population - Liberia (%)
Place of birth for the foreign-born population - Nigeria (%)
Place of birth for the foreign-born population - Senegal (%)
Place of birth for the foreign-born population - Sierra Leone (%)
Place of birth for the foreign-born population - Other Western Africa (%)
Place of birth for the foreign-born population - Australia (%)
Place of birth for the foreign-born population - New Zealand (%)
Place of birth for the foreign-born population - Fiji (%)
Place of birth for the foreign-born population - Micronesia (%)
Place of birth for the foreign-born population - Bahamas (%)
Place of birth for the foreign-born population - Barbados (%)
Place of birth for the foreign-born population - Cuba (%)
Place of birth for the foreign-born population - Dominica (%)
Place of birth for the foreign-born population - Dominican Republic (%)
Place of birth for the foreign-born population - Grenada (%)
Place of birth for the foreign-born population - Haiti (%)
Place of birth for the foreign-born population - Jamaica (%)
Place of birth for the foreign-born population - St. Vincent and the Grenadines (%)
Place of birth for the foreign-born population - Trinidad and Tobago (%)
Place of birth for the foreign-born population - West Indies (%)
Place of birth for the foreign-born population - Other Caribbean (%)
Place of birth for the foreign-born population - Belize (%)
Place of birth for the foreign-born population - Costa Rica (%)
Place of birth for the foreign-born population - El Salvador (%)
Place of birth for the foreign-born population - Guatemala (%)
Place of birth for the foreign-born population - Honduras (%)
Place of birth for the foreign-born population - Mexico (%)
Place of birth for the foreign-born population - Nicaragua (%)
Place of birth for the foreign-born population - Panama (%)
Place of birth for the foreign-born population - Other Central America (%)
Place of birth for the foreign-born population - Argentina (%)
Place of birth for the foreign-born population - Bolivia (%)
Place of birth for the foreign-born population - Brazil (%)
Place of birth for the foreign-born population - Chile (%)
Place of birth for the foreign-born population - Colombia (%)
Place of birth for the foreign-born population - Ecuador (%)
Place of birth for the foreign-born population - Guyana (%)
Place of birth for the foreign-born population - Peru (%)
Place of birth for the foreign-born population - Uruguay (%)
Place of birth for the foreign-born population - Venezuela (%)
Place of birth for the foreign-born population - Other South America (%)
Place of birth for the foreign-born population - Canada (%)
Place of birth for the foreign-born population - Other Northern America (%)
Place of birth for the foreign-born population - Other (%)
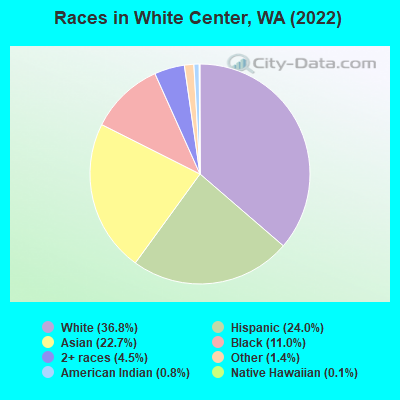
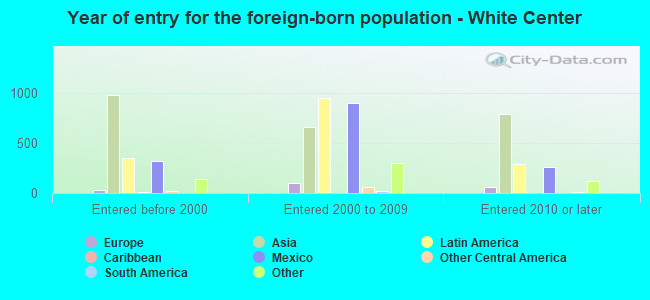
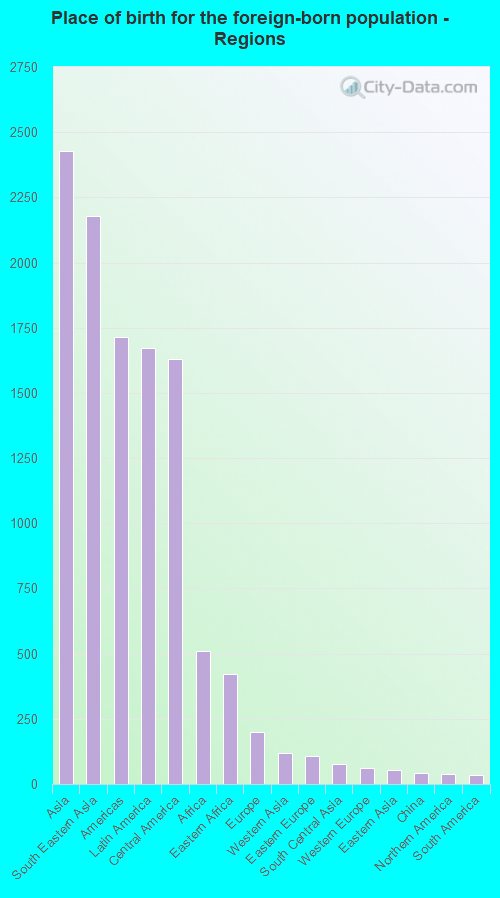
According to 2022 data, the most numerous races in White Center, WA are White alone (5,724 residents), Hispanic (3,743 residents), and Asian alone (3,540 residents). 58.0% of White Center residents speak English at home. 31.3% of White Center, WA residents are foreign-born (14.9% born in Asia, 10.3% born in Latin America, 3.1% born in Africa), which is 52.0% greater than the foreign-born rate of 15.0% across the entire state of Washington.
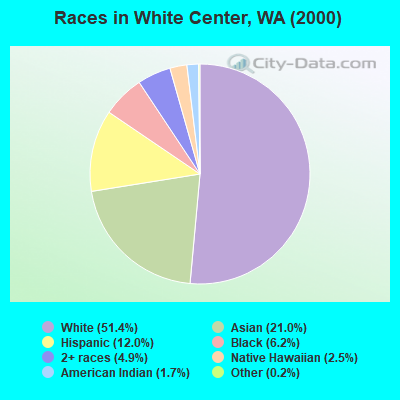
Race distribution in White Center
2000 2022
4,652,490 78.9% White alone 441,509 7.5% Hispanic 319,401 5.4% Asian alone 184,631 3.1% Black alone 175,926 3.0% Two or more races 85,396 1.4% American Indian alone 22,779 0.4% Native Hawaiian and Other 11,989 0.2% Other race alone
4,941,456 63.5% White alone 1,093,313 14.0% Hispanic 755,832 9.7% Asian alone 523,448 6.7% Two or more races 299,537 3.8% Black alone 69,024 0.9% American Indian alone 52,231 0.7% Native Hawaiian and Other 50,945 0.7% Other race alone
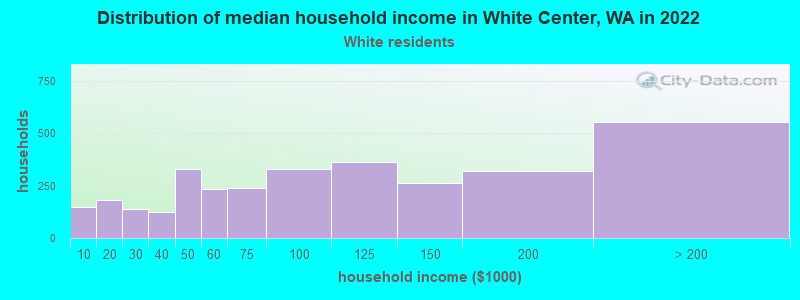
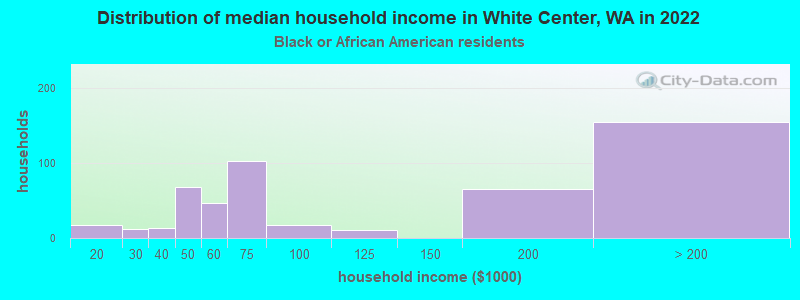
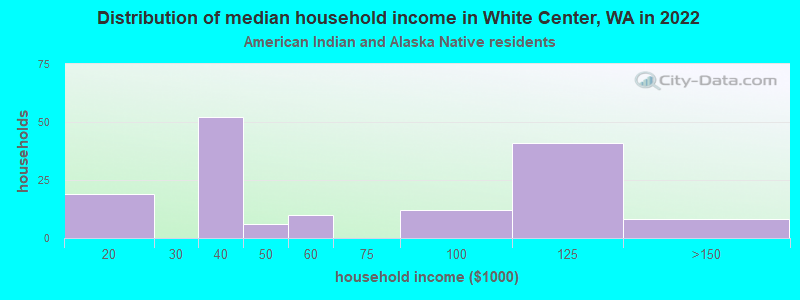
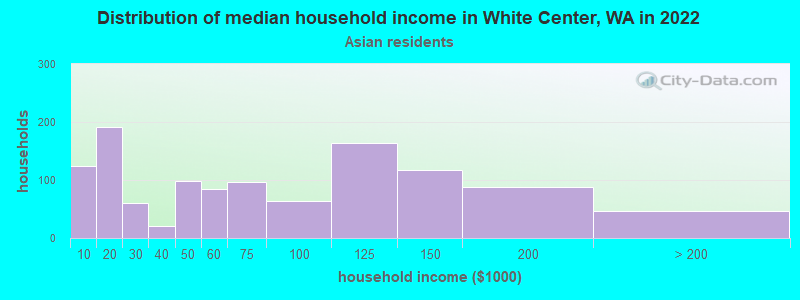
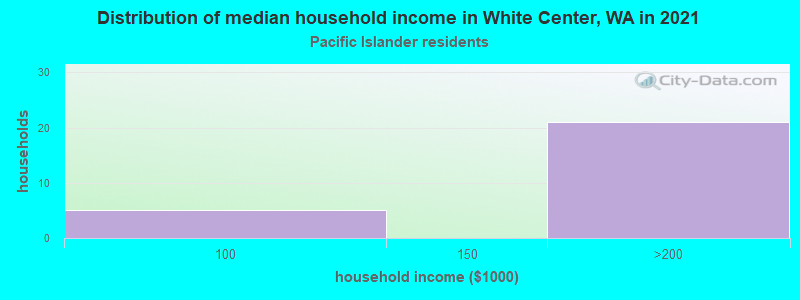
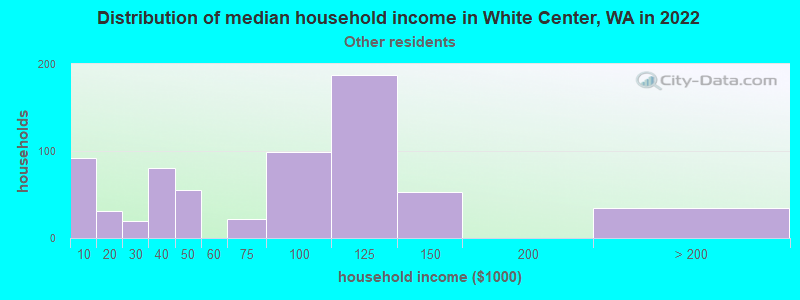
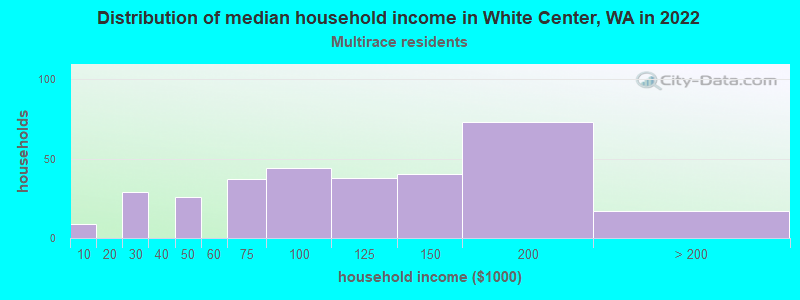
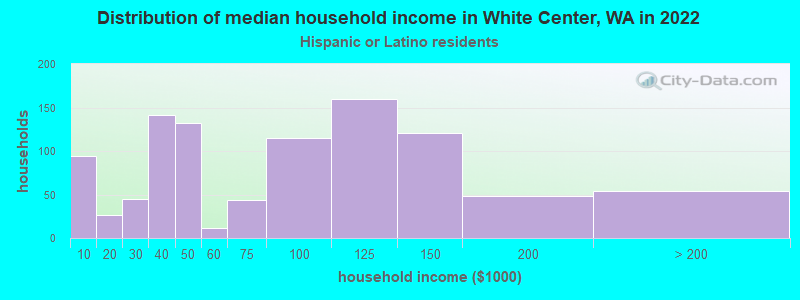
Income and house value in White Center Median household income in 2022 $98,088 White non-Hispanic householders$58,266 Asian householders$87,427 Some other race householders$106,781 Two or more races householders$69,343 Hispanic or Latino race householdersMedian 2022 house value $619,036 White Non-Hispanic householders$607,418 Black or African American householders$689,984 American Indian or Alaska Native householders $721,517 Asian householders$674,218 Native Hawaiian and other Pacific Islander householders$643,100 Some other race householders$700,357 Two or more races householders$610,323 Hispanic or Latino householders
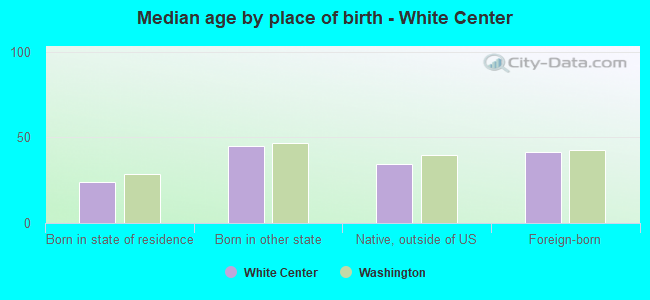
Median age by race in White Center
43.9 Median age for White residents42.7 45.0 33.8 Median age for Black or African American residents18.7 35.5 28.2 Median age for American Indian / Alaska Native residents29.5 24.6 37.1 Median age for Asian residents34.9 40.7 41.7 Median age for Native Hawaiian / Pacific Islander residents-664,509,168.7 -651,945,320.1 24.3 Median age for Other race residents30.3 21.4 30.7 Median age for Two or more races residents32.2 29.2 46.2 Median age for White alone residents44.6 48.7 23.7 Median age for Hispanic or Latino residents27.5 19.5
Owner/renter occupied households by race in White Center
House owners and renters - White residents 2,228 69.1% Owner occupied997 30.9% Renter occupiedHouse owners and renters - Black or African American residents 153 29.9% Owner occupied359 70.1% Renter occupiedHouse owners and renters - American Indian / Alaska Native residents 8 5.0% Owner occupied152 95.0% Renter occupiedHouse owners and renters - Asian residents 503 42.1% Owner occupied692 57.9% Renter occupiedHouse owners and renters - Native Hawaiian / Pacific Islander residents 13 67.6% Owner occupied6 32.4% Renter occupiedHouse owners and renters - Other race residents 110 17.0% Owner occupied538 83.0% Renter occupiedHouse owners and renters - Two or more races residents 229 69.5% Owner occupied100 30.5% Renter occupiedHouse owners and renters - White alone residents 2,183 71.9% Owner occupied853 28.1% Renter occupiedHouse owners and renters - Hispanic or Latino residents 250 25.6% Owner occupied724 74.4% Renter occupied
Language usage in White Center
English speakers - Total 58.0% of residents of White Center speak English at home.
18.1% of residents speak Spanish at home 1,304 48.6% Speak English very well1,380 51.4% Speak English less than very well24.7% of residents speak other language at home 1,869 50.9% Speak English very well1,800 49.1% Speak English less than very well
English speakers - Born in the United States 89.6% of residents of White Center speak English at home.
8.0% of residents speak Spanish at home 301 96.8% Speak English very well10 3.2% Speak English less than very well2.5% of residents speak other language at home 95 100.0% Speak English very well
English speakers - Native, born elsewhere 68.8% of residents of White Center speak English at home.
6.7% of residents speak Spanish at home 16 100.0% Speak English very well22.5% of residents speak other language at home 54 100.0% Speak English very well
English speakers - Foreign-born 9.2% of residents of White Center speak English at home.
31.6% of residents speak Spanish at home 375 24.5% Speak English very well1,153 75.5% Speak English less than very well58.0% of residents speak other language at home 1,128 40.3% Speak English very well1,674 59.7% Speak English less than very well
White (Caucasian) - Speak only English Native:
95.4% (5,188)Foreign-born:
16.3% (93)
White (Caucasian) - Speak another language Native:
4.6% (248)Foreign-born:
84.3% (483)
Black or African American - Speak another language Native:
34.8% (403)Foreign-born:
97.3% (489)
American Indian / Alaska Native - Speak another language Native:
18.5% (34)Foreign-born:
100.0% (41)
Asian - Speak only English Native:
70.1% (857)Foreign-born:
12.1% (282)
Asian - Speak another language Native:
27.8% (339)Foreign-born:
87.9% (2,038)
Other race - Speak only English Native:
37.0% (442)Foreign-born:
3.1% (42)
Other race - Speak another language Native:
62.7% (749)Foreign-born:
97.6% (1,310)
Two or more races - Speak only English Native:
80.3% (928)Foreign-born:
22.6% (36)
Two or more races - Speak another language Native:
20.3% (235)Foreign-born:
77.2% (123)
White alone - Speak only English Native:
97.9% (5,050)Foreign-born:
29.6% (95)
White alone - Speak another language Native:
1.9% (96)Foreign-born:
70.8% (227)
Hispanic or Latino - Speak only English Native:
46.6% (884)Foreign-born:
1.6% (25)
Hispanic or Latino - Speak another language Native:
54.0% (1,026)Foreign-born:
98.9% (1,527)
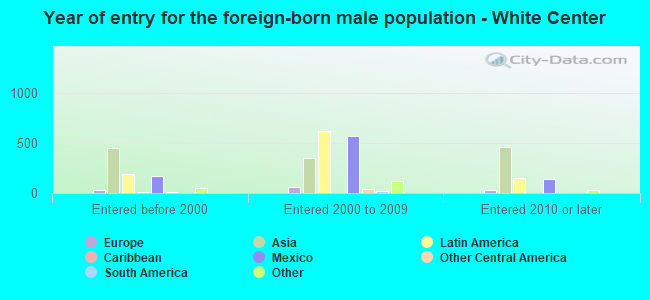
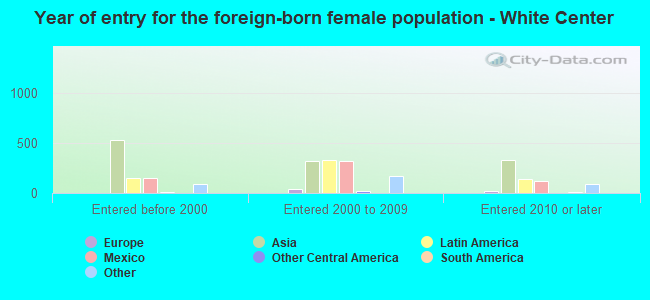
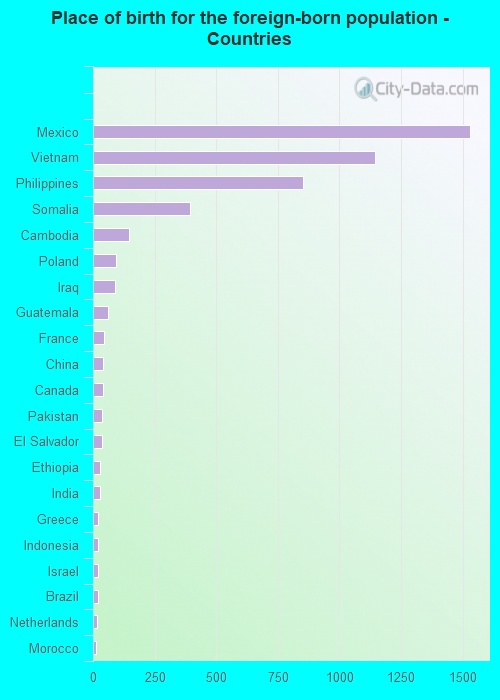
Foreign-born residents in White Center 4,865 residents are foreign born (14.9% Asia , 10.3% Latin America , 3.1% Africa ).
This city:
31.3%Washington:
14.9%
Marital status for residents in White Center Marital status - White (Caucasian) population 15 years and over
Males 39.2% Never married43.0% Now married2.9% Separated2.6% Widowed12.3% DivorcedFemales 27.6% Never married46.5% Now married1.4% Separated5.5% Widowed19.0% DivorcedWomen who gave birth in the past 12 months Now married:
100.0% (40)Unmarried:
0.0% (0)
Women who did not give birth in the past 12 months Now married:
52.7% (689)Unmarried:
47.3% (618)
Marital status - Black or African American population 15 years and over
Males 37.1% Never married42.6% Now married0.9% Separated2.0% Widowed17.4% DivorcedFemales 28.2% Never married40.6% Now married3.5% Separated1.5% Widowed26.3% DivorcedWomen who gave birth in the past 12 months Now married:
100.0% (3)Unmarried:
0.0% (0)
Women who did not give birth in the past 12 months Now married:
50.9% (260)Unmarried:
49.1% (251)
Marital status - American Indian / Alaska Native population 15 years and over
Males 66.2% Never married23.8% Now married0.0% Separated0.0% Widowed10.0% DivorcedFemales 86.6% Never married2.5% Now married0.0% Separated0.0% Widowed10.9% DivorcedWomen who did not give birth in the past 12 months Now married:
3.4% (4)Unmarried:
96.6% (103)
Marital status - Asian population 15 years and over
Males 45.5% Never married41.0% Now married0.0% Separated1.2% Widowed12.3% DivorcedFemales 33.8% Never married51.6% Now married2.7% Separated7.9% Widowed3.9% DivorcedWomen who gave birth in the past 12 months Now married:
31.0% (14)Unmarried:
69.0% (32)
Women who did not give birth in the past 12 months Now married:
44.2% (358)Unmarried:
55.8% (452)
Marital status - Native Hawaiian / Pacific Islander population 15 years and over
Males 0.0% Never married100.0% Now married0.0% Separated0.0% Widowed0.0% DivorcedFemales 0.0% Never married100.0% Now married0.0% Separated0.0% Widowed0.0% DivorcedWomen who did not give birth in the past 12 months Now married:
100.0% (9)Unmarried:
0.0% (0)
Marital status - Other race population 15 years and over
Males 50.5% Never married38.9% Now married7.4% Separated0.0% Widowed3.2% DivorcedFemales 60.3% Never married25.5% Now married2.8% Separated0.0% Widowed11.4% DivorcedWomen who gave birth in the past 12 months Now married:
75.5% (46)Unmarried:
24.5% (15)
Women who did not give birth in the past 12 months Now married:
16.7% (109)Unmarried:
83.3% (543)
Marital status - Two or more races population 15 years and over
Males 60.0% Never married38.2% Now married1.8% Separated0.0% Widowed0.0% DivorcedFemales 31.8% Never married42.6% Now married4.6% Separated7.1% Widowed13.8% DivorcedWomen who gave birth in the past 12 months Now married:
0.0% (0)Unmarried:
100.0% (16)
Women who did not give birth in the past 12 months Now married:
56.2% (179)Unmarried:
43.8% (139)
Marital status - White alone, not Hispanic / Latino population 15 years and over
Males 38.4% Never married44.9% Now married3.3% Separated2.8% Widowed10.6% DivorcedFemales 27.7% Never married46.0% Now married0.4% Separated5.9% Widowed20.0% DivorcedWomen who gave birth in the past 12 months Now married:
100.0% (41)Unmarried:
0.0% (0)
Women who did not give birth in the past 12 months Now married:
50.4% (595)Unmarried:
49.6% (586)
Marital status - Hispanic or Latino population 15 years and over
Males 50.5% Never married35.7% Now married5.1% Separated0.0% Widowed8.7% DivorcedFemales 48.9% Never married33.1% Now married6.5% Separated0.0% Widowed11.5% DivorcedWomen who gave birth in the past 12 months Now married:
58.7% (38)Unmarried:
41.3% (27)
Women who did not give birth in the past 12 months Now married:
34.8% (309)Unmarried:
65.2% (578)
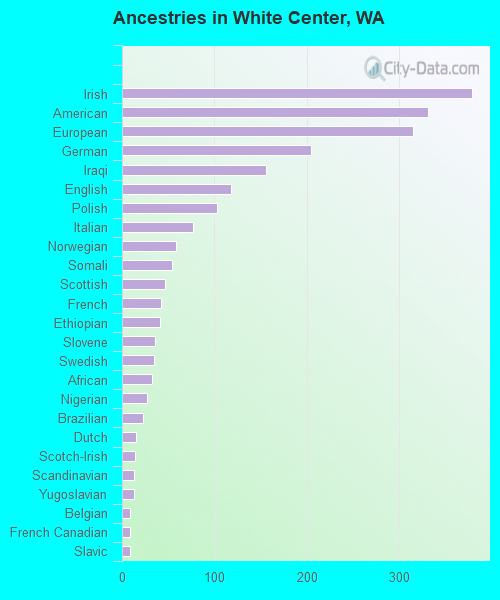
Ancestries in White Center
378 4.7% Irish331 4.1% American315 3.9% European204 2.5% German156 1.9% Iraqi118 1.5% English103 1.3% Polish77 1.0% Italian58 0.7% Norwegian54 0.7% Somali47 0.6% Scottish42 0.5% French41 0.5% Ethiopian36 0.4% Slovene35 0.4% Swedish32 0.4% African27 0.3% Nigerian23 0.3% Brazilian15 0.2% Dutch14 0.2% Scotch-Irish13 0.2% Scandinavian13 0.2% Yugoslavian9 0.1% Belgian9 0.1% French Canadian9 0.1% Slavic8 0.10% Basque6 0.07% British6 0.07% Icelander5 0.06% Lithuanian3 0.04% Canadian
Geographical mobility in White Center Same house 1 year ago 5,279 84.3% White (Caucasian)1,456 82.6% Black or African American235 96.7% American Indian / Alaska Native3,179 89.8% Asian21 100.0% Native Hawaiian / Pacific Islander2,256 84.9% Other race1,224 84.3% Two or more races4,837 85.0% White alone, not Hispanic / Latino3,130 84.3% Hispanic or LatinoMoved within same county 527 8.4% White / Caucasian219 12.4% Black or African American317 9.0% Asian128 4.8% Other race133 9.2% Two or more races538 9.4% White alone, not Hispanic / Latino124 3.3% Hispanic or LatinoMoved within same state 163 2.6% White / Caucasian15 0.9% Black or African American96 6.6% Two or more races163 2.9% White alone, not Hispanic / Latino82 2.2% Hispanic or LatinoMoved from different state 259 4.1% White / Caucasian42 2.4% Black or African American12 0.9% Two or more races109 1.9% White alone, not Hispanic / Latino205 5.5% Hispanic or LatinoMoved from abroad 39 0.6% White24 0.7% Asian138 5.2% Other race9 0.6% Two or more races42 0.7% White alone, not Hispanic / Latino146 3.9% Hispanic or Latino
Children Nativity (place of birth) in White Center
Children under 6 years - Living with two parents Both parents native 252 100.0% NativeBoth parents foreign-born 252 100.0% NativeOne native, one foreign-born parent 49 100.0% NativeChildren under 6 years - Living with one parent Native parent 128 100.0% NativeForeign-born parent 93 44.6% Native116 55.4% Foreign-bornChildren 6 to 17 years - Living with two parents Both parents native 163 100.0% NativeBoth parents foreign-born 812 87.2% Native120 12.8% Foreign-bornOne native, one foreign-born parent 84 100.0% NativeChildren 6 to 17 years - Living with one parent Native parent 509 100.0% NativeForeign-born parent 453 55.4% Native364 44.6% Foreign-born
Grandparents responsible for own grandchildren in White Center
Grandparents (30 to 59 years) White / Caucasian 7 100.0% Not responsible for grandchildrenAmerican Indian / Alaska Native 9 100.0% Not responsible for grandchildrenAsian 6 5.3% Responsible for grandchildren104 94.7% Not responsible for grandchildrenOther race 35 72.1% Responsible for grandchildren14 27.9% Not responsible for grandchildrenWhite alone, not Hispanic / Latino 7 100.0% Not responsible for grandchildrenHispanic or Latino 32 53.2% Responsible for grandchildren28 46.8% Not responsible for grandchildrenGrandparents (60 years and over) White / Caucasian 25 42.4% Responsible for grandchildren34 57.6% Not responsible for grandchildrenAsian 25 29.3% Responsible for grandchildren61 70.7% Not responsible for grandchildrenWhite alone, not Hispanic / Latino 6 14.6% Responsible for grandchildren35 85.4% Not responsible for grandchildrenHispanic or Latino 21 100.0% Responsible for grandchildren