Races in West Richland, Washington (WA) Detailed Stats
Data:
Races - White alone (%)
Races - White alone (% change since 2000)
Races - Black alone (%)
Races - Black alone (% change since 2000)
Races - American Indian alone (%)
Races - American Indian alone (% change since 2000)
Races - Asian alone (%)
Races - Asian alone (% change since 2000)
Races - Hispanic (%)
Races - Hispanic (% change since 2000)
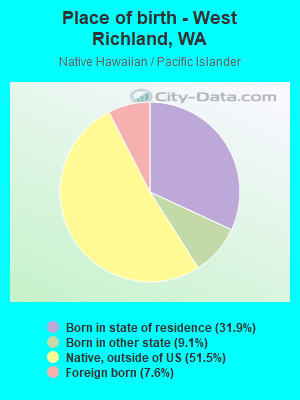
Races - Native Hawaiian and Other Pacific Islander alone (%)
Races - Native Hawaiian and Other Pacific Islander alone (% change since 2000)
Races - Two or more races(%)
Races - Two or more races(% change since 2000)
Races - Other race alone (%)
Races - Other race alone (% change since 2000)
Racial diversity
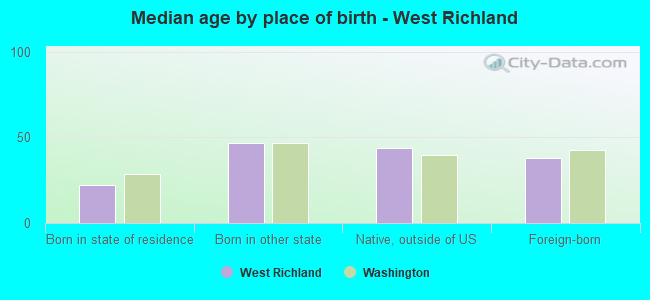
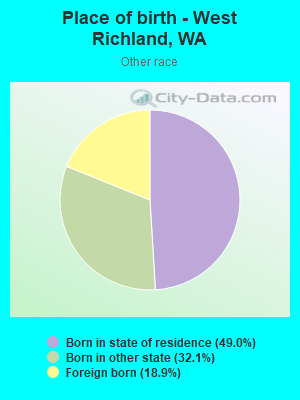
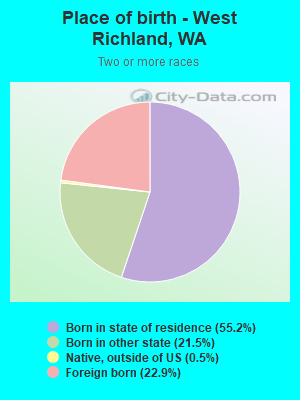
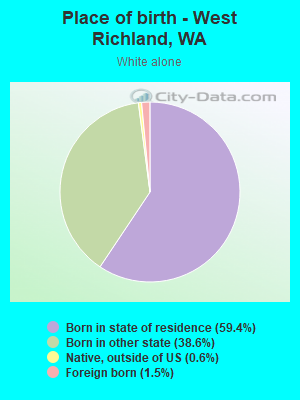
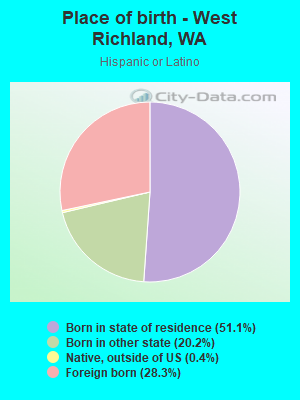
Place of birth - Born in state of residence (%)
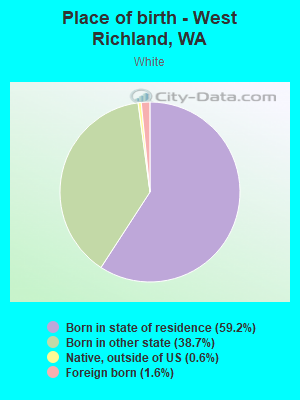
Place of birth - Born in state of residence (%) - White
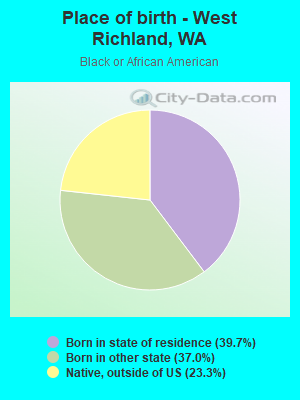
Place of birth - Born in state of residence (%) - Black or African American
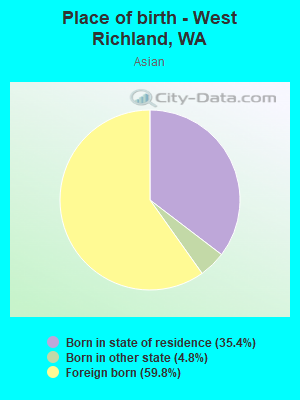
Place of birth - Born in state of residence (%) - Asian
Place of birth - Born in state of residence (%) - Hispanic or Latino
Place of birth - Born in state of residence (%) - American Indian and Alaska Native
Place of birth - Born in state of residence (%) - Multirace
Place of birth - Born in state of residence (%) - Other Race
Place of birth - Born in other state (%)
Place of birth - Born in other state (%) - White
Place of birth - Born in other state (%) - Black or African American
Place of birth - Born in other state (%) - Asian
Place of birth - Born in other state (%) - Hispanic or Latino
Place of birth - Born in other state (%) - American Indian and Alaska Native
Place of birth - Born in other state (%) - Multirace
Place of birth - Born in other state (%) - Other Race
Place of birth - Native, outside of US (%)
Place of birth - Native, outside of US (%) - White
Place of birth - Native, outside of US (%) - Black or African American
Place of birth - Native, outside of US (%) - Asian
Place of birth - Native, outside of US (%) - Hispanic or Latino
Place of birth - Native, outside of US (%) - American Indian and Alaska Native
Place of birth - Native, outside of US (%) - Multirace
Place of birth - Native, outside of US (%) - Other Race
Place of birth - Foreign born (%)
Place of birth - Foreign born (%) - White
Place of birth - Foreign born (%) - Black or African American
Place of birth - Foreign born (%) - Asian
Place of birth - Foreign born (%) - Hispanic or Latino
Place of birth - Foreign born (%) - American Indian and Alaska Native
Place of birth - Foreign born (%) - Multirace
Place of birth - Foreign born (%) - Other Race
Residents speaking English at home (%)
Residents speaking English at home - Born in the United States (%)
Residents speaking English at home - Native, born elsewhere (%)
Residents speaking English at home - Foreign born (%)
Residents speaking Spanish at home (%)
Residents speaking Spanish at home - Born in the United States (%)
Residents speaking Spanish at home - Native, born elsewhere (%)
Residents speaking Spanish at home - Foreign born (%)
Residents speaking other language at home (%)
Residents speaking other language at home - Born in the United States (%)
Residents speaking other language at home - Native, born elsewhere (%)
Residents speaking other language at home - Foreign born (%)
Marital status - Never married (%)
Marital status - Now married (%)
Marital status - Separated (%)
Marital status - Widowed (%)
Marital status - Divorced (%)
Ancestries Reported - Arab (%)
Ancestries Reported - Czech (%)
Ancestries Reported - Danish (%)
Ancestries Reported - Dutch (%)
Ancestries Reported - English (%)
Ancestries Reported - French (%)
Ancestries Reported - French Canadian (%)
Ancestries Reported - German (%)
Ancestries Reported - Greek (%)
Ancestries Reported - Hungarian (%)
Ancestries Reported - Irish (%)
Ancestries Reported - Italian (%)
Ancestries Reported - Lithuanian (%)
Ancestries Reported - Norwegian (%)
Ancestries Reported - Polish (%)
Ancestries Reported - Portuguese (%)
Ancestries Reported - Russian (%)
Ancestries Reported - Scotch-Irish (%)
Ancestries Reported - Scottish (%)
Ancestries Reported - Slovak (%)
Ancestries Reported - Subsaharan African (%)
Ancestries Reported - Swedish (%)
Ancestries Reported - Swiss (%)
Ancestries Reported - Ukrainian (%)
Ancestries Reported - United States (%)
Ancestries Reported - Welsh (%)
Ancestries Reported - West Indian (%)
Ancestries Reported - Other (%)
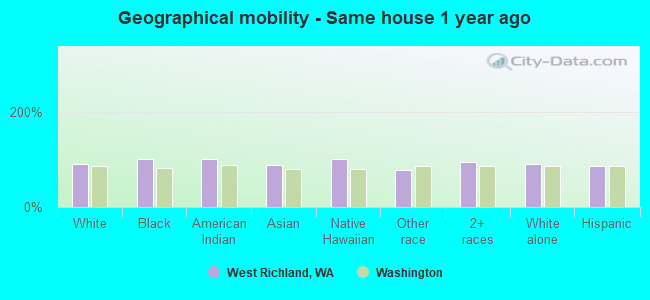
Geographical mobility - Same house 1 year ago (%)
Geographical mobility - Same house 1 year ago (%) - White
Geographical mobility - Same house 1 year ago (%) - Black or African American
Geographical mobility - Same house 1 year ago (%) - Asian
Geographical mobility - Same house 1 year ago (%) - Hispanic or Latino
Geographical mobility - Same house 1 year ago (%) - American Indian and Alaska Native
Geographical mobility - Same house 1 year ago (%) - Multirace
Geographical mobility - Same house 1 year ago (%) - Other Race
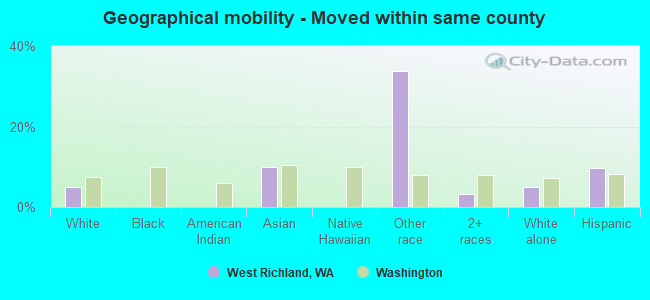
Geographical mobility - Moved within same county (%)
Geographical mobility - Moved within same county (%) - White
Geographical mobility - Moved within same county (%) - Black or African American
Geographical mobility - Moved within same county (%) - Asian
Geographical mobility - Moved within same county (%) - Hispanic or Latino
Geographical mobility - Moved within same county (%) - American Indian and Alaska Native
Geographical mobility - Moved within same county (%) - Multirace
Geographical mobility - Moved within same county (%) - Other Race
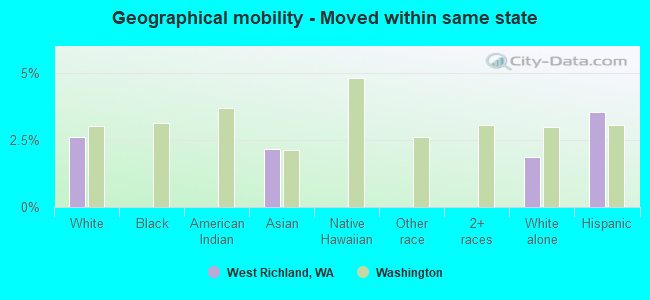
Geographical mobility - Moved from different county within same state (%)
Geographical mobility - Moved from different county within same state (%) - White
Geographical mobility - Moved from different county within same state (%) - Black or African American
Geographical mobility - Moved from different county within same state (%) - Asian
Geographical mobility - Moved from different county within same state (%) - Hispanic or Latino
Geographical mobility - Moved from different county within same state (%) - American Indian and Alaska Native
Geographical mobility - Moved from different county within same state (%) - Multirace
Geographical mobility - Moved from different county within same state (%) - Other Race
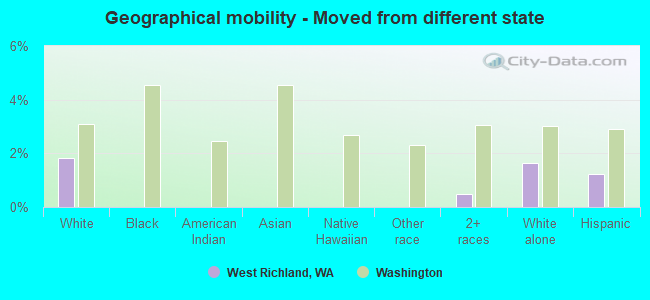
Geographical mobility - Moved from different state (%)
Geographical mobility - Moved from different state (%) - White
Geographical mobility - Moved from different state (%) - Black or African American
Geographical mobility - Moved from different state (%) - Asian
Geographical mobility - Moved from different state (%) - Hispanic or Latino
Geographical mobility - Moved from different state (%) - American Indian and Alaska Native
Geographical mobility - Moved from different state (%) - Multirace
Geographical mobility - Moved from different state (%) - Other Race
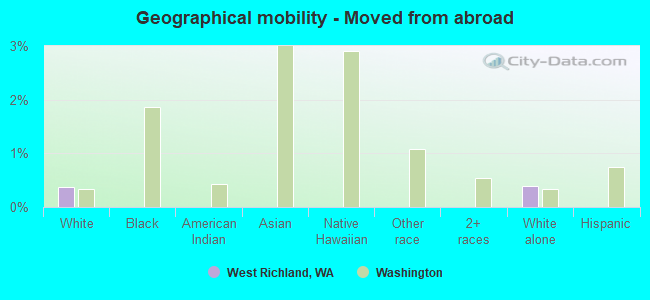
Geographical mobility - Moved from abroad (%)
Geographical mobility - Moved from abroad (%) - White
Geographical mobility - Moved from abroad (%) - Black or African American
Geographical mobility - Moved from abroad (%) - Asian
Geographical mobility - Moved from abroad (%) - Hispanic or Latino
Geographical mobility - Moved from abroad (%) - American Indian and Alaska Native
Geographical mobility - Moved from abroad (%) - Multirace
Geographical mobility - Moved from abroad (%) - Other Race
Place of birth for the foreign-born population - Ireland (%)
Place of birth for the foreign-born population - Denmark (%)
Place of birth for the foreign-born population - Norway (%)
Place of birth for the foreign-born population - Sweden (%)
Place of birth for the foreign-born population - United Kingdom (%)
Place of birth for the foreign-born population - England (%)
Place of birth for the foreign-born population - Scotland (%)
Place of birth for the foreign-born population - Other Northern Europe (%)
Place of birth for the foreign-born population - Austria (%)
Place of birth for the foreign-born population - Belgium (%)
Place of birth for the foreign-born population - France (%)
Place of birth for the foreign-born population - Germany (%)
Place of birth for the foreign-born population - Netherlands (%)
Place of birth for the foreign-born population - Switzerland (%)
Place of birth for the foreign-born population - Other Western Europe (%)
Place of birth for the foreign-born population - Greece (%)
Place of birth for the foreign-born population - Italy (%)
Place of birth for the foreign-born population - Portugal (%)
Place of birth for the foreign-born population - Spain (%)
Place of birth for the foreign-born population - Other Southern Europe (%)
Place of birth for the foreign-born population - Albania (%)
Place of birth for the foreign-born population - Belarus (%)
Place of birth for the foreign-born population - Bosnia and Herzegovina (%)
Place of birth for the foreign-born population - Bulgaria (%)
Place of birth for the foreign-born population - Croatia (%)
Place of birth for the foreign-born population - Czechoslovakia (%)
Place of birth for the foreign-born population - Hungary (%)
Place of birth for the foreign-born population - Latvia (%)
Place of birth for the foreign-born population - Lithuania (%)
Place of birth for the foreign-born population - North Macedonia (Macedonia) (%)
Place of birth for the foreign-born population - Moldova (%)
Place of birth for the foreign-born population - Poland (%)
Place of birth for the foreign-born population - Romania (%)
Place of birth for the foreign-born population - Russia (%)
Place of birth for the foreign-born population - Serbia (%)
Place of birth for the foreign-born population - Ukraine (%)
Place of birth for the foreign-born population - Other Eastern Europe (%)
Place of birth for the foreign-born population - China (%)
Place of birth for the foreign-born population - Hong Kong (%)
Place of birth for the foreign-born population - Taiwan (%)
Place of birth for the foreign-born population - Japan (%)
Place of birth for the foreign-born population - Korea (%)
Place of birth for the foreign-born population - Other Eastern Asia (%)
Place of birth for the foreign-born population - Afghanistan (%)
Place of birth for the foreign-born population - Bangladesh (%)
Place of birth for the foreign-born population - India (%)
Place of birth for the foreign-born population - Iran (%)
Place of birth for the foreign-born population - Kazakhstan (%)
Place of birth for the foreign-born population - Nepal (%)
Place of birth for the foreign-born population - Pakistan (%)
Place of birth for the foreign-born population - Sri Lanka (%)
Place of birth for the foreign-born population - Uzbekistan (%)
Place of birth for the foreign-born population - Other South Central Asia (%)
Place of birth for the foreign-born population - Burma (%)
Place of birth for the foreign-born population - Cambodia (%)
Place of birth for the foreign-born population - Indonesia (%)
Place of birth for the foreign-born population - Laos (%)
Place of birth for the foreign-born population - Malaysia (%)
Place of birth for the foreign-born population - Philippines (%)
Place of birth for the foreign-born population - Singapore (%)
Place of birth for the foreign-born population - Thailand (%)
Place of birth for the foreign-born population - Vietnam (%)
Place of birth for the foreign-born population - Other South Eastern Asia (%)
Place of birth for the foreign-born population - Armenia (%)
Place of birth for the foreign-born population - Iraq (%)
Place of birth for the foreign-born population - Israel (%)
Place of birth for the foreign-born population - Jordan (%)
Place of birth for the foreign-born population - Kuwait (%)
Place of birth for the foreign-born population - Lebanon (%)
Place of birth for the foreign-born population - Saudi Arabia (%)
Place of birth for the foreign-born population - Syria (%)
Place of birth for the foreign-born population - Turkey (%)
Place of birth for the foreign-born population - Yemen (%)
Place of birth for the foreign-born population - Other Western Asia (%)
Place of birth for the foreign-born population - Eritrea (%)
Place of birth for the foreign-born population - Ethiopia (%)
Place of birth for the foreign-born population - Kenya (%)
Place of birth for the foreign-born population - Somalia (%)
Place of birth for the foreign-born population - Uganda (%)
Place of birth for the foreign-born population - Zimbabwe (%)
Place of birth for the foreign-born population - Other Eastern Africa (%)
Place of birth for the foreign-born population - Cameroon (%)
Place of birth for the foreign-born population - Congo (%)
Place of birth for the foreign-born population - Democratic Republic of Congo (Zaire) (%)
Place of birth for the foreign-born population - Other Middle Africa (%)
Place of birth for the foreign-born population - Egypt (%)
Place of birth for the foreign-born population - Morocco (%)
Place of birth for the foreign-born population - Sudan (%)
Place of birth for the foreign-born population - Other Northern Africa (%)
Place of birth for the foreign-born population - South Africa (%)
Place of birth for the foreign-born population - Other Southern Africa (%)
Place of birth for the foreign-born population - Cabo Verde (%)
Place of birth for the foreign-born population - Ghana (%)
Place of birth for the foreign-born population - Liberia (%)
Place of birth for the foreign-born population - Nigeria (%)
Place of birth for the foreign-born population - Senegal (%)
Place of birth for the foreign-born population - Sierra Leone (%)
Place of birth for the foreign-born population - Other Western Africa (%)
Place of birth for the foreign-born population - Australia (%)
Place of birth for the foreign-born population - New Zealand (%)
Place of birth for the foreign-born population - Fiji (%)
Place of birth for the foreign-born population - Micronesia (%)
Place of birth for the foreign-born population - Bahamas (%)
Place of birth for the foreign-born population - Barbados (%)
Place of birth for the foreign-born population - Cuba (%)
Place of birth for the foreign-born population - Dominica (%)
Place of birth for the foreign-born population - Dominican Republic (%)
Place of birth for the foreign-born population - Grenada (%)
Place of birth for the foreign-born population - Haiti (%)
Place of birth for the foreign-born population - Jamaica (%)
Place of birth for the foreign-born population - St. Vincent and the Grenadines (%)
Place of birth for the foreign-born population - Trinidad and Tobago (%)
Place of birth for the foreign-born population - West Indies (%)
Place of birth for the foreign-born population - Other Caribbean (%)
Place of birth for the foreign-born population - Belize (%)
Place of birth for the foreign-born population - Costa Rica (%)
Place of birth for the foreign-born population - El Salvador (%)
Place of birth for the foreign-born population - Guatemala (%)
Place of birth for the foreign-born population - Honduras (%)
Place of birth for the foreign-born population - Mexico (%)
Place of birth for the foreign-born population - Nicaragua (%)
Place of birth for the foreign-born population - Panama (%)
Place of birth for the foreign-born population - Other Central America (%)
Place of birth for the foreign-born population - Argentina (%)
Place of birth for the foreign-born population - Bolivia (%)
Place of birth for the foreign-born population - Brazil (%)
Place of birth for the foreign-born population - Chile (%)
Place of birth for the foreign-born population - Colombia (%)
Place of birth for the foreign-born population - Ecuador (%)
Place of birth for the foreign-born population - Guyana (%)
Place of birth for the foreign-born population - Peru (%)
Place of birth for the foreign-born population - Uruguay (%)
Place of birth for the foreign-born population - Venezuela (%)
Place of birth for the foreign-born population - Other South America (%)
Place of birth for the foreign-born population - Canada (%)
Place of birth for the foreign-born population - Other Northern America (%)
Place of birth for the foreign-born population - Other (%)
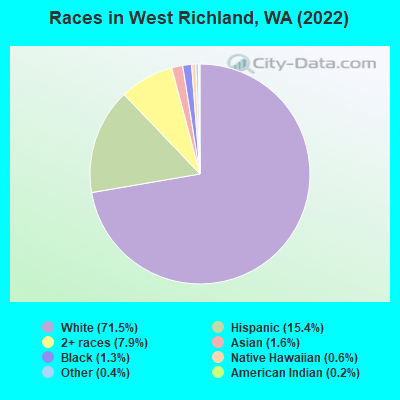
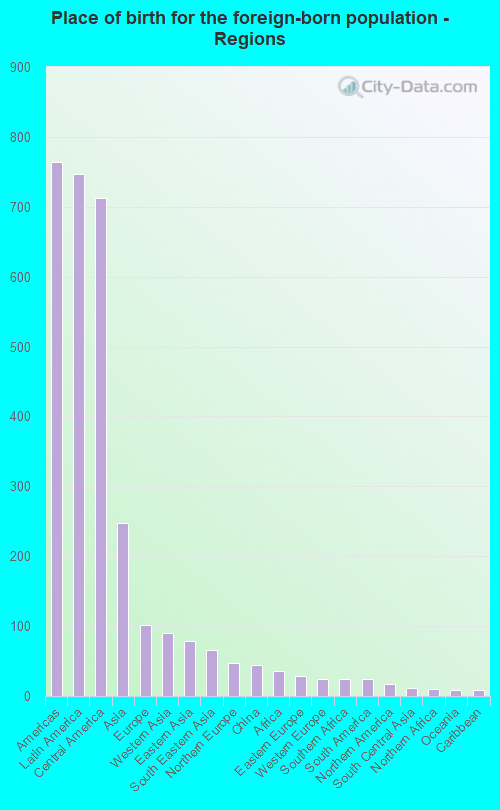
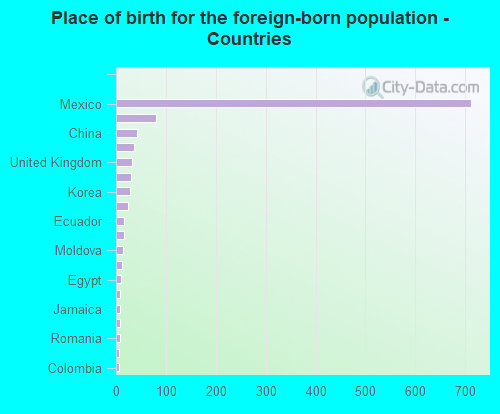
According to 2022 data, the most numerous races in West Richland, WA are White alone (12,127 residents), Hispanic (2,619 residents), and Asian alone (274 residents). 89.0% of West Richland residents speak English at home. 6.8% of West Richland, WA residents are foreign-born (4.3% born in Latin America, 1.4% born in Asia), which is 119.2% less than the foreign-born rate of 15.0% across the entire state of Washington.
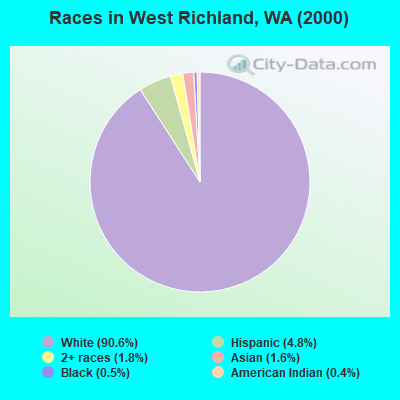
Race distribution in West Richland
2000 2022
4,652,490 78.9% White alone 441,509 7.5% Hispanic 319,401 5.4% Asian alone 184,631 3.1% Black alone 175,926 3.0% Two or more races 85,396 1.4% American Indian alone 22,779 0.4% Native Hawaiian and Other 11,989 0.2% Other race alone
4,941,456 63.5% White alone 1,093,313 14.0% Hispanic 755,832 9.7% Asian alone 523,448 6.7% Two or more races 299,537 3.8% Black alone 69,024 0.9% American Indian alone 52,231 0.7% Native Hawaiian and Other 50,945 0.7% Other race alone
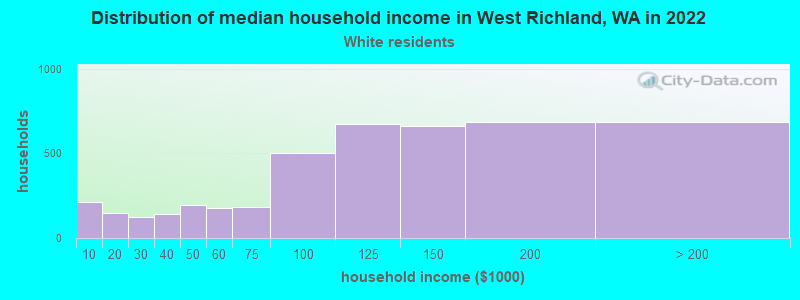
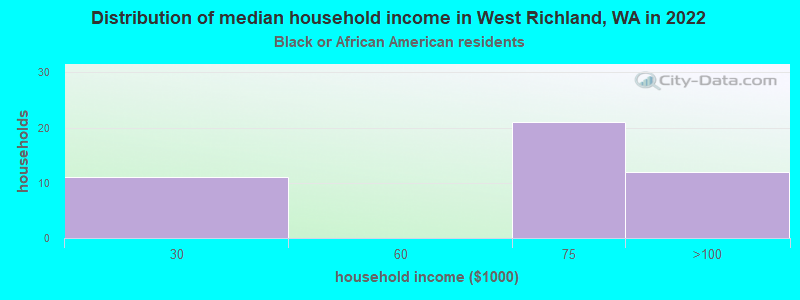
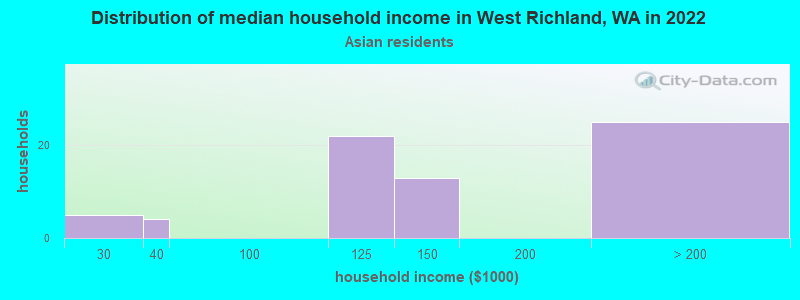
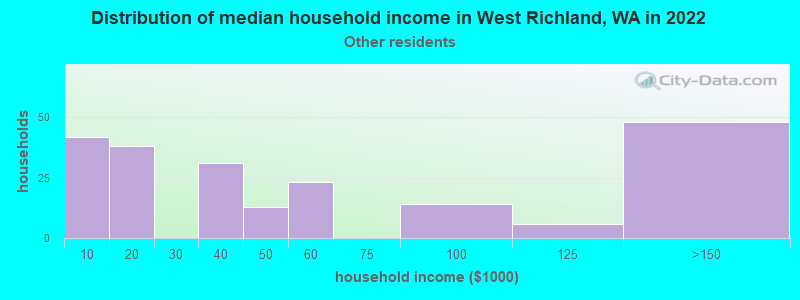
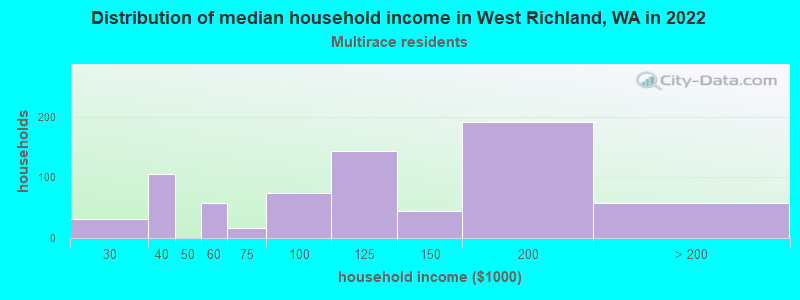
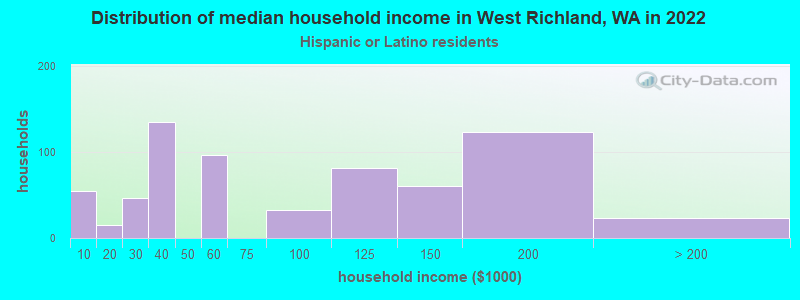
Income and house value in West Richland Median household income in 2022 $121,090 White non-Hispanic householders$89,104 Black householders$172,547 Asian householders$44,620 Some other race householders$116,639 Two or more races householders$57,896 Hispanic or Latino race householdersMedian 2022 house value $494,866 White Non-Hispanic householders$371,345 Black or African American householders$879,502 American Indian or Alaska Native householders $431,542 Asian householders$450,305 Two or more races householders$582,034 Hispanic or Latino householders
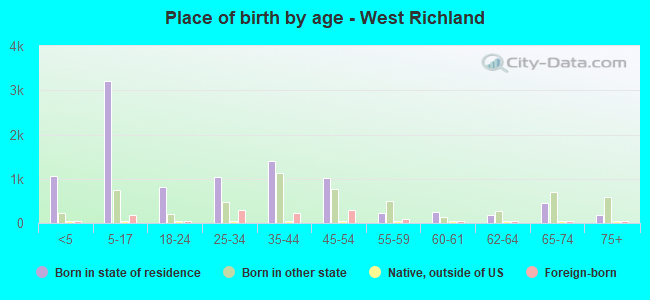
Median age by race in West Richland
40.5 Median age for White residents39.7 41.1 10.6 Median age for Black or African American residents31.8 18.4 50.7 Median age for American Indian / Alaska Native residents-375,384,615.0 57.3 27.7 Median age for Asian residents43.2 27.8 41.3 Median age for Native Hawaiian / Pacific Islander residents-696,774,192.9 1.9 31.6 Median age for Other race residents35.3 31.9 16.3 Median age for Two or more races residents17.6 15.4 40.0 Median age for White alone residents39.0 39.9 25.4 Median age for Hispanic or Latino residents27.0 24.4
Owner/renter occupied households by race in West Richland
House owners and renters - White residents 3,915 88.1% Owner occupied529 11.9% Renter occupiedHouse owners and renters - Black or African American residents 36 78.2% Owner occupied10 21.8% Renter occupiedHouse owners and renters - American Indian / Alaska Native residents 6 100.0% Owner occupiedHouse owners and renters - Asian residents 48 90.9% Owner occupied5 9.1% Renter occupiedHouse owners and renters - Native Hawaiian / Pacific Islander residents 7 100.0% Owner occupiedHouse owners and renters - Other race residents 159 77.4% Owner occupied46 22.6% Renter occupiedHouse owners and renters - Two or more races residents 580 74.1% Owner occupied203 25.9% Renter occupiedHouse owners and renters - White alone residents 3,941 88.2% Owner occupied525 11.8% Renter occupiedHouse owners and renters - Hispanic or Latino residents 415 71.3% Owner occupied167 28.7% Renter occupied
Language usage in West Richland
English speakers - Total 89.0% of residents of West Richland speak English at home.
9.7% of residents speak Spanish at home 749 49.5% Speak English very well764 50.5% Speak English less than very well2.2% of residents speak other language at home 234 69.4% Speak English very well103 30.6% Speak English less than very well
English speakers - Born in the United States 97.4% of residents of West Richland speak English at home.
4.7% of residents speak Spanish at home 121 46.0% Speak English very well142 54.0% Speak English less than very well0.4% of residents speak other language at home 10 40.0% Speak English very well15 60.0% Speak English less than very well
English speakers - Native, born elsewhere 72.5% of residents of West Richland speak English at home.
14.5% of residents speak Spanish at home 20 100.0% Speak English very well44.2% of residents speak other language at home 55 90.2% Speak English very well6 9.8% Speak English less than very well
English speakers - Foreign-born 14.5% of residents of West Richland speak English at home.
65.1% of residents speak Spanish at home 214 29.1% Speak English very well521 70.9% Speak English less than very well18.9% of residents speak other language at home 156 73.2% Speak English very well57 26.8% Speak English less than very well
White (Caucasian) - Speak only English Native:
100.0% (11,477)Foreign-born:
45.9% (81)
White (Caucasian) - Speak another language Native:
1.2% (135)Foreign-born:
55.0% (98)
Asian - Speak only English Native:
59.9% (46)Foreign-born:
37.3% (61)
Asian - Speak another language Native:
40.5% (31)Foreign-born:
58.2% (95)
Native Hawaiian / Pacific Islander - Speak another language Native:
100.0% (67)Foreign-born:
96.0% (8)
Other race - Speak another language Native:
54.9% (288)Foreign-born:
100.0% (131)
Two or more races - Speak only English Native:
75.6% (1,640)Foreign-born:
1.8% (15)
Two or more races - Speak another language Native:
24.5% (533)Foreign-born:
99.6% (827)
White alone - Speak only English Native:
99.2% (11,181)Foreign-born:
41.2% (68)
White alone - Speak another language Native:
1.0% (114)Foreign-born:
58.7% (97)
Hispanic or Latino - Speak only English Native:
61.8% (1,029)Foreign-born:
1.9% (14)
Hispanic or Latino - Speak another language Native:
40.7% (678)Foreign-born:
97.8% (716)
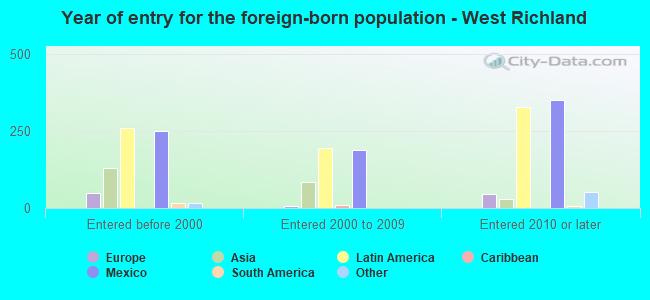
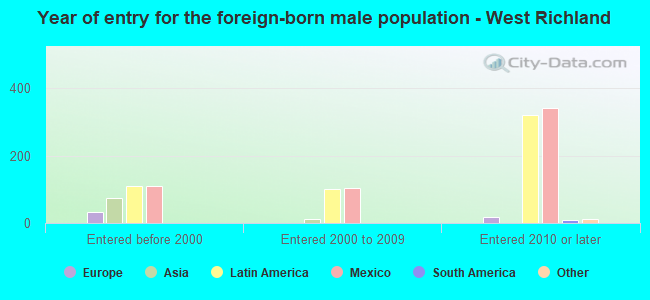
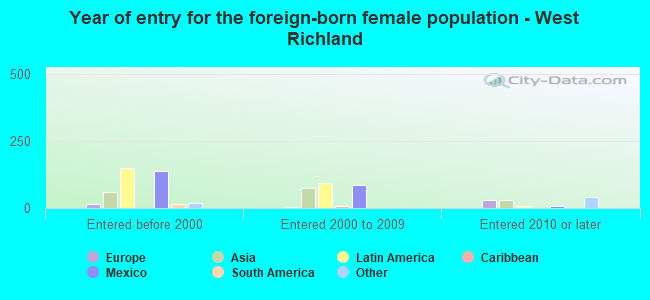
Foreign-born residents in West Richland 1,161 residents are foreign born (4.3% Latin America , 1.4% Asia ).
This city:
6.8%Washington:
14.9%
Marital status for residents in West Richland Marital status - White (Caucasian) population 15 years and over
Males 25.8% Never married64.5% Now married0.3% Separated1.8% Widowed7.7% DivorcedFemales 20.9% Never married60.4% Now married2.2% Separated7.0% Widowed9.5% DivorcedWomen who gave birth in the past 12 months Now married:
91.7% (157)Unmarried:
8.3% (14)
Women who did not give birth in the past 12 months Now married:
60.5% (1,736)Unmarried:
39.5% (1,132)
Marital status - Black or African American population 15 years and over
Males 13.9% Never married86.1% Now married0.0% Separated0.0% Widowed0.0% DivorcedFemales 0.0% Never married85.0% Now married0.0% Separated15.0% Widowed0.0% DivorcedWomen who did not give birth in the past 12 months Now married:
100.0% (12)Unmarried:
0.0% (0)
Marital status - American Indian / Alaska Native population 15 years and over
Males 0.0% Never married100.0% Now married0.0% Separated0.0% Widowed0.0% DivorcedFemales 0.0% Never married100.0% Now married0.0% Separated0.0% Widowed0.0% DivorcedWomen who did not give birth in the past 12 months Now married:
100.0% (35)Unmarried:
0.0% (0)
Marital status - Asian population 15 years and over
Males 31.8% Never married68.2% Now married0.0% Separated0.0% Widowed0.0% DivorcedFemales 14.6% Never married69.9% Now married6.5% Separated0.0% Widowed8.9% DivorcedWomen who did not give birth in the past 12 months Now married:
71.8% (60)Unmarried:
28.2% (24)
Marital status - Native Hawaiian / Pacific Islander population 15 years and over
Males 0.0% Never married100.0% Now married0.0% Separated0.0% Widowed0.0% DivorcedFemales 42.3% Never married57.7% Now married0.0% Separated0.0% Widowed0.0% DivorcedWomen who did not give birth in the past 12 months Now married:
45.0% (10)Unmarried:
55.0% (12)
Marital status - Other race population 15 years and over
Males 56.4% Never married29.5% Now married0.0% Separated0.0% Widowed14.1% DivorcedFemales 32.8% Never married17.7% Now married0.0% Separated0.0% Widowed49.4% DivorcedWomen who did not give birth in the past 12 months Now married:
4.4% (8)Unmarried:
95.6% (171)
Marital status - Two or more races population 15 years and over
Males 48.3% Never married42.4% Now married0.0% Separated0.0% Widowed9.3% DivorcedFemales 39.0% Never married46.2% Now married8.4% Separated0.0% Widowed6.4% DivorcedWomen who gave birth in the past 12 months Now married:
100.0% (98)Unmarried:
0.0% (0)
Women who did not give birth in the past 12 months Now married:
49.4% (348)Unmarried:
50.6% (356)
Marital status - White alone, not Hispanic / Latino population 15 years and over
Males 25.6% Never married65.1% Now married0.3% Separated1.1% Widowed7.9% DivorcedFemales 20.4% Never married60.7% Now married2.0% Separated7.2% Widowed9.7% DivorcedWomen who gave birth in the past 12 months Now married:
91.2% (150)Unmarried:
8.8% (14)
Women who did not give birth in the past 12 months Now married:
61.1% (1,697)Unmarried:
38.9% (1,081)
Marital status - Hispanic or Latino population 15 years and over
Males 50.9% Never married34.3% Now married0.0% Separated4.4% Widowed10.4% DivorcedFemales 39.5% Never married36.8% Now married6.3% Separated0.0% Widowed17.4% DivorcedWomen who gave birth in the past 12 months Now married:
100.0% (47)Unmarried:
0.0% (0)
Women who did not give birth in the past 12 months Now married:
36.9% (256)Unmarried:
63.1% (438)
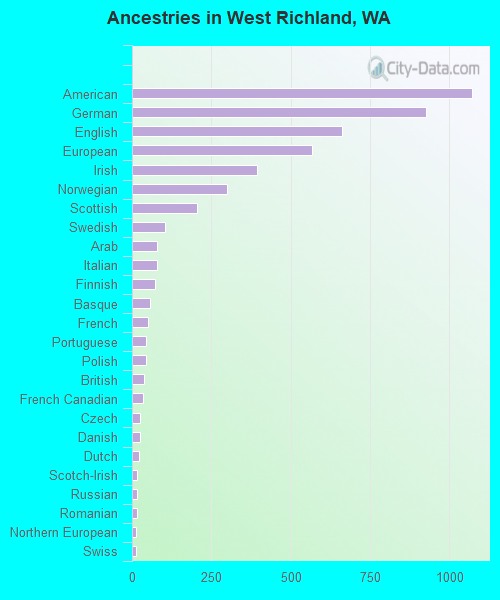
Ancestries in West Richland
1,072 13.5% American928 11.7% German661 8.3% English569 7.2% European394 5.0% Irish300 3.8% Norwegian205 2.6% Scottish105 1.3% Swedish79 1.0% Arab78 1.0% Italian74 0.9% Finnish57 0.7% Basque50 0.6% French45 0.6% Portuguese44 0.6% Polish39 0.5% British36 0.5% French Canadian24 0.3% Czech24 0.3% Danish21 0.3% Dutch17 0.2% Scotch-Irish16 0.2% Russian15 0.2% Romanian14 0.2% Northern European14 0.2% Swiss12 0.2% German Russian8 0.1% Canadian7 0.09% Austrian7 0.09% Slovak7 0.09% Welsh
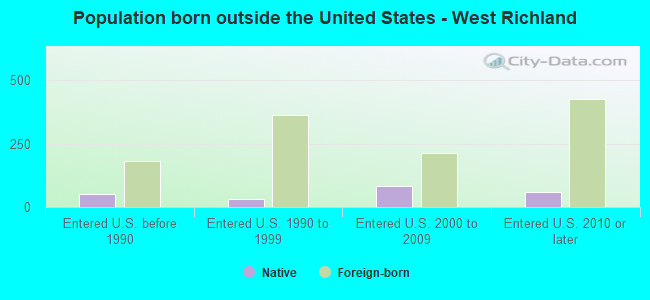
Children Nativity (place of birth) in West Richland
Children under 6 years - Living with two parents Both parents native 918 100.0% NativeBoth parents foreign-born 154 86.4% Native24 13.6% Foreign-bornOne native, one foreign-born parent 52 100.0% NativeChildren under 6 years - Living with one parent Native parent 263 100.0% NativeForeign-born parent 25 100.0% NativeChildren 6 to 17 years - Living with two parents Both parents native 2,719 100.0% NativeBoth parents foreign-born 237 67.1% Native116 32.9% Foreign-bornOne native, one foreign-born parent 71 78.9% Native19 21.1% Foreign-bornChildren 6 to 17 years - Living with one parent Native parent 501 100.0% NativeForeign-born parent 237 53.3% Native207 46.7% Foreign-born
Grandparents responsible for own grandchildren in West Richland
Grandparents (30 to 59 years) White / Caucasian 35 34.9% Responsible for grandchildren65 65.1% Not responsible for grandchildrenTwo or more races 13 100.0% Not responsible for grandchildrenWhite alone, not Hispanic / Latino 54 42.7% Responsible for grandchildren72 57.3% Not responsible for grandchildrenHispanic or Latino 12 100.0% Not responsible for grandchildrenGrandparents (60 years and over) White / Caucasian 117 68.1% Responsible for grandchildren55 31.9% Not responsible for grandchildrenWhite alone, not Hispanic / Latino 119 67.3% Responsible for grandchildren58 32.7% Not responsible for grandchildrenHispanic or Latino 18 100.0% Responsible for grandchildren