Races in West Odessa, Texas (TX) Detailed Stats
Data:
Races - White alone (%)
Races - White alone (% change since 2000)
Races - Black alone (%)
Races - Black alone (% change since 2000)
Races - American Indian alone (%)
Races - American Indian alone (% change since 2000)
Races - Asian alone (%)
Races - Asian alone (% change since 2000)
Races - Hispanic (%)
Races - Hispanic (% change since 2000)
Races - Native Hawaiian and Other Pacific Islander alone (%)
Races - Native Hawaiian and Other Pacific Islander alone (% change since 2000)
Races - Two or more races(%)
Races - Two or more races(% change since 2000)
Races - Other race alone (%)
Races - Other race alone (% change since 2000)
Racial diversity
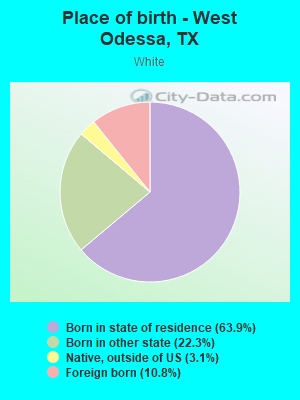
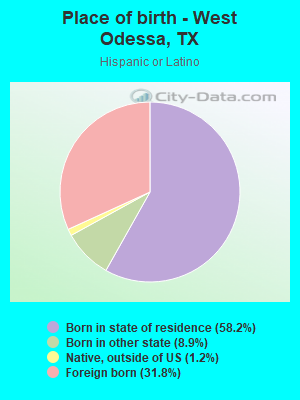
Place of birth - Born in state of residence (%)
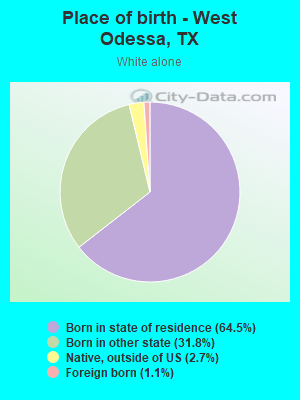
Place of birth - Born in state of residence (%) - White
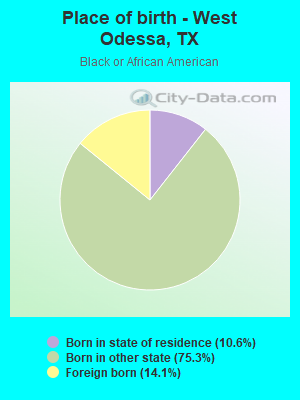
Place of birth - Born in state of residence (%) - Black or African American
Place of birth - Born in state of residence (%) - Asian
Place of birth - Born in state of residence (%) - Hispanic or Latino
Place of birth - Born in state of residence (%) - American Indian and Alaska Native
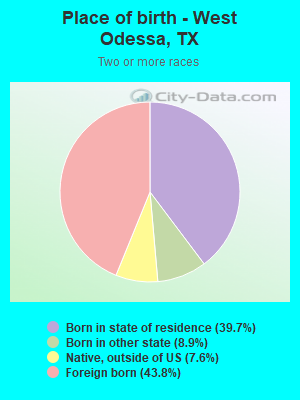
Place of birth - Born in state of residence (%) - Multirace
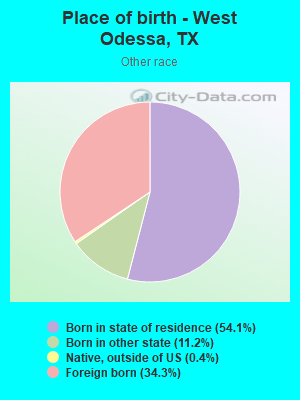
Place of birth - Born in state of residence (%) - Other Race
Place of birth - Born in other state (%)
Place of birth - Born in other state (%) - White
Place of birth - Born in other state (%) - Black or African American
Place of birth - Born in other state (%) - Asian
Place of birth - Born in other state (%) - Hispanic or Latino
Place of birth - Born in other state (%) - American Indian and Alaska Native
Place of birth - Born in other state (%) - Multirace
Place of birth - Born in other state (%) - Other Race
Place of birth - Native, outside of US (%)
Place of birth - Native, outside of US (%) - White
Place of birth - Native, outside of US (%) - Black or African American
Place of birth - Native, outside of US (%) - Asian
Place of birth - Native, outside of US (%) - Hispanic or Latino
Place of birth - Native, outside of US (%) - American Indian and Alaska Native
Place of birth - Native, outside of US (%) - Multirace
Place of birth - Native, outside of US (%) - Other Race
Place of birth - Foreign born (%)
Place of birth - Foreign born (%) - White
Place of birth - Foreign born (%) - Black or African American
Place of birth - Foreign born (%) - Asian
Place of birth - Foreign born (%) - Hispanic or Latino
Place of birth - Foreign born (%) - American Indian and Alaska Native
Place of birth - Foreign born (%) - Multirace
Place of birth - Foreign born (%) - Other Race
Residents speaking English at home (%)
Residents speaking English at home - Born in the United States (%)
Residents speaking English at home - Native, born elsewhere (%)
Residents speaking English at home - Foreign born (%)
Residents speaking Spanish at home (%)
Residents speaking Spanish at home - Born in the United States (%)
Residents speaking Spanish at home - Native, born elsewhere (%)
Residents speaking Spanish at home - Foreign born (%)
Residents speaking other language at home (%)
Residents speaking other language at home - Born in the United States (%)
Residents speaking other language at home - Native, born elsewhere (%)
Residents speaking other language at home - Foreign born (%)
Marital status - Never married (%)
Marital status - Now married (%)
Marital status - Separated (%)
Marital status - Widowed (%)
Marital status - Divorced (%)
Ancestries Reported - Arab (%)
Ancestries Reported - Czech (%)
Ancestries Reported - Danish (%)
Ancestries Reported - Dutch (%)
Ancestries Reported - English (%)
Ancestries Reported - French (%)
Ancestries Reported - French Canadian (%)
Ancestries Reported - German (%)
Ancestries Reported - Greek (%)
Ancestries Reported - Hungarian (%)
Ancestries Reported - Irish (%)
Ancestries Reported - Italian (%)
Ancestries Reported - Lithuanian (%)
Ancestries Reported - Norwegian (%)
Ancestries Reported - Polish (%)
Ancestries Reported - Portuguese (%)
Ancestries Reported - Russian (%)
Ancestries Reported - Scotch-Irish (%)
Ancestries Reported - Scottish (%)
Ancestries Reported - Slovak (%)
Ancestries Reported - Subsaharan African (%)
Ancestries Reported - Swedish (%)
Ancestries Reported - Swiss (%)
Ancestries Reported - Ukrainian (%)
Ancestries Reported - United States (%)
Ancestries Reported - Welsh (%)
Ancestries Reported - West Indian (%)
Ancestries Reported - Other (%)
Geographical mobility - Same house 1 year ago (%)
Geographical mobility - Same house 1 year ago (%) - White
Geographical mobility - Same house 1 year ago (%) - Black or African American
Geographical mobility - Same house 1 year ago (%) - Asian
Geographical mobility - Same house 1 year ago (%) - Hispanic or Latino
Geographical mobility - Same house 1 year ago (%) - American Indian and Alaska Native
Geographical mobility - Same house 1 year ago (%) - Multirace
Geographical mobility - Same house 1 year ago (%) - Other Race
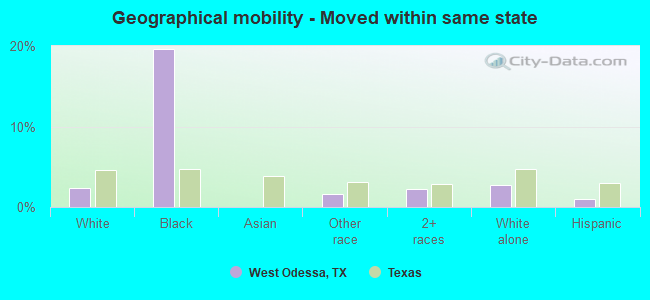
Geographical mobility - Moved within same county (%)
Geographical mobility - Moved within same county (%) - White
Geographical mobility - Moved within same county (%) - Black or African American
Geographical mobility - Moved within same county (%) - Asian
Geographical mobility - Moved within same county (%) - Hispanic or Latino
Geographical mobility - Moved within same county (%) - American Indian and Alaska Native
Geographical mobility - Moved within same county (%) - Multirace
Geographical mobility - Moved within same county (%) - Other Race
Geographical mobility - Moved from different county within same state (%)
Geographical mobility - Moved from different county within same state (%) - White
Geographical mobility - Moved from different county within same state (%) - Black or African American
Geographical mobility - Moved from different county within same state (%) - Asian
Geographical mobility - Moved from different county within same state (%) - Hispanic or Latino
Geographical mobility - Moved from different county within same state (%) - American Indian and Alaska Native
Geographical mobility - Moved from different county within same state (%) - Multirace
Geographical mobility - Moved from different county within same state (%) - Other Race
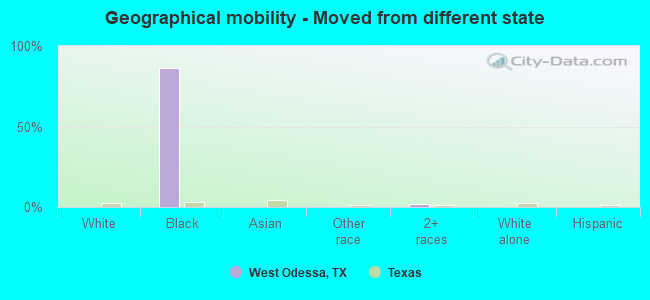
Geographical mobility - Moved from different state (%)
Geographical mobility - Moved from different state (%) - White
Geographical mobility - Moved from different state (%) - Black or African American
Geographical mobility - Moved from different state (%) - Asian
Geographical mobility - Moved from different state (%) - Hispanic or Latino
Geographical mobility - Moved from different state (%) - American Indian and Alaska Native
Geographical mobility - Moved from different state (%) - Multirace
Geographical mobility - Moved from different state (%) - Other Race
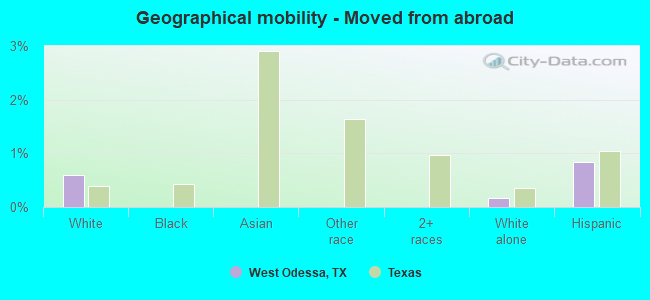
Geographical mobility - Moved from abroad (%)
Geographical mobility - Moved from abroad (%) - White
Geographical mobility - Moved from abroad (%) - Black or African American
Geographical mobility - Moved from abroad (%) - Asian
Geographical mobility - Moved from abroad (%) - Hispanic or Latino
Geographical mobility - Moved from abroad (%) - American Indian and Alaska Native
Geographical mobility - Moved from abroad (%) - Multirace
Geographical mobility - Moved from abroad (%) - Other Race
Place of birth for the foreign-born population - Ireland (%)
Place of birth for the foreign-born population - Denmark (%)
Place of birth for the foreign-born population - Norway (%)
Place of birth for the foreign-born population - Sweden (%)
Place of birth for the foreign-born population - United Kingdom (%)
Place of birth for the foreign-born population - England (%)
Place of birth for the foreign-born population - Scotland (%)
Place of birth for the foreign-born population - Other Northern Europe (%)
Place of birth for the foreign-born population - Austria (%)
Place of birth for the foreign-born population - Belgium (%)
Place of birth for the foreign-born population - France (%)
Place of birth for the foreign-born population - Germany (%)
Place of birth for the foreign-born population - Netherlands (%)
Place of birth for the foreign-born population - Switzerland (%)
Place of birth for the foreign-born population - Other Western Europe (%)
Place of birth for the foreign-born population - Greece (%)
Place of birth for the foreign-born population - Italy (%)
Place of birth for the foreign-born population - Portugal (%)
Place of birth for the foreign-born population - Spain (%)
Place of birth for the foreign-born population - Other Southern Europe (%)
Place of birth for the foreign-born population - Albania (%)
Place of birth for the foreign-born population - Belarus (%)
Place of birth for the foreign-born population - Bosnia and Herzegovina (%)
Place of birth for the foreign-born population - Bulgaria (%)
Place of birth for the foreign-born population - Croatia (%)
Place of birth for the foreign-born population - Czechoslovakia (%)
Place of birth for the foreign-born population - Hungary (%)
Place of birth for the foreign-born population - Latvia (%)
Place of birth for the foreign-born population - Lithuania (%)
Place of birth for the foreign-born population - North Macedonia (Macedonia) (%)
Place of birth for the foreign-born population - Moldova (%)
Place of birth for the foreign-born population - Poland (%)
Place of birth for the foreign-born population - Romania (%)
Place of birth for the foreign-born population - Russia (%)
Place of birth for the foreign-born population - Serbia (%)
Place of birth for the foreign-born population - Ukraine (%)
Place of birth for the foreign-born population - Other Eastern Europe (%)
Place of birth for the foreign-born population - China (%)
Place of birth for the foreign-born population - Hong Kong (%)
Place of birth for the foreign-born population - Taiwan (%)
Place of birth for the foreign-born population - Japan (%)
Place of birth for the foreign-born population - Korea (%)
Place of birth for the foreign-born population - Other Eastern Asia (%)
Place of birth for the foreign-born population - Afghanistan (%)
Place of birth for the foreign-born population - Bangladesh (%)
Place of birth for the foreign-born population - India (%)
Place of birth for the foreign-born population - Iran (%)
Place of birth for the foreign-born population - Kazakhstan (%)
Place of birth for the foreign-born population - Nepal (%)
Place of birth for the foreign-born population - Pakistan (%)
Place of birth for the foreign-born population - Sri Lanka (%)
Place of birth for the foreign-born population - Uzbekistan (%)
Place of birth for the foreign-born population - Other South Central Asia (%)
Place of birth for the foreign-born population - Burma (%)
Place of birth for the foreign-born population - Cambodia (%)
Place of birth for the foreign-born population - Indonesia (%)
Place of birth for the foreign-born population - Laos (%)
Place of birth for the foreign-born population - Malaysia (%)
Place of birth for the foreign-born population - Philippines (%)
Place of birth for the foreign-born population - Singapore (%)
Place of birth for the foreign-born population - Thailand (%)
Place of birth for the foreign-born population - Vietnam (%)
Place of birth for the foreign-born population - Other South Eastern Asia (%)
Place of birth for the foreign-born population - Armenia (%)
Place of birth for the foreign-born population - Iraq (%)
Place of birth for the foreign-born population - Israel (%)
Place of birth for the foreign-born population - Jordan (%)
Place of birth for the foreign-born population - Kuwait (%)
Place of birth for the foreign-born population - Lebanon (%)
Place of birth for the foreign-born population - Saudi Arabia (%)
Place of birth for the foreign-born population - Syria (%)
Place of birth for the foreign-born population - Turkey (%)
Place of birth for the foreign-born population - Yemen (%)
Place of birth for the foreign-born population - Other Western Asia (%)
Place of birth for the foreign-born population - Eritrea (%)
Place of birth for the foreign-born population - Ethiopia (%)
Place of birth for the foreign-born population - Kenya (%)
Place of birth for the foreign-born population - Somalia (%)
Place of birth for the foreign-born population - Uganda (%)
Place of birth for the foreign-born population - Zimbabwe (%)
Place of birth for the foreign-born population - Other Eastern Africa (%)
Place of birth for the foreign-born population - Cameroon (%)
Place of birth for the foreign-born population - Congo (%)
Place of birth for the foreign-born population - Democratic Republic of Congo (Zaire) (%)
Place of birth for the foreign-born population - Other Middle Africa (%)
Place of birth for the foreign-born population - Egypt (%)
Place of birth for the foreign-born population - Morocco (%)
Place of birth for the foreign-born population - Sudan (%)
Place of birth for the foreign-born population - Other Northern Africa (%)
Place of birth for the foreign-born population - South Africa (%)
Place of birth for the foreign-born population - Other Southern Africa (%)
Place of birth for the foreign-born population - Cabo Verde (%)
Place of birth for the foreign-born population - Ghana (%)
Place of birth for the foreign-born population - Liberia (%)
Place of birth for the foreign-born population - Nigeria (%)
Place of birth for the foreign-born population - Senegal (%)
Place of birth for the foreign-born population - Sierra Leone (%)
Place of birth for the foreign-born population - Other Western Africa (%)
Place of birth for the foreign-born population - Australia (%)
Place of birth for the foreign-born population - New Zealand (%)
Place of birth for the foreign-born population - Fiji (%)
Place of birth for the foreign-born population - Micronesia (%)
Place of birth for the foreign-born population - Bahamas (%)
Place of birth for the foreign-born population - Barbados (%)
Place of birth for the foreign-born population - Cuba (%)
Place of birth for the foreign-born population - Dominica (%)
Place of birth for the foreign-born population - Dominican Republic (%)
Place of birth for the foreign-born population - Grenada (%)
Place of birth for the foreign-born population - Haiti (%)
Place of birth for the foreign-born population - Jamaica (%)
Place of birth for the foreign-born population - St. Vincent and the Grenadines (%)
Place of birth for the foreign-born population - Trinidad and Tobago (%)
Place of birth for the foreign-born population - West Indies (%)
Place of birth for the foreign-born population - Other Caribbean (%)
Place of birth for the foreign-born population - Belize (%)
Place of birth for the foreign-born population - Costa Rica (%)
Place of birth for the foreign-born population - El Salvador (%)
Place of birth for the foreign-born population - Guatemala (%)
Place of birth for the foreign-born population - Honduras (%)
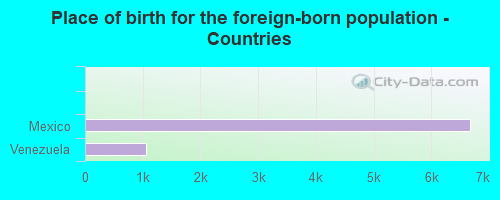
Place of birth for the foreign-born population - Mexico (%)
Place of birth for the foreign-born population - Nicaragua (%)
Place of birth for the foreign-born population - Panama (%)
Place of birth for the foreign-born population - Other Central America (%)
Place of birth for the foreign-born population - Argentina (%)
Place of birth for the foreign-born population - Bolivia (%)
Place of birth for the foreign-born population - Brazil (%)
Place of birth for the foreign-born population - Chile (%)
Place of birth for the foreign-born population - Colombia (%)
Place of birth for the foreign-born population - Ecuador (%)
Place of birth for the foreign-born population - Guyana (%)
Place of birth for the foreign-born population - Peru (%)
Place of birth for the foreign-born population - Uruguay (%)
Place of birth for the foreign-born population - Venezuela (%)
Place of birth for the foreign-born population - Other South America (%)
Place of birth for the foreign-born population - Canada (%)
Place of birth for the foreign-born population - Other Northern America (%)
Place of birth for the foreign-born population - Other (%)
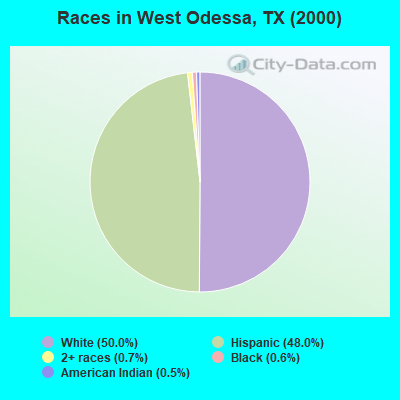
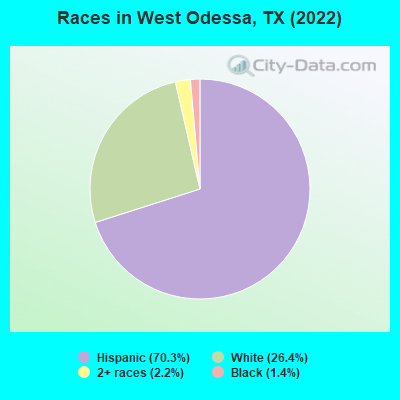
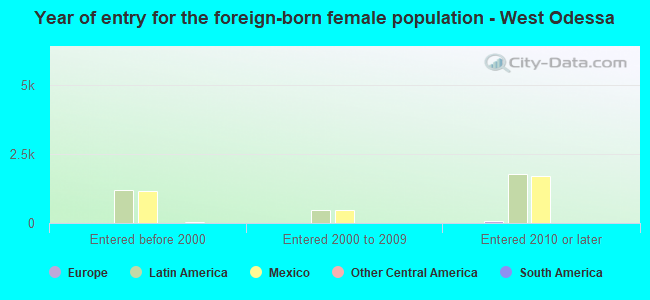
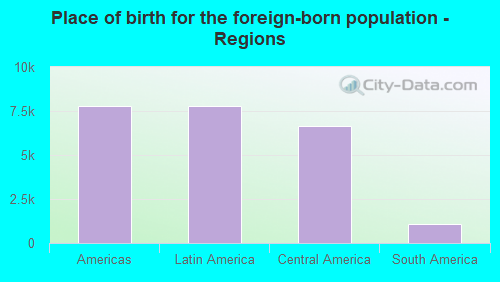
According to 2022 data, the most numerous races in West Odessa, TX are Hispanic (21,539 residents), White alone (8,099 residents), and Black alone (418 residents). 36.3% of West Odessa residents speak English at home. 25.7% of West Odessa, TX residents are foreign-born (24.3% born in Latin America), which is 33.9% greater than the foreign-born rate of 17.0% across the entire state of Texas.
Race distribution in West Odessa
2000 2022
10,933,313 52.4% White alone 6,669,666 32.0% Hispanic 2,364,255 11.3% Black alone 554,445 2.7% Asian alone 230,567 1.1% Two or more races 68,859 0.3% American Indian alone 19,958 0.10% Other race alone 10,757 0.05% Native Hawaiian and Other
12,070,642 40.2% Hispanic 11,683,430 38.9% White alone 3,508,706 11.7% Black alone 1,608,173 5.4% Asian alone 956,560 3.2% Two or more races 125,763 0.4% Other race alone 47,023 0.2% American Indian alone 29,275 0.10% Native Hawaiian and Other
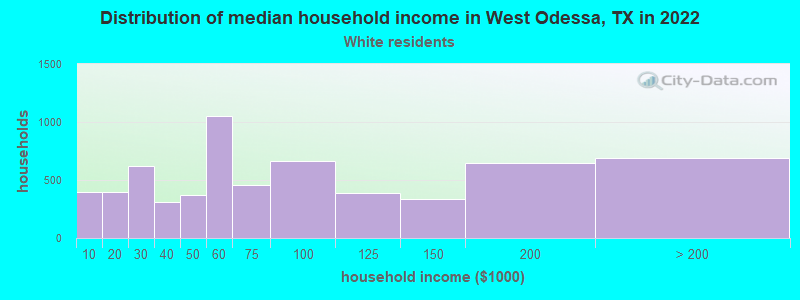
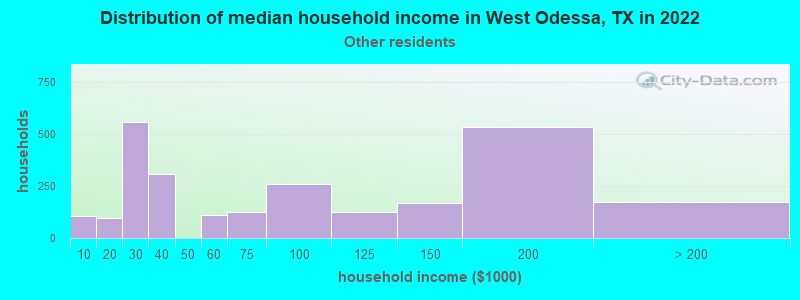
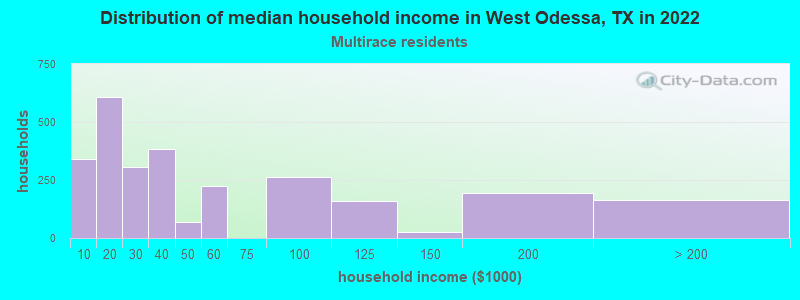
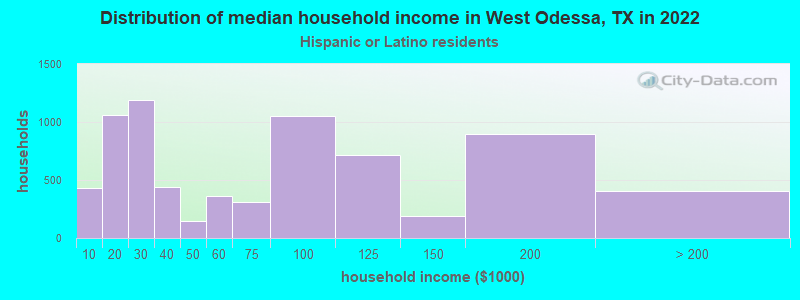
Income and house value in West Odessa Median household income in 2022 $62,066 White non-Hispanic householders$40,679 Two or more races householders$65,254 Hispanic or Latino race householdersMedian 2022 house value $212,525 White Non-Hispanic householders$192,637 Black or African American householders$175,479 American Indian or Alaska Native householders$148,962 Some other race householders$159,101 Two or more races householders$164,560 Hispanic or Latino householders
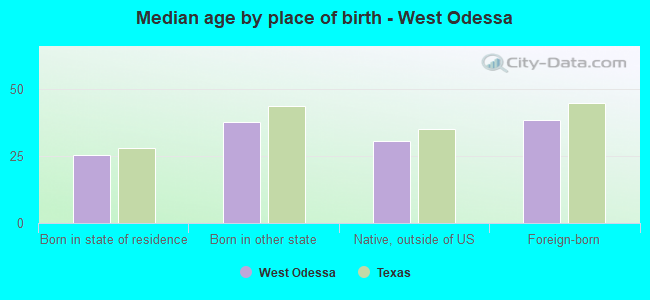
Median age by race in West Odessa
37.5 Median age for White residents35.8 38.1 24.2 Median age for Black or African American residents17.7 26.2 -939,704,208.4 Median age for American Indian / Alaska Native residents-1,090,119,434.3 -858,548,584.6 4.0 Median age for Asian residents-692,129,628.9 -682,068,206.1 -666,666,666.0 Median age for Native Hawaiian / Pacific Islander residents-666,666,666.0 -666,666,666.0 29.7 Median age for Other race residents31.8 21.9 35.0 Median age for Two or more races residents38.0 34.4 41.3 Median age for White alone residents43.9 38.6 30.5 Median age for Hispanic or Latino residents32.6 28.5
Owner/renter occupied households by race in West Odessa
House owners and renters - White residents 4,663 83.0% Owner occupied955 17.0% Renter occupiedHouse owners and renters - Black or African American residents 99 100.0% Renter occupiedHouse owners and renters - Asian residents 51 100.0% Renter occupiedHouse owners and renters - Other race residents 1,995 59.9% Owner occupied1,336 40.1% Renter occupiedHouse owners and renters - Two or more races residents 2,382 92.2% Owner occupied201 7.8% Renter occupiedHouse owners and renters - White alone residents 3,024 84.5% Owner occupied553 15.5% Renter occupiedHouse owners and renters - Hispanic or Latino residents 5,808 76.7% Owner occupied1,766 23.3% Renter occupied
Language usage in West Odessa
English speakers - Total 36.3% of residents of West Odessa speak English at home.
65.1% of residents speak Spanish at home 11,988 64.3% Speak English very well6,661 35.7% Speak English less than very well0.2% of residents speak other language at home 7 12.3% Speak English very well50 87.7% Speak English less than very well
English speakers - Born in the United States 57.7% of residents of West Odessa speak English at home.
36.7% of residents speak Spanish at home 1,412 72.2% Speak English very well545 27.8% Speak English less than very well1.3% of residents speak other language at home 7 10.3% Speak English very well61 89.7% Speak English less than very well
All residents speak only English at home
English speakers - Foreign-born 5.7% of residents of West Odessa speak English at home.
85.6% of residents speak Spanish at home 2,473 40.1% Speak English very well3,692 59.9% Speak English less than very well
White (Caucasian) - Speak only English Native:
69.0% (7,803)Foreign-born:
26.3% (388)
White (Caucasian) - Speak another language Native:
27.6% (3,123)Foreign-born:
81.5% (1,201)
Black or African American - Speak only English Native:
100.0% (527)Foreign-born:
90.7% (44)
Other race - Speak another language Native:
94.5% (5,751)Foreign-born:
100.0% (3,439)
Two or more races - Speak another language Native:
71.5% (1,821)Foreign-born:
96.3% (2,193)
White alone - Speak only English Native:
96.8% (7,239)Foreign-born:
100.0% (86)
Hispanic or Latino - Speak only English Native:
14.9% (1,907)Foreign-born:
3.8% (248)
Hispanic or Latino - Speak another language Native:
90.4% (11,612)Foreign-born:
95.0% (6,273)
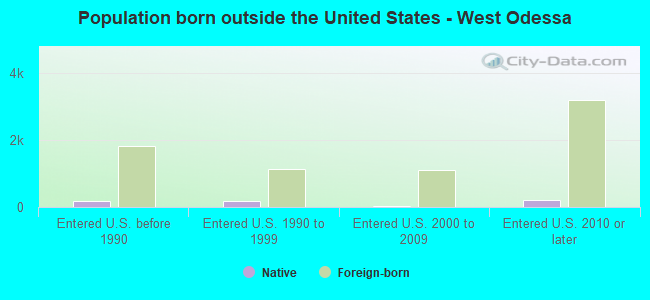
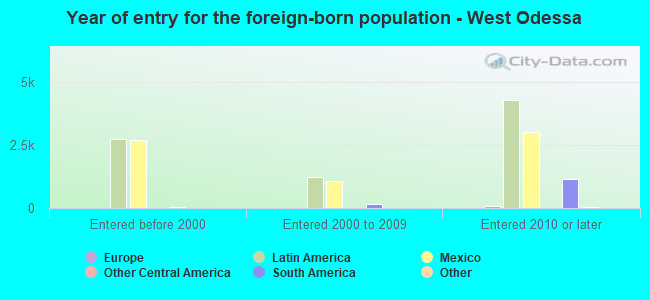
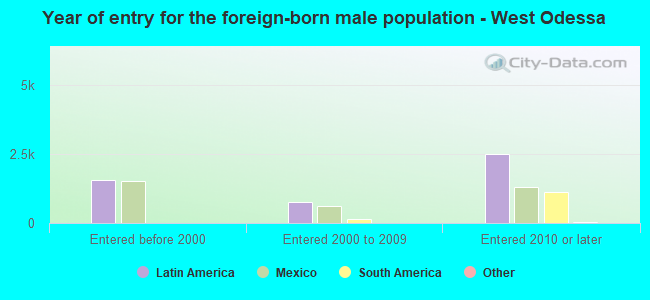
Foreign-born residents in West Odessa 7,878 residents are foreign born (24.3% Latin America ).
This city:
25.7%Texas:
17.1%
Marital status for residents in West Odessa Marital status - White (Caucasian) population 15 years and over
Males 26.7% Never married56.4% Now married1.2% Separated3.8% Widowed11.9% DivorcedFemales 28.7% Never married51.9% Now married1.1% Separated9.9% Widowed8.5% DivorcedWomen who gave birth in the past 12 months Now married:
100.0% (214)Unmarried:
0.0% (0)
Women who did not give birth in the past 12 months Now married:
46.0% (1,328)Unmarried:
54.0% (1,558)
Marital status - Black or African American population 15 years and over
Males 28.2% Never married71.8% Now married0.0% Separated0.0% Widowed0.0% DivorcedFemales 30.2% Never married67.9% Now married0.0% Separated0.0% Widowed1.9% DivorcedWomen who did not give birth in the past 12 months Now married:
67.9% (109)Unmarried:
32.1% (52)
Marital status - Other race population 15 years and over
Males 9.2% Never married85.6% Now married1.2% Separated0.0% Widowed4.0% DivorcedFemales 21.7% Never married59.8% Now married9.0% Separated2.2% Widowed7.3% DivorcedWomen who gave birth in the past 12 months Now married:
100.0% (568)Unmarried:
0.0% (0)
Women who did not give birth in the past 12 months Now married:
54.3% (1,256)Unmarried:
45.7% (1,055)
Marital status - Two or more races population 15 years and over
Males 18.9% Never married44.1% Now married8.8% Separated1.6% Widowed26.6% DivorcedFemales 28.4% Never married40.9% Now married0.8% Separated12.2% Widowed17.6% DivorcedWomen who gave birth in the past 12 months Now married:
0.0% (0)Unmarried:
100.0% (40)
Women who did not give birth in the past 12 months Now married:
55.0% (644)Unmarried:
45.0% (528)
Marital status - White alone, not Hispanic / Latino population 15 years and over
Males 22.4% Never married55.3% Now married2.7% Separated5.2% Widowed14.4% DivorcedFemales 31.9% Never married50.0% Now married0.0% Separated10.5% Widowed7.6% DivorcedWomen who gave birth in the past 12 months Now married:
100.0% (53)Unmarried:
0.0% (0)
Women who did not give birth in the past 12 months Now married:
35.4% (616)Unmarried:
64.6% (1,125)
Marital status - Hispanic or Latino population 15 years and over
Males 21.7% Never married63.9% Now married2.2% Separated1.6% Widowed10.4% DivorcedFemales 26.4% Never married52.6% Now married3.5% Separated6.9% Widowed10.6% DivorcedWomen who gave birth in the past 12 months Now married:
94.7% (574)Unmarried:
5.3% (32)
Women who did not give birth in the past 12 months Now married:
53.7% (2,477)Unmarried:
46.3% (2,138)
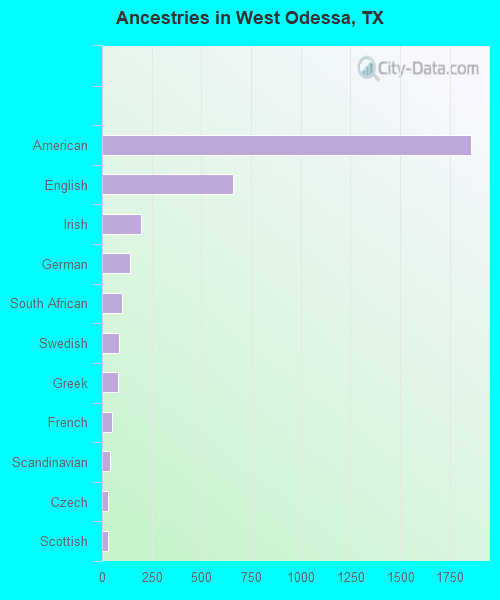
Ancestries in West Odessa
1,855 8.2% American657 2.9% English194 0.9% Irish141 0.6% German102 0.4% South African87 0.4% Swedish80 0.4% Greek49 0.2% French42 0.2% Scandinavian28 0.1% Czech28 0.1% Scottish14 0.06% Polish10 0.04% Scotch-Irish
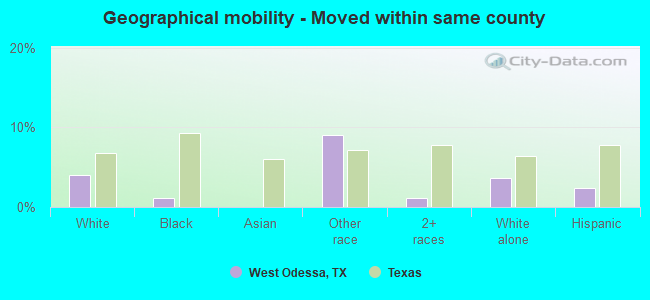
Geographical mobility in West Odessa Same house 1 year ago 13,596 100.0% White (Caucasian)55 9.5% Black or African American151 99.3% Asian6,788 88.7% Other race5,048 94.9% Two or more races8,140 100.0% White alone, not Hispanic / Latino20,921 100.0% Hispanic or LatinoMoved within same county 535 4.0% White / Caucasian6 1.1% Black or African American689 9.0% Other race62 1.2% Two or more races297 3.7% White alone, not Hispanic / Latino502 2.4% Hispanic or LatinoMoved within same state 316 2.3% White / Caucasian113 19.6% Black or African American122 1.6% Other race120 2.3% Two or more races221 2.7% White alone, not Hispanic / Latino207 1.0% Hispanic or LatinoMoved from different state 17 0.1% White / Caucasian496 86.2% Black or African American107 2.0% Two or more races17 0.2% White alone, not Hispanic / LatinoMoved from abroad 79 0.6% White13 0.2% White alone, not Hispanic / Latino173 0.8% Hispanic or Latino
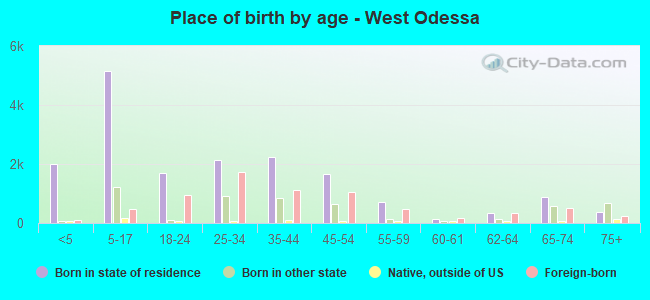
Children Nativity (place of birth) in West Odessa
Children under 6 years - Living with two parents Both parents native 803 100.0% NativeBoth parents foreign-born 125 100.0% NativeOne native, one foreign-born parent 290 73.1% Native107 26.9% Foreign-bornChildren under 6 years - Living with one parent Native parent 1,041 100.0% NativeForeign-born parent 295 100.0% NativeChildren 6 to 17 years - Living with two parents Both parents native 2,315 99.1% Native20 0.9% Foreign-bornBoth parents foreign-born 531 47.3% Native591 52.7% Foreign-bornOne native, one foreign-born parent 455 67.9% Native215 32.1% Foreign-bornChildren 6 to 17 years - Living with one parent Native parent 1,588 100.0% NativeForeign-born parent 403 63.8% Native228 36.2% Foreign-born
Grandparents responsible for own grandchildren in West Odessa
Grandparents (30 to 59 years) White / Caucasian 225 57.5% Responsible for grandchildren166 42.5% Not responsible for grandchildrenOther race 113 100.0% Not responsible for grandchildrenTwo or more races 590 97.0% Responsible for grandchildren18 3.0% Not responsible for grandchildrenWhite alone, not Hispanic / Latino 132 85.2% Responsible for grandchildren23 14.8% Not responsible for grandchildrenHispanic or Latino 226 37.8% Responsible for grandchildren372 62.2% Not responsible for grandchildrenGrandparents (60 years and over) White / Caucasian 18 22.9% Responsible for grandchildren60 77.1% Not responsible for grandchildrenOther race 17 100.0% Not responsible for grandchildrenWhite alone, not Hispanic / Latino 21 23.3% Responsible for grandchildren69 76.7% Not responsible for grandchildrenHispanic or Latino 40 100.0% Not responsible for grandchildren