Races in West Monroe, Louisiana (LA) Detailed Stats
Ancestries, Foreign-born residents, place of birth
Settings
X


Recent posts about races in West Monroe, Louisiana on our local forum with over 2,400,000 registered users:
 | West Monroe versus Monroe, LA (13 replies) |
| West Monroe oil fields (0 replies) |
| West Monroe (6 replies) |
| Miserable in Monroe... (79 replies) |
| west monroe, LA (34 replies) |
| so I've been in Monroe, LA for a year now... (41 replies) |
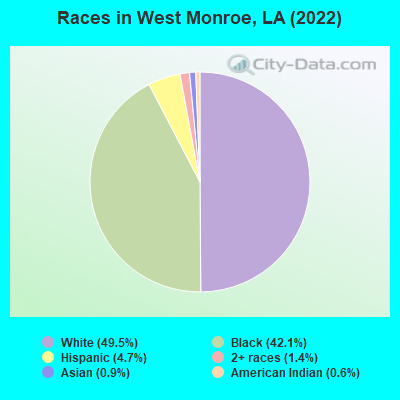
According to 2022 data, the most numerous races in West Monroe, LA are White alone (6,363 residents), Black alone (5,404 residents), and Hispanic (605 residents). 93.9% of West Monroe residents speak English at home. 2.7% of West Monroe, LA residents are foreign-born (2.0% born in Latin America, 0.4% born in Asia), which is 50.1% less than the foreign-born rate of 4.0% across the entire state of Louisiana.
Race distribution in West Monroe
2000
2022

- 9,75273.6%White alone
- 3,09623.4%Black alone
- 1961.5%Hispanic
- 1190.9%Two or more races
- 390.3%Asian alone
- 360.3%American Indian alone
- 60.05%Other race alone
- 60.05%Native Hawaiian and Other
Pacific Islander alone

-
- 6,36349.5%White alone
- 5,40442.1%Black alone
- 6054.7%Hispanic
- 1821.4%Two or more races
- 1160.9%Asian alone
- 760.6%American Indian alone
- 20.02%Native Hawaiian and Other
Pacific Islander alone
2000
2022
-
- 2,794,39162.5%White alone
- 1,443,39032.3%Black alone
- 107,7382.4%Hispanic
- 54,2561.2%Asian alone
- 39,2600.9%Two or more races
- 24,1290.5%American Indian alone
- 4,7360.1%Other race alone
- 1,0760.02%Native Hawaiian and Other
Pacific Islander alone

-
- 2,603,22156.7%White alone
- 1,420,05530.9%Black alone
- 262,2135.7%Hispanic
- 183,2704.0%Two or more races
- 81,1691.8%Asian alone
- 19,9910.4%American Indian alone
- 18,0430.4%Other race alone
- 2,2790.05%Native Hawaiian and Other
Pacific Islander alone

Income and house value in West Monroe
- Median household income in 2022
- $51,850White non-Hispanic householders
- $31,973Black householders
- $67,212Some other race householders
- $27,473Two or more races householders
- $85,968Hispanic or Latino race householders
- Median 2022 house value
- $181,560White Non-Hispanic householders
- $103,245Black or African American householders
- $382,171Some other race householders
- $176,386Two or more races householders
- $382,171Hispanic or Latino householders
Household income for White non-Hispanic householders

Household income for Black householders

Household income for American Indian and Alaska Native householders

Household income for Asian householders

Household income for Some other race householders

Household income for Two or more races householders

Household income for Hispanic or Latino race householders

Median age by race in West Monroe
- 48.5Median age for White residents
- 45.8Males
- 48.3Females
- 27.6Median age for Black or African American residents
- 25.1Males
- 27.6Females
- 53.7Median age for American Indian / Alaska Native residents
- 52.5Males
- 70.6Females
- 37.8Median age for Asian residents
- 39.3Males
- 35.0Females
- -821,138,210.6Median age for Native Hawaiian / Pacific Islander residents
- -666,666,666.0Males
- -666,666,666.0Females
- 40.6Median age for Other race residents
- 35.8Males
- 46.6Females
- 52.8Median age for Two or more races residents
- 45.1Males
- 54.1Females
- 48.0Median age for White alone residents
- 45.5Males
- 48.1Females
- 53.8Median age for Hispanic or Latino residents
- 48.4Males
- 87.2Females
Owner/renter occupied households by race in West Monroe
- House owners and renters - White residents
- 1,74354.8%Owner occupied
- 1,43945.2%Renter occupied
- House owners and renters - Black or African American residents
- 34518.0%Owner occupied
- 1,56582.0%Renter occupied
- House owners and renters - American Indian / Alaska Native residents
- 60100.0%Renter occupied
- House owners and renters - Asian residents
- 36100.0%Owner occupied
- House owners and renters - Other race residents
- 11428.9%Owner occupied
- 28171.1%Renter occupied
- House owners and renters - Two or more races residents
- 3233.0%Owner occupied
- 6567.0%Renter occupied
- House owners and renters - White alone residents
- 1,71954.5%Owner occupied
- 1,43545.5%Renter occupied
- House owners and renters - Hispanic or Latino residents
- 8219.1%Owner occupied
- 34980.9%Renter occupied
Language usage in West Monroe
- English speakers - Total
- 93.9% of residents of West Monroe speak English at home.
- 5.7% of residents speak Spanish at home
- 27339.5%Speak English very well
- 41860.5%Speak English less than very well
- 1.4% of residents speak other language at home
- 14080.9%Speak English very well
- 3319.1%Speak English less than very well
- English speakers - Born in the United States
- 94.7% of residents of West Monroe speak English at home.
- 4.7% of residents speak Spanish at home
- 10287.9%Speak English very well
- 1412.1%Speak English less than very well
- 0.3% of residents speak other language at home
- 787.5%Speak English very well
- 112.5%Speak English less than very well
- English speakers - Native, born elsewhere
- 24.5% of residents of West Monroe speak English at home.
- 29.6% of residents speak Spanish at home
- 2482.8%Speak English very well
- 517.2%Speak English less than very well
- 62.2% of residents speak other language at home
- 61100.0%Speak English very well
- English speakers - Foreign-born
- 9.1% of residents of West Monroe speak English at home.
- 89.3% of residents speak Spanish at home
- 256.5%Speak English very well
- 35793.5%Speak English less than very well
- 11.9% of residents speak other language at home
- 4282.4%Speak English very well
- 917.6%Speak English less than very well
White (Caucasian) - Speak only English
| Native: | 99.0% (5,996) |
| Foreign-born: | 87.0% (36) |
White (Caucasian) - Speak another language
| Native: | 1.3% (80) |
| Foreign-born: | 30.6% (13) |
Asian - Speak another language
| Native: | 100.0% (51) |
| Foreign-born: | 79.7% (49) |
Other race - Speak another language
| Native: | 68.9% (148) |
| Foreign-born: | 100.0% (145) |
Two or more races - Speak only English
| Native: | 92.3% (243) |
| Foreign-born: | 75.4% (9) |
White alone - Speak only English
| Native: | 98.8% (5,981) |
| Foreign-born: | 28.2% (8) |
White alone - Speak another language
| Native: | 1.3% (79) |
| Foreign-born: | 71.7% (21) |
Hispanic or Latino - Speak only English
| Native: | 45.5% (157) |
| Foreign-born: | 14.4% (34) |
Hispanic or Latino - Speak another language
| Native: | 50.3% (174) |
| Foreign-born: | 85.7% (205) |
Foreign-born residents in West Monroe
342 residents are foreign born (2.0% Latin America, 0.4% Asia).
| This city: | 2.7% |
| Louisiana: | 4.2% |


Marital status for residents in West Monroe
Marital status - White (Caucasian) population 15 years and over
- Males
- 34.2%Never married
- 43.9%Now married
- 2.4%Separated
- 0.8%Widowed
- 18.7%Divorced
- Females
- 22.4%Never married
- 40.8%Now married
- 1.0%Separated
- 12.5%Widowed
- 23.2%Divorced
Women who gave birth in the past 12 months
| Now married: | 42.2% (18) |
| Unmarried: | 57.8% (25) |
Women who did not give birth in the past 12 months
| Now married: | 36.1% (486) |
| Unmarried: | 63.9% (862) |
Marital status - Black or African American population 15 years and over
- Males
- 60.5%Never married
- 29.3%Now married
- 1.7%Separated
- 0.1%Widowed
- 8.3%Divorced
- Females
- 58.5%Never married
- 27.2%Now married
- 3.1%Separated
- 2.5%Widowed
- 8.7%Divorced
Women who gave birth in the past 12 months
| Now married: | 4.8% (7) |
| Unmarried: | 95.2% (135) |
Women who did not give birth in the past 12 months
| Now married: | 36.0% (518) |
| Unmarried: | 64.0% (921) |
Marital status - American Indian / Alaska Native population 15 years and over
- Males
- 100.0%Never married
- 0.0%Now married
- 0.0%Separated
- 0.0%Widowed
- 0.0%Divorced
- Females
- 39.2%Never married
- 7.8%Now married
- 52.9%Separated
- 0.0%Widowed
- 0.0%Divorced
Women who did not give birth in the past 12 months
| Now married: | 0.0% (0) |
| Unmarried: | 100.0% (17) |
Marital status - Asian population 15 years and over
- Males
- 30.0%Never married
- 70.0%Now married
- 0.0%Separated
- 0.0%Widowed
- 0.0%Divorced
- Females
- 0.0%Never married
- 100.0%Now married
- 0.0%Separated
- 0.0%Widowed
- 0.0%Divorced
Women who did not give birth in the past 12 months
| Now married: | 100.0% (31) |
| Unmarried: | 0.0% (0) |
Marital status - Other race population 15 years and over
- Males
- 68.8%Never married
- 13.0%Now married
- 0.0%Separated
- 14.7%Widowed
- 3.5%Divorced
- Females
- 71.1%Never married
- 28.9%Now married
- 0.0%Separated
- 0.0%Widowed
- 0.0%Divorced
Women who did not give birth in the past 12 months
| Now married: | 28.9% (28) |
| Unmarried: | 71.1% (68) |
Marital status - Two or more races population 15 years and over
- Males
- 48.6%Never married
- 0.0%Now married
- 0.0%Separated
- 22.9%Widowed
- 28.6%Divorced
- Females
- 57.6%Never married
- 5.8%Now married
- 1.4%Separated
- 13.7%Widowed
- 21.6%Divorced
Women who did not give birth in the past 12 months
| Now married: | 2.1% (3) |
| Unmarried: | 97.9% (128) |
Marital status - White alone, not Hispanic / Latino population 15 years and over
- Males
- 34.2%Never married
- 43.9%Now married
- 2.4%Separated
- 0.8%Widowed
- 18.7%Divorced
- Females
- 23.0%Never married
- 40.9%Now married
- 1.1%Separated
- 12.9%Widowed
- 22.1%Divorced
Women who gave birth in the past 12 months
| Now married: | 42.2% (19) |
| Unmarried: | 57.8% (25) |
Women who did not give birth in the past 12 months
| Now married: | 34.7% (465) |
| Unmarried: | 65.3% (874) |
Marital status - Hispanic or Latino population 15 years and over
- Males
- 77.0%Never married
- 9.7%Now married
- 0.0%Separated
- 10.7%Widowed
- 2.5%Divorced
- Females
- 49.1%Never married
- 27.7%Now married
- 0.0%Separated
- 0.0%Widowed
- 23.2%Divorced
Women who did not give birth in the past 12 months
| Now married: | 33.3% (56) |
| Unmarried: | 66.7% (112) |
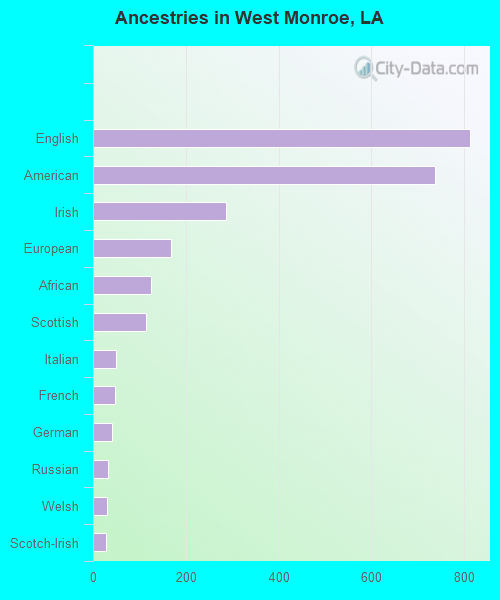
Ancestries in West Monroe

- 8139.3%English
- 7378.4%American
- 2873.3%Irish
- 1691.9%European
- 1251.4%African
- 1151.3%Scottish
- 500.6%Italian
- 480.5%French
- 410.5%German
- 330.4%Russian
- 300.3%Welsh
- 290.3%Scotch-Irish
- 70.08%British
- 60.07%Portuguese
- 30.03%French Canadian
Geographical mobility in West Monroe

- Same house 1 year ago
- 5,65487.2%White (Caucasian)
- 4,95595.5%Black or African American
- 13476.5%American Indian / Alaska Native
- 7564.3%Asian
- 2100.0%Native Hawaiian / Pacific Islander
- 35497.4%Other race
- 14453.6%Two or more races
- 5,59986.9%White alone, not Hispanic / Latino
- 54990.3%Hispanic or Latino

-
- Moved within same county
- 4126.4%White / Caucasian
- 1973.8%Black or African American
- 4639.8%Asian
- 8331.1%Two or more races
- 4216.5%White alone, not Hispanic / Latino
- 437.1%Hispanic or Latino

-
- Moved within same state
- 1842.8%White / Caucasian
- 160.3%Black or African American
- 3519.9%American Indian / Alaska Native
- 4115.1%Two or more races
- 1852.9%White alone, not Hispanic / Latino

-
- Moved from different state
- 701.1%White / Caucasian
- 450.9%Black or African American
- 681.1%White alone, not Hispanic / Latino

-
- Moved from abroad
- 631.0%White
- 105.6%American Indian / Alaska Native
- 631.0%White alone, not Hispanic / Latino
- 243.9%Hispanic or Latino

Children Nativity (place of birth) in West Monroe
Place of birth for residents in West Monroe
![Place of birth for the foreign-born population - Regions]()
- 259Americas
- 259Latin America
- 224Central America
- 50Asia
- 38Eastern Asia
- 34South America
- 30China
- 23Europe
- 23Eastern Europe
- 9Oceania
- 9Australia and New Zealand Subregion
- 6South Central Asia
- 6South Eastern Asia

![Place of birth for the foreign-born population - Countries]()
- 151Honduras
- 35Nicaragua
- 34Brazil
- 30China
- 28Mexico
- 23Russia
- 9New Zealand
- 8Korea
- 8Belize
- 6India
- 6Vietnam

Grandparents responsible for own grandchildren in West Monroe
Zip codes: 71291.