Races in The Woodlands, Texas (TX) Detailed Stats
Data:
Races - White alone (%)
Races - White alone (% change since 2000)
Races - Black alone (%)
Races - Black alone (% change since 2000)
Races - American Indian alone (%)
Races - American Indian alone (% change since 2000)
Races - Asian alone (%)
Races - Asian alone (% change since 2000)
Races - Hispanic (%)
Races - Hispanic (% change since 2000)
Races - Native Hawaiian and Other Pacific Islander alone (%)
Races - Native Hawaiian and Other Pacific Islander alone (% change since 2000)
Races - Two or more races(%)
Races - Two or more races(% change since 2000)
Races - Other race alone (%)
Races - Other race alone (% change since 2000)
Racial diversity
Place of birth - Born in state of residence (%)
Place of birth - Born in state of residence (%) - White
Place of birth - Born in state of residence (%) - Black or African American
Place of birth - Born in state of residence (%) - Asian
Place of birth - Born in state of residence (%) - Hispanic or Latino
Place of birth - Born in state of residence (%) - American Indian and Alaska Native
Place of birth - Born in state of residence (%) - Multirace
Place of birth - Born in state of residence (%) - Other Race
Place of birth - Born in other state (%)
Place of birth - Born in other state (%) - White
Place of birth - Born in other state (%) - Black or African American
Place of birth - Born in other state (%) - Asian
Place of birth - Born in other state (%) - Hispanic or Latino
Place of birth - Born in other state (%) - American Indian and Alaska Native
Place of birth - Born in other state (%) - Multirace
Place of birth - Born in other state (%) - Other Race
Place of birth - Native, outside of US (%)
Place of birth - Native, outside of US (%) - White
Place of birth - Native, outside of US (%) - Black or African American
Place of birth - Native, outside of US (%) - Asian
Place of birth - Native, outside of US (%) - Hispanic or Latino
Place of birth - Native, outside of US (%) - American Indian and Alaska Native
Place of birth - Native, outside of US (%) - Multirace
Place of birth - Native, outside of US (%) - Other Race
Place of birth - Foreign born (%)
Place of birth - Foreign born (%) - White
Place of birth - Foreign born (%) - Black or African American
Place of birth - Foreign born (%) - Asian
Place of birth - Foreign born (%) - Hispanic or Latino
Place of birth - Foreign born (%) - American Indian and Alaska Native
Place of birth - Foreign born (%) - Multirace
Place of birth - Foreign born (%) - Other Race
Residents speaking English at home (%)
Residents speaking English at home - Born in the United States (%)
Residents speaking English at home - Native, born elsewhere (%)
Residents speaking English at home - Foreign born (%)
Residents speaking Spanish at home (%)
Residents speaking Spanish at home - Born in the United States (%)
Residents speaking Spanish at home - Native, born elsewhere (%)
Residents speaking Spanish at home - Foreign born (%)
Residents speaking other language at home (%)
Residents speaking other language at home - Born in the United States (%)
Residents speaking other language at home - Native, born elsewhere (%)
Residents speaking other language at home - Foreign born (%)
Marital status - Never married (%)
Marital status - Now married (%)
Marital status - Separated (%)
Marital status - Widowed (%)
Marital status - Divorced (%)
Ancestries Reported - Arab (%)
Ancestries Reported - Czech (%)
Ancestries Reported - Danish (%)
Ancestries Reported - Dutch (%)
Ancestries Reported - English (%)
Ancestries Reported - French (%)
Ancestries Reported - French Canadian (%)
Ancestries Reported - German (%)
Ancestries Reported - Greek (%)
Ancestries Reported - Hungarian (%)
Ancestries Reported - Irish (%)
Ancestries Reported - Italian (%)
Ancestries Reported - Lithuanian (%)
Ancestries Reported - Norwegian (%)
Ancestries Reported - Polish (%)
Ancestries Reported - Portuguese (%)
Ancestries Reported - Russian (%)
Ancestries Reported - Scotch-Irish (%)
Ancestries Reported - Scottish (%)
Ancestries Reported - Slovak (%)
Ancestries Reported - Subsaharan African (%)
Ancestries Reported - Swedish (%)
Ancestries Reported - Swiss (%)
Ancestries Reported - Ukrainian (%)
Ancestries Reported - United States (%)
Ancestries Reported - Welsh (%)
Ancestries Reported - West Indian (%)
Ancestries Reported - Other (%)
Geographical mobility - Same house 1 year ago (%)
Geographical mobility - Same house 1 year ago (%) - White
Geographical mobility - Same house 1 year ago (%) - Black or African American
Geographical mobility - Same house 1 year ago (%) - Asian
Geographical mobility - Same house 1 year ago (%) - Hispanic or Latino
Geographical mobility - Same house 1 year ago (%) - American Indian and Alaska Native
Geographical mobility - Same house 1 year ago (%) - Multirace
Geographical mobility - Same house 1 year ago (%) - Other Race
Geographical mobility - Moved within same county (%)
Geographical mobility - Moved within same county (%) - White
Geographical mobility - Moved within same county (%) - Black or African American
Geographical mobility - Moved within same county (%) - Asian
Geographical mobility - Moved within same county (%) - Hispanic or Latino
Geographical mobility - Moved within same county (%) - American Indian and Alaska Native
Geographical mobility - Moved within same county (%) - Multirace
Geographical mobility - Moved within same county (%) - Other Race
Geographical mobility - Moved from different county within same state (%)
Geographical mobility - Moved from different county within same state (%) - White
Geographical mobility - Moved from different county within same state (%) - Black or African American
Geographical mobility - Moved from different county within same state (%) - Asian
Geographical mobility - Moved from different county within same state (%) - Hispanic or Latino
Geographical mobility - Moved from different county within same state (%) - American Indian and Alaska Native
Geographical mobility - Moved from different county within same state (%) - Multirace
Geographical mobility - Moved from different county within same state (%) - Other Race
Geographical mobility - Moved from different state (%)
Geographical mobility - Moved from different state (%) - White
Geographical mobility - Moved from different state (%) - Black or African American
Geographical mobility - Moved from different state (%) - Asian
Geographical mobility - Moved from different state (%) - Hispanic or Latino
Geographical mobility - Moved from different state (%) - American Indian and Alaska Native
Geographical mobility - Moved from different state (%) - Multirace
Geographical mobility - Moved from different state (%) - Other Race
Geographical mobility - Moved from abroad (%)
Geographical mobility - Moved from abroad (%) - White
Geographical mobility - Moved from abroad (%) - Black or African American
Geographical mobility - Moved from abroad (%) - Asian
Geographical mobility - Moved from abroad (%) - Hispanic or Latino
Geographical mobility - Moved from abroad (%) - American Indian and Alaska Native
Geographical mobility - Moved from abroad (%) - Multirace
Geographical mobility - Moved from abroad (%) - Other Race
Place of birth for the foreign-born population - Ireland (%)
Place of birth for the foreign-born population - Denmark (%)
Place of birth for the foreign-born population - Norway (%)
Place of birth for the foreign-born population - Sweden (%)
Place of birth for the foreign-born population - United Kingdom (%)
Place of birth for the foreign-born population - England (%)
Place of birth for the foreign-born population - Scotland (%)
Place of birth for the foreign-born population - Other Northern Europe (%)
Place of birth for the foreign-born population - Austria (%)
Place of birth for the foreign-born population - Belgium (%)
Place of birth for the foreign-born population - France (%)
Place of birth for the foreign-born population - Germany (%)
Place of birth for the foreign-born population - Netherlands (%)
Place of birth for the foreign-born population - Switzerland (%)
Place of birth for the foreign-born population - Other Western Europe (%)
Place of birth for the foreign-born population - Greece (%)
Place of birth for the foreign-born population - Italy (%)
Place of birth for the foreign-born population - Portugal (%)
Place of birth for the foreign-born population - Spain (%)
Place of birth for the foreign-born population - Other Southern Europe (%)
Place of birth for the foreign-born population - Albania (%)
Place of birth for the foreign-born population - Belarus (%)
Place of birth for the foreign-born population - Bosnia and Herzegovina (%)
Place of birth for the foreign-born population - Bulgaria (%)
Place of birth for the foreign-born population - Croatia (%)
Place of birth for the foreign-born population - Czechoslovakia (%)
Place of birth for the foreign-born population - Hungary (%)
Place of birth for the foreign-born population - Latvia (%)
Place of birth for the foreign-born population - Lithuania (%)
Place of birth for the foreign-born population - North Macedonia (Macedonia) (%)
Place of birth for the foreign-born population - Moldova (%)
Place of birth for the foreign-born population - Poland (%)
Place of birth for the foreign-born population - Romania (%)
Place of birth for the foreign-born population - Russia (%)
Place of birth for the foreign-born population - Serbia (%)
Place of birth for the foreign-born population - Ukraine (%)
Place of birth for the foreign-born population - Other Eastern Europe (%)
Place of birth for the foreign-born population - China (%)
Place of birth for the foreign-born population - Hong Kong (%)
Place of birth for the foreign-born population - Taiwan (%)
Place of birth for the foreign-born population - Japan (%)
Place of birth for the foreign-born population - Korea (%)
Place of birth for the foreign-born population - Other Eastern Asia (%)
Place of birth for the foreign-born population - Afghanistan (%)
Place of birth for the foreign-born population - Bangladesh (%)
Place of birth for the foreign-born population - India (%)
Place of birth for the foreign-born population - Iran (%)
Place of birth for the foreign-born population - Kazakhstan (%)
Place of birth for the foreign-born population - Nepal (%)
Place of birth for the foreign-born population - Pakistan (%)
Place of birth for the foreign-born population - Sri Lanka (%)
Place of birth for the foreign-born population - Uzbekistan (%)
Place of birth for the foreign-born population - Other South Central Asia (%)
Place of birth for the foreign-born population - Burma (%)
Place of birth for the foreign-born population - Cambodia (%)
Place of birth for the foreign-born population - Indonesia (%)
Place of birth for the foreign-born population - Laos (%)
Place of birth for the foreign-born population - Malaysia (%)
Place of birth for the foreign-born population - Philippines (%)
Place of birth for the foreign-born population - Singapore (%)
Place of birth for the foreign-born population - Thailand (%)
Place of birth for the foreign-born population - Vietnam (%)
Place of birth for the foreign-born population - Other South Eastern Asia (%)
Place of birth for the foreign-born population - Armenia (%)
Place of birth for the foreign-born population - Iraq (%)
Place of birth for the foreign-born population - Israel (%)
Place of birth for the foreign-born population - Jordan (%)
Place of birth for the foreign-born population - Kuwait (%)
Place of birth for the foreign-born population - Lebanon (%)
Place of birth for the foreign-born population - Saudi Arabia (%)
Place of birth for the foreign-born population - Syria (%)
Place of birth for the foreign-born population - Turkey (%)
Place of birth for the foreign-born population - Yemen (%)
Place of birth for the foreign-born population - Other Western Asia (%)
Place of birth for the foreign-born population - Eritrea (%)
Place of birth for the foreign-born population - Ethiopia (%)
Place of birth for the foreign-born population - Kenya (%)
Place of birth for the foreign-born population - Somalia (%)
Place of birth for the foreign-born population - Uganda (%)
Place of birth for the foreign-born population - Zimbabwe (%)
Place of birth for the foreign-born population - Other Eastern Africa (%)
Place of birth for the foreign-born population - Cameroon (%)
Place of birth for the foreign-born population - Congo (%)
Place of birth for the foreign-born population - Democratic Republic of Congo (Zaire) (%)
Place of birth for the foreign-born population - Other Middle Africa (%)
Place of birth for the foreign-born population - Egypt (%)
Place of birth for the foreign-born population - Morocco (%)
Place of birth for the foreign-born population - Sudan (%)
Place of birth for the foreign-born population - Other Northern Africa (%)
Place of birth for the foreign-born population - South Africa (%)
Place of birth for the foreign-born population - Other Southern Africa (%)
Place of birth for the foreign-born population - Cabo Verde (%)
Place of birth for the foreign-born population - Ghana (%)
Place of birth for the foreign-born population - Liberia (%)
Place of birth for the foreign-born population - Nigeria (%)
Place of birth for the foreign-born population - Senegal (%)
Place of birth for the foreign-born population - Sierra Leone (%)
Place of birth for the foreign-born population - Other Western Africa (%)
Place of birth for the foreign-born population - Australia (%)
Place of birth for the foreign-born population - New Zealand (%)
Place of birth for the foreign-born population - Fiji (%)
Place of birth for the foreign-born population - Micronesia (%)
Place of birth for the foreign-born population - Bahamas (%)
Place of birth for the foreign-born population - Barbados (%)
Place of birth for the foreign-born population - Cuba (%)
Place of birth for the foreign-born population - Dominica (%)
Place of birth for the foreign-born population - Dominican Republic (%)
Place of birth for the foreign-born population - Grenada (%)
Place of birth for the foreign-born population - Haiti (%)
Place of birth for the foreign-born population - Jamaica (%)
Place of birth for the foreign-born population - St. Vincent and the Grenadines (%)
Place of birth for the foreign-born population - Trinidad and Tobago (%)
Place of birth for the foreign-born population - West Indies (%)
Place of birth for the foreign-born population - Other Caribbean (%)
Place of birth for the foreign-born population - Belize (%)
Place of birth for the foreign-born population - Costa Rica (%)
Place of birth for the foreign-born population - El Salvador (%)
Place of birth for the foreign-born population - Guatemala (%)
Place of birth for the foreign-born population - Honduras (%)
Place of birth for the foreign-born population - Mexico (%)
Place of birth for the foreign-born population - Nicaragua (%)
Place of birth for the foreign-born population - Panama (%)
Place of birth for the foreign-born population - Other Central America (%)
Place of birth for the foreign-born population - Argentina (%)
Place of birth for the foreign-born population - Bolivia (%)
Place of birth for the foreign-born population - Brazil (%)
Place of birth for the foreign-born population - Chile (%)
Place of birth for the foreign-born population - Colombia (%)
Place of birth for the foreign-born population - Ecuador (%)
Place of birth for the foreign-born population - Guyana (%)
Place of birth for the foreign-born population - Peru (%)
Place of birth for the foreign-born population - Uruguay (%)
Place of birth for the foreign-born population - Venezuela (%)
Place of birth for the foreign-born population - Other South America (%)
Place of birth for the foreign-born population - Canada (%)
Place of birth for the foreign-born population - Other Northern America (%)
Place of birth for the foreign-born population - Other (%)
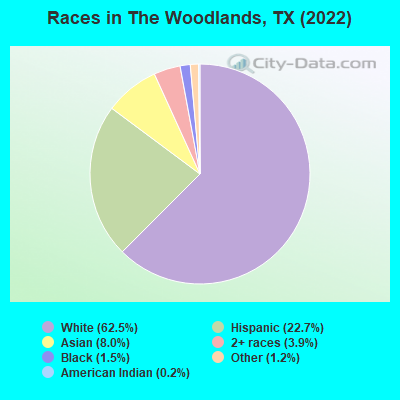
According to 2022 data, the most numerous races in The Woodlands, TX are Hispanic (26,769 residents), White alone (73,678 residents), and Black alone (1,716 residents). 71.7% of The Woodlands residents speak English at home. 19.5% of The Woodlands, TX residents are foreign-born (8.9% born in Latin America, 5.2% born in Asia, 3.4% born in Europe), which is 12.9% greater than the foreign-born rate of 17.0% across the entire state of Texas.
Race distribution in The Woodlands
2000 2022
10,933,313 52.4% White alone 6,669,666 32.0% Hispanic 2,364,255 11.3% Black alone 554,445 2.7% Asian alone 230,567 1.1% Two or more races 68,859 0.3% American Indian alone 19,958 0.10% Other race alone 10,757 0.05% Native Hawaiian and Other
12,070,642 40.2% Hispanic 11,683,430 38.9% White alone 3,508,706 11.7% Black alone 1,608,173 5.4% Asian alone 956,560 3.2% Two or more races 125,763 0.4% Other race alone 47,023 0.2% American Indian alone 29,275 0.10% Native Hawaiian and Other
Income and house value in The Woodlands Median household income in 2022 $143,866 White non-Hispanic householders$74,586 Black householders$106,563 Asian householders$129,436 Some other race householders$137,987 Two or more races householders$157,537 Hispanic or Latino race householdersMedian 2022 house value $464,904 White Non-Hispanic householders$555,423 Black or African American householders$351,139 American Indian or Alaska Native householders $481,586 Asian householders$376,025 Native Hawaiian and other Pacific Islander householders$292,889 Some other race householders$386,417 Two or more races householders$382,862 Hispanic or Latino householders
Median age by race in The Woodlands
45.3 Median age for White residents44.4 47.9 41.8 Median age for Black or African American residents24.5 62.2 29.1 Median age for American Indian / Alaska Native residents22.0 -666,666,666.0 38.7 Median age for Asian residents38.3 41.0 -666,666,666.0 Median age for Native Hawaiian / Pacific Islander residents-666,666,666.0 -666,666,666.0 29.9 Median age for Other race residents16.7 30.8 37.3 Median age for Two or more races residents36.0 40.1 46.1 Median age for White alone residents44.7 48.5 37.1 Median age for Hispanic or Latino residents35.7 40.3
Owner/renter occupied households by race in The Woodlands
House owners and renters - White residents 24,758 76.3% Owner occupied7,669 23.7% Renter occupiedHouse owners and renters - Black or African American residents 282 26.6% Owner occupied778 73.4% Renter occupiedHouse owners and renters - American Indian / Alaska Native residents 80 95.1% Owner occupied4 4.9% Renter occupiedHouse owners and renters - Asian residents 2,280 63.8% Owner occupied1,292 36.2% Renter occupiedHouse owners and renters - Native Hawaiian / Pacific Islander residents 6 100.0% Owner occupiedHouse owners and renters - Other race residents 1,124 77.7% Owner occupied323 22.3% Renter occupiedHouse owners and renters - Two or more races residents 4,659 63.7% Owner occupied2,660 36.3% Renter occupiedHouse owners and renters - White alone residents 23,828 76.0% Owner occupied7,517 24.0% Renter occupiedHouse owners and renters - Hispanic or Latino residents 6,039 76.8% Owner occupied1,828 23.2% Renter occupied
Language usage in The Woodlands
English speakers - Total 71.7% of residents of The Woodlands speak English at home.
18.4% of residents speak Spanish at home 15,715 74.7% Speak English very well5,319 25.3% Speak English less than very well9.9% of residents speak other language at home 7,150 63.0% Speak English very well4,206 37.0% Speak English less than very well
English speakers - Born in the United States 94.3% of residents of The Woodlands speak English at home.
3.5% of residents speak Spanish at home 1,347 93.5% Speak English very well94 6.5% Speak English less than very well2.2% of residents speak other language at home 779 83.9% Speak English very well149 16.1% Speak English less than very well
English speakers - Native, born elsewhere 56.8% of residents of The Woodlands speak English at home.
35.2% of residents speak Spanish at home 792 86.6% Speak English very well123 13.4% Speak English less than very well8.0% of residents speak other language at home 161 77.4% Speak English very well47 22.6% Speak English less than very well
English speakers - Foreign-born 17.8% of residents of The Woodlands speak English at home.
51.5% of residents speak Spanish at home 11,367 71.3% Speak English very well4,567 28.7% Speak English less than very well30.7% of residents speak other language at home 5,691 59.9% Speak English very well3,813 40.1% Speak English less than very well
White (Caucasian) - Speak only English Native:
97.2% (65,829)Foreign-born:
40.5% (4,210)
White (Caucasian) - Speak another language Native:
2.8% (1,880)Foreign-born:
59.5% (6,175)
Black or African American - Speak only English Native:
92.8% (3,106)Foreign-born:
63.2% (326)
Black or African American - Speak another language Native:
7.2% (241)Foreign-born:
31.9% (165)
American Indian / Alaska Native - Speak another language Native:
41.8% (84)Foreign-born:
98.9% (29)
Asian - Speak only English Native:
53.6% (1,155)Foreign-born:
14.3% (1,013)
Asian - Speak another language Native:
46.4% (999)Foreign-born:
85.7% (6,068)
Other race - Speak only English Native:
82.1% (2,368)Foreign-born:
5.3% (113)
Other race - Speak another language Native:
17.9% (518)Foreign-born:
94.7% (2,029)
Two or more races - Speak only English Native:
61.4% (5,019)Foreign-born:
1.6% (185)
Two or more races - Speak another language Native:
38.6% (3,160)Foreign-born:
98.4% (11,118)
White alone - Speak only English Native:
98.2% (64,828)Foreign-born:
57.5% (3,218)
White alone - Speak another language Native:
1.8% (1,181)Foreign-born:
42.5% (2,378)
Hispanic or Latino - Speak only English Native:
49.0% (4,117)Foreign-born:
7.0% (1,239)
Hispanic or Latino - Speak another language Native:
51.0% (4,286)Foreign-born:
93.0% (16,391)
Foreign-born residents in The Woodlands 24,882 residents are foreign born (8.9% Latin America , 5.2% Asia , 3.4% Europe ).
This city:
19.5%Texas:
17.1%
Marital status for residents in The Woodlands Marital status - White (Caucasian) population 15 years and over
Males 21.5% Never married71.3% Now married1.6% Separated1.2% Widowed4.4% DivorcedFemales 19.7% Never married59.2% Now married1.1% Separated8.5% Widowed11.5% DivorcedWomen who gave birth in the past 12 months Now married:
100.0% (517)Unmarried:
0.0% (0)
Women who did not give birth in the past 12 months Now married:
53.2% (8,175)Unmarried:
46.8% (7,204)
Marital status - Black or African American population 15 years and over
Males 37.3% Never married55.2% Now married0.6% Separated0.0% Widowed6.9% DivorcedFemales 43.9% Never married40.7% Now married0.5% Separated5.1% Widowed9.9% DivorcedWomen who did not give birth in the past 12 months Now married:
35.1% (482)Unmarried:
64.9% (890)
Marital status - American Indian / Alaska Native population 15 years and over
Males 50.0% Never married50.0% Now married0.0% Separated0.0% Widowed0.0% DivorcedFemales 0.0% Never married100.0% Now married0.0% Separated0.0% Widowed0.0% DivorcedWomen who did not give birth in the past 12 months Now married:
100.0% (16)Unmarried:
0.0% (0)
Marital status - Asian population 15 years and over
Males 28.1% Never married69.8% Now married0.0% Separated0.0% Widowed2.2% DivorcedFemales 21.6% Never married72.1% Now married0.3% Separated2.1% Widowed3.9% DivorcedWomen who gave birth in the past 12 months Now married:
100.0% (251)Unmarried:
0.0% (0)
Women who did not give birth in the past 12 months Now married:
58.2% (1,171)Unmarried:
41.8% (842)
Marital status - Other race population 15 years and over
Males 31.8% Never married59.9% Now married0.0% Separated1.5% Widowed6.9% DivorcedFemales 26.9% Never married46.5% Now married0.0% Separated5.5% Widowed21.1% DivorcedWomen who gave birth in the past 12 months Now married:
0.0% (0)Unmarried:
100.0% (8)
Women who did not give birth in the past 12 months Now married:
46.3% (608)Unmarried:
53.7% (705)
Marital status - Two or more races population 15 years and over
Males 28.9% Never married65.0% Now married1.0% Separated0.7% Widowed4.5% DivorcedFemales 34.9% Never married57.0% Now married0.5% Separated3.0% Widowed4.6% DivorcedWomen who gave birth in the past 12 months Now married:
100.0% (221)Unmarried:
0.0% (0)
Women who did not give birth in the past 12 months Now married:
56.3% (2,981)Unmarried:
43.7% (2,312)
Marital status - White alone, not Hispanic / Latino population 15 years and over
Males 22.2% Never married71.1% Now married1.7% Separated1.3% Widowed3.7% DivorcedFemales 17.6% Never married60.3% Now married1.2% Separated8.9% Widowed12.0% DivorcedWomen who gave birth in the past 12 months Now married:
100.0% (517)Unmarried:
0.0% (0)
Women who did not give birth in the past 12 months Now married:
53.0% (7,322)Unmarried:
47.0% (6,500)
Marital status - Hispanic or Latino population 15 years and over
Males 24.2% Never married67.6% Now married0.8% Separated0.6% Widowed6.8% DivorcedFemales 34.5% Never married56.5% Now married0.0% Separated4.3% Widowed4.7% DivorcedWomen who gave birth in the past 12 months Now married:
88.7% (495)Unmarried:
11.3% (63)
Women who did not give birth in the past 12 months Now married:
55.1% (4,353)Unmarried:
44.9% (3,552)
Ancestries in The Woodlands
6,353 11.4% English4,614 8.3% German4,266 7.6% American3,208 5.7% Irish1,830 3.3% European1,400 2.5% Italian1,326 2.4% Scottish924 1.7% French704 1.3% Portuguese654 1.2% Canadian621 1.1% Scotch-Irish542 1.0% Turkish514 0.9% Polish479 0.9% British408 0.7% Russian378 0.7% Swedish378 0.7% Lithuanian365 0.7% Dutch339 0.6% Ukrainian321 0.6% Norwegian272 0.5% Brazilian233 0.4% Welsh222 0.4% French Canadian203 0.4% Austrian180 0.3% Nigerian177 0.3% Scandinavian171 0.3% Iranian166 0.3% Eastern European164 0.3% Lebanese149 0.3% Hungarian148 0.3% Czech129 0.2% Slovene112 0.2% Croatian104 0.2% Arab97 0.2% Kenyan91 0.2% Greek88 0.2% Slavic84 0.2% African82 0.1% South African80 0.1% Belgian75 0.1% Danish74 0.1% Australian61 0.1% Jamaican58 0.1% Maltese57 0.1% Palestinian54 0.10% Slovak54 0.10% Swiss50 0.09% Cajun46 0.08% Northern European34 0.06% Serbian34 0.06% Israeli25 0.04% Albanian23 0.04% Finnish20 0.04% Armenian15 0.03% Bulgarian12 0.02% Jordanian9 0.02% Syrian9 0.02% Luxembourger7 0.01% Egyptian7 0.01% Belizean4 0.01% Czechoslovakian
Geographical mobility in The Woodlands Same house 1 year ago 70,081 87.9% White (Caucasian)3,844 84.0% Black or African American258 100.0% American Indian / Alaska Native6,283 69.1% Asian14 98.2% Native Hawaiian / Pacific Islander3,588 66.8% Other race15,644 78.1% Two or more races64,250 87.9% White alone, not Hispanic / Latino21,295 79.9% Hispanic or LatinoMoved within same county 4,613 5.8% White / Caucasian101 2.2% Black or African American292 3.2% Asian62 1.2% Other race1,120 5.6% Two or more races4,530 6.2% White alone, not Hispanic / Latino1,207 4.5% Hispanic or LatinoMoved within same state 1,797 2.3% White / Caucasian319 7.0% Black or African American970 10.7% Asian1,026 19.1% Other race713 3.6% Two or more races1,797 2.5% White alone, not Hispanic / Latino1,464 5.5% Hispanic or LatinoMoved from different state 2,077 2.6% White / Caucasian90 2.0% Black or African American1,084 11.9% Asian623 11.6% Other race1,453 7.3% Two or more races1,912 2.6% White alone, not Hispanic / Latino1,473 5.5% Hispanic or LatinoMoved from abroad 1,176 1.5% White84 1.8% Black or African American834 9.2% Asian75 1.4% Other race1,109 5.5% Two or more races633 0.9% White alone, not Hispanic / Latino1,205 4.5% Hispanic or Latino
Children Nativity (place of birth) in The Woodlands
Children under 6 years - Living with two parents Both parents native 2,668 100.0% NativeBoth parents foreign-born 823 43.3% Native1,078 56.7% Foreign-bornOne native, one foreign-born parent 638 100.0% NativeChildren under 6 years - Living with one parent Native parent 333 100.0% NativeChildren 6 to 17 years - Living with two parents Both parents native 12,449 100.0% NativeBoth parents foreign-born 1,531 20.5% Native5,947 79.5% Foreign-bornOne native, one foreign-born parent 1,106 100.0% NativeChildren 6 to 17 years - Living with one parent Native parent 1,328 92.0% Native116 8.0% Foreign-bornForeign-born parent 902 69.7% Native393 30.3% Foreign-born
Place of birth for residents in The Woodlands 13,038 Americas10,970 Latin America6,532 Central America6,421 Asia4,139 Europe3,937 South America2,113 Northern Europe2,094 South Central Asia2,067 Northern America2,032 Eastern Asia1,832 China1,543 South Eastern Asia1,062 Eastern Europe758 Africa751 Western Asia610 Western Europe525 Oceania516 Australia and New Zealand Subregion501 Caribbean353 Southern Europe283 Southern Africa241 Eastern Africa166 Western Africa54 Northern Africa11 Middle Africa5,445 Mexico2,067 Canada1,566 China1,514 India1,162 United Kingdom1,162 Venezuela975 Argentina719 Colombia596 Vietnam586 England516 Australia431 Russia415 Turkey378 El Salvador290 Pakistan283 South Africa282 Peru266 Guatemala257 Philippines243 Chile235 Scotland223 Malaysia222 Ecuador222 Cuba218 Ukraine210 Germany189 Honduras179 Brazil176 Spain170 Iran165 Singapore153 Netherlands149 Indonesia148 Hong Kong131 Thailand127 Uruguay121 Norway117 Belarus117 Taiwan117 Trinidad and Tobago112 Costa Rica109 Italy109 Japan93 Switzerland93 Dominican Republic90 Korea88 Sri Lanka82 France81 Senegal77 Panama76 Lebanon74 Yemen74 Kenya70 Belgium70 Hungary68 Jamaica63 Tanzania62 Ethiopia61 Czechoslovakia54 Nigeria53 Greece41 Zimbabwe36 Azerbaijan36 Egypt33 Moldova32 Belize32 Serbia30 Ghana29 Nicaragua24 Poland19 Kazakhstan19 Albania18 Syria15 Israel14 Guyana13 Portugal11 Laos10 Bulgaria9 Bolivia7 Denmark7 Burma (Myanmar)
Grandparents responsible for own grandchildren in The Woodlands
Grandparents (30 to 59 years) White / Caucasian 307 100.0% Not responsible for grandchildrenTwo or more races 106 100.0% Not responsible for grandchildrenWhite alone, not Hispanic / Latino 380 100.0% Not responsible for grandchildrenHispanic or Latino 77 100.0% Not responsible for grandchildrenGrandparents (60 years and over) White / Caucasian 81 18.7% Responsible for grandchildren355 81.3% Not responsible for grandchildrenTwo or more races 115 100.0% Not responsible for grandchildrenWhite alone, not Hispanic / Latino 38 10.5% Responsible for grandchildren327 89.5% Not responsible for grandchildrenHispanic or Latino 45 22.2% Responsible for grandchildren158 77.8% Not responsible for grandchildren