Races in Temple, Texas (TX) Detailed Stats
Data:
Races - White alone (%)
Races - White alone (% change since 2000)
Races - Black alone (%)
Races - Black alone (% change since 2000)
Races - American Indian alone (%)
Races - American Indian alone (% change since 2000)
Races - Asian alone (%)
Races - Asian alone (% change since 2000)
Races - Hispanic (%)
Races - Hispanic (% change since 2000)
Races - Native Hawaiian and Other Pacific Islander alone (%)
Races - Native Hawaiian and Other Pacific Islander alone (% change since 2000)
Races - Two or more races(%)
Races - Two or more races(% change since 2000)
Races - Other race alone (%)
Races - Other race alone (% change since 2000)
Racial diversity
Place of birth - Born in state of residence (%)
Place of birth - Born in state of residence (%) - White
Place of birth - Born in state of residence (%) - Black or African American
Place of birth - Born in state of residence (%) - Asian
Place of birth - Born in state of residence (%) - Hispanic or Latino
Place of birth - Born in state of residence (%) - American Indian and Alaska Native
Place of birth - Born in state of residence (%) - Multirace
Place of birth - Born in state of residence (%) - Other Race
Place of birth - Born in other state (%)
Place of birth - Born in other state (%) - White
Place of birth - Born in other state (%) - Black or African American
Place of birth - Born in other state (%) - Asian
Place of birth - Born in other state (%) - Hispanic or Latino
Place of birth - Born in other state (%) - American Indian and Alaska Native
Place of birth - Born in other state (%) - Multirace
Place of birth - Born in other state (%) - Other Race
Place of birth - Native, outside of US (%)
Place of birth - Native, outside of US (%) - White
Place of birth - Native, outside of US (%) - Black or African American
Place of birth - Native, outside of US (%) - Asian
Place of birth - Native, outside of US (%) - Hispanic or Latino
Place of birth - Native, outside of US (%) - American Indian and Alaska Native
Place of birth - Native, outside of US (%) - Multirace
Place of birth - Native, outside of US (%) - Other Race
Place of birth - Foreign born (%)
Place of birth - Foreign born (%) - White
Place of birth - Foreign born (%) - Black or African American
Place of birth - Foreign born (%) - Asian
Place of birth - Foreign born (%) - Hispanic or Latino
Place of birth - Foreign born (%) - American Indian and Alaska Native
Place of birth - Foreign born (%) - Multirace
Place of birth - Foreign born (%) - Other Race
Residents speaking English at home (%)
Residents speaking English at home - Born in the United States (%)
Residents speaking English at home - Native, born elsewhere (%)
Residents speaking English at home - Foreign born (%)
Residents speaking Spanish at home (%)
Residents speaking Spanish at home - Born in the United States (%)
Residents speaking Spanish at home - Native, born elsewhere (%)
Residents speaking Spanish at home - Foreign born (%)
Residents speaking other language at home (%)
Residents speaking other language at home - Born in the United States (%)
Residents speaking other language at home - Native, born elsewhere (%)
Residents speaking other language at home - Foreign born (%)
Marital status - Never married (%)
Marital status - Now married (%)
Marital status - Separated (%)
Marital status - Widowed (%)
Marital status - Divorced (%)
Ancestries Reported - Arab (%)
Ancestries Reported - Czech (%)
Ancestries Reported - Danish (%)
Ancestries Reported - Dutch (%)
Ancestries Reported - English (%)
Ancestries Reported - French (%)
Ancestries Reported - French Canadian (%)
Ancestries Reported - German (%)
Ancestries Reported - Greek (%)
Ancestries Reported - Hungarian (%)
Ancestries Reported - Irish (%)
Ancestries Reported - Italian (%)
Ancestries Reported - Lithuanian (%)
Ancestries Reported - Norwegian (%)
Ancestries Reported - Polish (%)
Ancestries Reported - Portuguese (%)
Ancestries Reported - Russian (%)
Ancestries Reported - Scotch-Irish (%)
Ancestries Reported - Scottish (%)
Ancestries Reported - Slovak (%)
Ancestries Reported - Subsaharan African (%)
Ancestries Reported - Swedish (%)
Ancestries Reported - Swiss (%)
Ancestries Reported - Ukrainian (%)
Ancestries Reported - United States (%)
Ancestries Reported - Welsh (%)
Ancestries Reported - West Indian (%)
Ancestries Reported - Other (%)
Geographical mobility - Same house 1 year ago (%)
Geographical mobility - Same house 1 year ago (%) - White
Geographical mobility - Same house 1 year ago (%) - Black or African American
Geographical mobility - Same house 1 year ago (%) - Asian
Geographical mobility - Same house 1 year ago (%) - Hispanic or Latino
Geographical mobility - Same house 1 year ago (%) - American Indian and Alaska Native
Geographical mobility - Same house 1 year ago (%) - Multirace
Geographical mobility - Same house 1 year ago (%) - Other Race
Geographical mobility - Moved within same county (%)
Geographical mobility - Moved within same county (%) - White
Geographical mobility - Moved within same county (%) - Black or African American
Geographical mobility - Moved within same county (%) - Asian
Geographical mobility - Moved within same county (%) - Hispanic or Latino
Geographical mobility - Moved within same county (%) - American Indian and Alaska Native
Geographical mobility - Moved within same county (%) - Multirace
Geographical mobility - Moved within same county (%) - Other Race
Geographical mobility - Moved from different county within same state (%)
Geographical mobility - Moved from different county within same state (%) - White
Geographical mobility - Moved from different county within same state (%) - Black or African American
Geographical mobility - Moved from different county within same state (%) - Asian
Geographical mobility - Moved from different county within same state (%) - Hispanic or Latino
Geographical mobility - Moved from different county within same state (%) - American Indian and Alaska Native
Geographical mobility - Moved from different county within same state (%) - Multirace
Geographical mobility - Moved from different county within same state (%) - Other Race
Geographical mobility - Moved from different state (%)
Geographical mobility - Moved from different state (%) - White
Geographical mobility - Moved from different state (%) - Black or African American
Geographical mobility - Moved from different state (%) - Asian
Geographical mobility - Moved from different state (%) - Hispanic or Latino
Geographical mobility - Moved from different state (%) - American Indian and Alaska Native
Geographical mobility - Moved from different state (%) - Multirace
Geographical mobility - Moved from different state (%) - Other Race
Geographical mobility - Moved from abroad (%)
Geographical mobility - Moved from abroad (%) - White
Geographical mobility - Moved from abroad (%) - Black or African American
Geographical mobility - Moved from abroad (%) - Asian
Geographical mobility - Moved from abroad (%) - Hispanic or Latino
Geographical mobility - Moved from abroad (%) - American Indian and Alaska Native
Geographical mobility - Moved from abroad (%) - Multirace
Geographical mobility - Moved from abroad (%) - Other Race
Place of birth for the foreign-born population - Ireland (%)
Place of birth for the foreign-born population - Denmark (%)
Place of birth for the foreign-born population - Norway (%)
Place of birth for the foreign-born population - Sweden (%)
Place of birth for the foreign-born population - United Kingdom (%)
Place of birth for the foreign-born population - England (%)
Place of birth for the foreign-born population - Scotland (%)
Place of birth for the foreign-born population - Other Northern Europe (%)
Place of birth for the foreign-born population - Austria (%)
Place of birth for the foreign-born population - Belgium (%)
Place of birth for the foreign-born population - France (%)
Place of birth for the foreign-born population - Germany (%)
Place of birth for the foreign-born population - Netherlands (%)
Place of birth for the foreign-born population - Switzerland (%)
Place of birth for the foreign-born population - Other Western Europe (%)
Place of birth for the foreign-born population - Greece (%)
Place of birth for the foreign-born population - Italy (%)
Place of birth for the foreign-born population - Portugal (%)
Place of birth for the foreign-born population - Spain (%)
Place of birth for the foreign-born population - Other Southern Europe (%)
Place of birth for the foreign-born population - Albania (%)
Place of birth for the foreign-born population - Belarus (%)
Place of birth for the foreign-born population - Bosnia and Herzegovina (%)
Place of birth for the foreign-born population - Bulgaria (%)
Place of birth for the foreign-born population - Croatia (%)
Place of birth for the foreign-born population - Czechoslovakia (%)
Place of birth for the foreign-born population - Hungary (%)
Place of birth for the foreign-born population - Latvia (%)
Place of birth for the foreign-born population - Lithuania (%)
Place of birth for the foreign-born population - North Macedonia (Macedonia) (%)
Place of birth for the foreign-born population - Moldova (%)
Place of birth for the foreign-born population - Poland (%)
Place of birth for the foreign-born population - Romania (%)
Place of birth for the foreign-born population - Russia (%)
Place of birth for the foreign-born population - Serbia (%)
Place of birth for the foreign-born population - Ukraine (%)
Place of birth for the foreign-born population - Other Eastern Europe (%)
Place of birth for the foreign-born population - China (%)
Place of birth for the foreign-born population - Hong Kong (%)
Place of birth for the foreign-born population - Taiwan (%)
Place of birth for the foreign-born population - Japan (%)
Place of birth for the foreign-born population - Korea (%)
Place of birth for the foreign-born population - Other Eastern Asia (%)
Place of birth for the foreign-born population - Afghanistan (%)
Place of birth for the foreign-born population - Bangladesh (%)
Place of birth for the foreign-born population - India (%)
Place of birth for the foreign-born population - Iran (%)
Place of birth for the foreign-born population - Kazakhstan (%)
Place of birth for the foreign-born population - Nepal (%)
Place of birth for the foreign-born population - Pakistan (%)
Place of birth for the foreign-born population - Sri Lanka (%)
Place of birth for the foreign-born population - Uzbekistan (%)
Place of birth for the foreign-born population - Other South Central Asia (%)
Place of birth for the foreign-born population - Burma (%)
Place of birth for the foreign-born population - Cambodia (%)
Place of birth for the foreign-born population - Indonesia (%)
Place of birth for the foreign-born population - Laos (%)
Place of birth for the foreign-born population - Malaysia (%)
Place of birth for the foreign-born population - Philippines (%)
Place of birth for the foreign-born population - Singapore (%)
Place of birth for the foreign-born population - Thailand (%)
Place of birth for the foreign-born population - Vietnam (%)
Place of birth for the foreign-born population - Other South Eastern Asia (%)
Place of birth for the foreign-born population - Armenia (%)
Place of birth for the foreign-born population - Iraq (%)
Place of birth for the foreign-born population - Israel (%)
Place of birth for the foreign-born population - Jordan (%)
Place of birth for the foreign-born population - Kuwait (%)
Place of birth for the foreign-born population - Lebanon (%)
Place of birth for the foreign-born population - Saudi Arabia (%)
Place of birth for the foreign-born population - Syria (%)
Place of birth for the foreign-born population - Turkey (%)
Place of birth for the foreign-born population - Yemen (%)
Place of birth for the foreign-born population - Other Western Asia (%)
Place of birth for the foreign-born population - Eritrea (%)
Place of birth for the foreign-born population - Ethiopia (%)
Place of birth for the foreign-born population - Kenya (%)
Place of birth for the foreign-born population - Somalia (%)
Place of birth for the foreign-born population - Uganda (%)
Place of birth for the foreign-born population - Zimbabwe (%)
Place of birth for the foreign-born population - Other Eastern Africa (%)
Place of birth for the foreign-born population - Cameroon (%)
Place of birth for the foreign-born population - Congo (%)
Place of birth for the foreign-born population - Democratic Republic of Congo (Zaire) (%)
Place of birth for the foreign-born population - Other Middle Africa (%)
Place of birth for the foreign-born population - Egypt (%)
Place of birth for the foreign-born population - Morocco (%)
Place of birth for the foreign-born population - Sudan (%)
Place of birth for the foreign-born population - Other Northern Africa (%)
Place of birth for the foreign-born population - South Africa (%)
Place of birth for the foreign-born population - Other Southern Africa (%)
Place of birth for the foreign-born population - Cabo Verde (%)
Place of birth for the foreign-born population - Ghana (%)
Place of birth for the foreign-born population - Liberia (%)
Place of birth for the foreign-born population - Nigeria (%)
Place of birth for the foreign-born population - Senegal (%)
Place of birth for the foreign-born population - Sierra Leone (%)
Place of birth for the foreign-born population - Other Western Africa (%)
Place of birth for the foreign-born population - Australia (%)
Place of birth for the foreign-born population - New Zealand (%)
Place of birth for the foreign-born population - Fiji (%)
Place of birth for the foreign-born population - Micronesia (%)
Place of birth for the foreign-born population - Bahamas (%)
Place of birth for the foreign-born population - Barbados (%)
Place of birth for the foreign-born population - Cuba (%)
Place of birth for the foreign-born population - Dominica (%)
Place of birth for the foreign-born population - Dominican Republic (%)
Place of birth for the foreign-born population - Grenada (%)
Place of birth for the foreign-born population - Haiti (%)
Place of birth for the foreign-born population - Jamaica (%)
Place of birth for the foreign-born population - St. Vincent and the Grenadines (%)
Place of birth for the foreign-born population - Trinidad and Tobago (%)
Place of birth for the foreign-born population - West Indies (%)
Place of birth for the foreign-born population - Other Caribbean (%)
Place of birth for the foreign-born population - Belize (%)
Place of birth for the foreign-born population - Costa Rica (%)
Place of birth for the foreign-born population - El Salvador (%)
Place of birth for the foreign-born population - Guatemala (%)
Place of birth for the foreign-born population - Honduras (%)
Place of birth for the foreign-born population - Mexico (%)
Place of birth for the foreign-born population - Nicaragua (%)
Place of birth for the foreign-born population - Panama (%)
Place of birth for the foreign-born population - Other Central America (%)
Place of birth for the foreign-born population - Argentina (%)
Place of birth for the foreign-born population - Bolivia (%)
Place of birth for the foreign-born population - Brazil (%)
Place of birth for the foreign-born population - Chile (%)
Place of birth for the foreign-born population - Colombia (%)
Place of birth for the foreign-born population - Ecuador (%)
Place of birth for the foreign-born population - Guyana (%)
Place of birth for the foreign-born population - Peru (%)
Place of birth for the foreign-born population - Uruguay (%)
Place of birth for the foreign-born population - Venezuela (%)
Place of birth for the foreign-born population - Other South America (%)
Place of birth for the foreign-born population - Canada (%)
Place of birth for the foreign-born population - Other Northern America (%)
Place of birth for the foreign-born population - Other (%)
Latest news about races in Temple, TX collected exclusively by city-data.com from local newspapers, TV, and radio stations
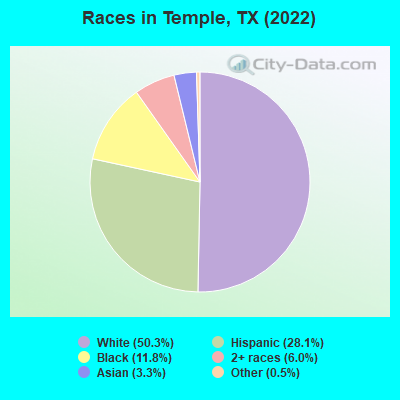
According to 2022 data, the most numerous races in Temple, TX are Hispanic (25,136 residents), White alone (44,990 residents), and Black alone (10,575 residents). 83.4% of Temple residents speak English at home. 7.2% of Temple, TX residents are foreign-born (4.7% born in Latin America, 1.8% born in Asia), which is 136.4% less than the foreign-born rate of 17.0% across the entire state of Texas.
Race distribution in Temple
2000 2022
10,933,313 52.4% White alone 6,669,666 32.0% Hispanic 2,364,255 11.3% Black alone 554,445 2.7% Asian alone 230,567 1.1% Two or more races 68,859 0.3% American Indian alone 19,958 0.10% Other race alone 10,757 0.05% Native Hawaiian and Other
12,070,642 40.2% Hispanic 11,683,430 38.9% White alone 3,508,706 11.7% Black alone 1,608,173 5.4% Asian alone 956,560 3.2% Two or more races 125,763 0.4% Other race alone 47,023 0.2% American Indian alone 29,275 0.10% Native Hawaiian and Other
Income and house value in Temple Median household income in 2022 $69,539 White non-Hispanic householders$49,501 Black householders$66,423 Asian householders$30,772 Some other race householders$70,274 Two or more races householders$45,047 Hispanic or Latino race householdersMedian 2022 house value $261,915 White Non-Hispanic householders$159,371 Black or African American householders$200,325 American Indian or Alaska Native householders $345,410 Asian householders$142,227 Some other race householders$252,391 Two or more races householders$162,546 Hispanic or Latino householders
Median age by race in Temple
35.3 Median age for White residents34.6 35.8 41.2 Median age for Black or African American residents41.0 41.4 27.6 Median age for American Indian / Alaska Native residents22.8 32.4 40.6 Median age for Asian residents42.5 40.4 -666,666,666.0 Median age for Native Hawaiian / Pacific Islander residents-666,666,666.0 -666,666,666.0 27.5 Median age for Other race residents27.2 27.9 22.1 Median age for Two or more races residents23.4 21.0 38.1 Median age for White alone residents37.3 38.4 26.1 Median age for Hispanic or Latino residents22.6 27.2
Owner/renter occupied households by race in Temple
House owners and renters - White residents 11,333 55.0% Owner occupied9,274 45.0% Renter occupiedHouse owners and renters - Black or African American residents 1,822 42.0% Owner occupied2,513 58.0% Renter occupiedHouse owners and renters - American Indian / Alaska Native residents 129 49.5% Owner occupied131 50.5% Renter occupiedHouse owners and renters - Asian residents 401 29.1% Owner occupied978 70.9% Renter occupiedHouse owners and renters - Native Hawaiian / Pacific Islander residents 33 100.0% Renter occupiedHouse owners and renters - Other race residents 790 39.8% Owner occupied1,193 60.2% Renter occupiedHouse owners and renters - Two or more races residents 2,196 44.3% Owner occupied2,764 55.7% Renter occupiedHouse owners and renters - White alone residents 10,867 55.8% Owner occupied8,616 44.2% Renter occupiedHouse owners and renters - Hispanic or Latino residents 3,345 49.7% Owner occupied3,380 50.3% Renter occupied
Language usage in Temple
English speakers - Total 83.4% of residents of Temple speak English at home.
13.3% of residents speak Spanish at home 6,714 61.0% Speak English very well4,301 39.0% Speak English less than very well3.3% of residents speak other language at home 1,195 43.4% Speak English very well1,559 56.6% Speak English less than very well
English speakers - Born in the United States 95.2% of residents of Temple speak English at home.
4.0% of residents speak Spanish at home 1,037 88.9% Speak English very well129 11.1% Speak English less than very well0.8% of residents speak other language at home 226 100.0% Speak English very well
English speakers - Native, born elsewhere 36.9% of residents of Temple speak English at home.
50.6% of residents speak Spanish at home 447 65.4% Speak English very well236 34.6% Speak English less than very well12.5% of residents speak other language at home 168 100.0% Speak English very well
English speakers - Foreign-born 11.1% of residents of Temple speak English at home.
58.4% of residents speak Spanish at home 1,307 29.3% Speak English very well3,158 70.7% Speak English less than very well30.4% of residents speak other language at home 766 32.9% Speak English very well1,559 67.1% Speak English less than very well
White (Caucasian) - Speak only English Native:
97.2% (44,727)Foreign-born:
19.2% (245)
White (Caucasian) - Speak another language Native:
2.8% (1,278)Foreign-born:
80.8% (1,030)
Black or African American - Speak only English Native:
99.2% (10,044)Foreign-born:
55.2% (196)
Black or African American - Speak another language Native:
1.5% (155)Foreign-born:
38.7% (138)
American Indian / Alaska Native - Speak only English Native:
64.2% (310)Foreign-born:
24.5% (19)
American Indian / Alaska Native - Speak another language Native:
31.3% (151)Foreign-born:
78.2% (61)
Asian - Speak only English Native:
50.4% (337)Foreign-born:
6.3% (81)
Asian - Speak another language Native:
38.4% (257)Foreign-born:
96.9% (1,236)
Other race - Speak another language Native:
42.0% (1,569)Foreign-born:
100.0% (1,516)
Two or more races - Speak only English Native:
73.4% (10,291)Foreign-born:
14.3% (293)
Two or more races - Speak another language Native:
26.6% (3,723)Foreign-born:
85.7% (1,750)
White alone - Speak only English Native:
98.9% (41,768)Foreign-born:
53.3% (245)
White alone - Speak another language Native:
1.1% (465)Foreign-born:
46.7% (215)
Hispanic or Latino - Speak only English Native:
65.7% (11,351)Foreign-born:
9.6% (468)
Hispanic or Latino - Speak another language Native:
34.3% (5,934)Foreign-born:
90.4% (4,396)
Foreign-born residents in Temple 6,253 residents are foreign born (4.7% Latin America , 1.8% Asia ).
This city:
7.2%Texas:
17.1%
Marital status for residents in Temple Marital status - White (Caucasian) population 15 years and over
Males 25.6% Never married58.3% Now married0.2% Separated3.0% Widowed12.9% DivorcedFemales 26.7% Never married48.2% Now married4.1% Separated8.9% Widowed12.0% DivorcedWomen who gave birth in the past 12 months Now married:
79.9% (1,031)Unmarried:
20.1% (260)
Women who did not give birth in the past 12 months Now married:
46.7% (4,981)Unmarried:
53.3% (5,674)
Marital status - Black or African American population 15 years and over
Males 31.4% Never married53.6% Now married1.7% Separated0.0% Widowed13.3% DivorcedFemales 37.6% Never married27.5% Now married2.8% Separated6.7% Widowed25.3% DivorcedWomen who gave birth in the past 12 months Now married:
0.0% (0)Unmarried:
100.0% (90)
Women who did not give birth in the past 12 months Now married:
23.7% (656)Unmarried:
76.3% (2,108)
Marital status - American Indian / Alaska Native population 15 years and over
Males 50.4% Never married32.8% Now married0.0% Separated0.0% Widowed16.8% DivorcedFemales 40.6% Never married45.2% Now married0.0% Separated14.2% Widowed0.0% DivorcedWomen who gave birth in the past 12 months Now married:
0.0% (0)Unmarried:
100.0% (17)
Women who did not give birth in the past 12 months Now married:
35.7% (36)Unmarried:
64.3% (65)
Marital status - Asian population 15 years and over
Males 10.6% Never married85.9% Now married0.0% Separated0.0% Widowed3.5% DivorcedFemales 16.3% Never married77.9% Now married0.0% Separated5.8% Widowed0.0% DivorcedWomen who gave birth in the past 12 months Now married:
100.0% (96)Unmarried:
0.0% (0)
Women who did not give birth in the past 12 months Now married:
76.7% (441)Unmarried:
23.3% (134)
Marital status - Other race population 15 years and over
Males 19.8% Never married50.4% Now married4.9% Separated2.3% Widowed22.7% DivorcedFemales 38.8% Never married48.6% Now married3.8% Separated0.3% Widowed8.4% DivorcedWomen who gave birth in the past 12 months Now married:
10.8% (16)Unmarried:
89.2% (135)
Women who did not give birth in the past 12 months Now married:
43.9% (851)Unmarried:
56.1% (1,087)
Marital status - Two or more races population 15 years and over
Males 48.8% Never married40.7% Now married2.0% Separated1.6% Widowed6.9% DivorcedFemales 41.3% Never married44.4% Now married1.6% Separated4.0% Widowed8.7% DivorcedWomen who gave birth in the past 12 months Now married:
53.4% (86)Unmarried:
46.6% (75)
Women who did not give birth in the past 12 months Now married:
45.5% (2,108)Unmarried:
54.5% (2,521)
Marital status - White alone, not Hispanic / Latino population 15 years and over
Males 24.7% Never married57.8% Now married0.2% Separated3.3% Widowed14.0% DivorcedFemales 25.0% Never married47.7% Now married4.6% Separated9.8% Widowed12.9% DivorcedWomen who gave birth in the past 12 months Now married:
76.2% (832)Unmarried:
23.8% (260)
Women who did not give birth in the past 12 months Now married:
47.2% (4,355)Unmarried:
52.8% (4,880)
Marital status - Hispanic or Latino population 15 years and over
Males 37.1% Never married46.5% Now married3.4% Separated1.7% Widowed11.3% DivorcedFemales 40.8% Never married45.2% Now married3.2% Separated3.4% Widowed7.5% DivorcedWomen who gave birth in the past 12 months Now married:
76.0% (238)Unmarried:
24.0% (75)
Women who did not give birth in the past 12 months Now married:
64.7% (3,986)Unmarried:
35.3% (2,172)
Ancestries in Temple
3,703 8.5% English3,462 8.0% German2,205 5.1% American1,613 3.7% Irish912 2.1% Italian875 2.0% European675 1.6% Czech479 1.1% Scotch-Irish375 0.9% Scottish289 0.7% Norwegian247 0.6% Polish184 0.4% Brazilian156 0.4% French121 0.3% Ukrainian112 0.3% French Canadian106 0.2% Scandinavian94 0.2% British87 0.2% Czechoslovakian86 0.2% Welsh72 0.2% Canadian68 0.2% Eastern European66 0.2% Portuguese56 0.1% Swedish53 0.1% Liberian52 0.1% Dutch44 0.1% Nigerian40 0.09% Turkish39 0.09% Lebanese37 0.09% Syrian37 0.09% West Indian34 0.08% Jamaican33 0.08% Iranian32 0.07% Northern European30 0.07% Israeli26 0.06% Russian24 0.06% African20 0.05% Hungarian19 0.04% Austrian11 0.03% Romanian11 0.03% Ethiopian10 0.02% Estonian9 0.02% Armenian
Geographical mobility in Temple Same house 1 year ago 34,346 69.3% White (Caucasian)10,177 92.2% Black or African American539 82.2% American Indian / Alaska Native1,586 78.4% Asian33 98.2% Native Hawaiian / Pacific Islander7,662 93.0% Other race13,929 78.6% Two or more races30,964 69.3% White alone, not Hispanic / Latino20,706 82.9% Hispanic or LatinoMoved within same county 4,500 9.1% White / Caucasian834 7.6% Black or African American76 11.6% American Indian / Alaska Native83 4.1% Asian300 3.6% Other race3,217 18.2% Two or more races4,351 9.7% White alone, not Hispanic / Latino2,566 10.3% Hispanic or LatinoMoved within same state 5,465 11.0% White / Caucasian253 2.3% Black or African American32 4.9% American Indian / Alaska Native148 7.3% Asian76 0.9% Other race278 1.6% Two or more races4,516 10.1% White alone, not Hispanic / Latino737 3.0% Hispanic or LatinoMoved from different state 1,177 2.4% White / Caucasian68 0.6% Black or African American196 9.7% Asian31 0.4% Other race294 1.7% Two or more races736 1.6% White alone, not Hispanic / Latino384 1.5% Hispanic or LatinoMoved from abroad 4,087 8.2% White27 1.4% Asian4,087 9.2% White alone, not Hispanic / Latino353 1.4% Hispanic or Latino
Children Nativity (place of birth) in Temple
Children under 6 years - Living with two parents Both parents native 4,973 100.0% NativeBoth parents foreign-born 479 69.6% Native210 30.4% Foreign-bornOne native, one foreign-born parent 293 100.0% NativeChildren under 6 years - Living with one parent Native parent 1,598 100.0% NativeForeign-born parent 228 100.0% NativeChildren 6 to 17 years - Living with two parents Both parents native 6,528 99.2% Native53 0.8% Foreign-bornBoth parents foreign-born 922 67.4% Native447 32.6% Foreign-bornOne native, one foreign-born parent 789 92.3% Native66 7.7% Foreign-bornChildren 6 to 17 years - Living with one parent Native parent 5,392 100.0% NativeForeign-born parent 334 56.3% Native259 43.7% Foreign-born
Grandparents responsible for own grandchildren in Temple
Grandparents (30 to 59 years) White / Caucasian 122 32.6% Responsible for grandchildren251 67.4% Not responsible for grandchildrenBlack or African American 111 58.2% Responsible for grandchildren79 41.8% Not responsible for grandchildrenAsian 4 100.0% Responsible for grandchildrenOther race 13 17.5% Responsible for grandchildren62 82.5% Not responsible for grandchildrenTwo or more races 29 19.7% Responsible for grandchildren117 80.3% Not responsible for grandchildrenWhite alone, not Hispanic / Latino 96 52.6% Responsible for grandchildren86 47.4% Not responsible for grandchildrenHispanic or Latino 104 13.9% Responsible for grandchildren646 86.1% Not responsible for grandchildrenGrandparents (60 years and over) White / Caucasian 254 53.0% Responsible for grandchildren225 47.0% Not responsible for grandchildrenBlack or African American 209 79.9% Responsible for grandchildren52 20.1% Not responsible for grandchildrenAsian 18 100.0% Not responsible for grandchildrenOther race 115 44.1% Responsible for grandchildren145 55.9% Not responsible for grandchildrenTwo or more races 15 5.3% Responsible for grandchildren264 94.7% Not responsible for grandchildrenWhite alone, not Hispanic / Latino 177 46.3% Responsible for grandchildren205 53.7% Not responsible for grandchildrenHispanic or Latino 362 50.0% Responsible for grandchildren362 50.0% Not responsible for grandchildren