Races in Tahuya, Washington (WA) Detailed Stats
Ancestries, Foreign-born residents, place of birth
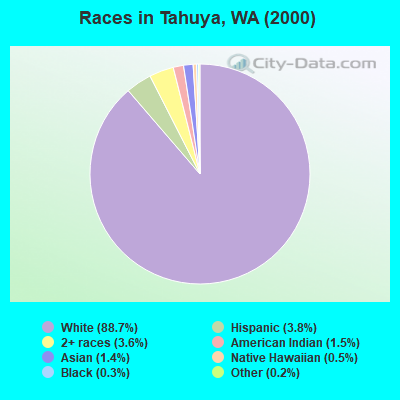
Race distribution in Tahuya

- 4,69788.7%White alone
- 2033.8%Hispanic
- 1893.6%Two or more races
- 781.5%American Indian alone
- 741.4%Asian alone
- 260.5%Native Hawaiian and Other
Pacific Islander alone - 180.3%Black alone
- 80.2%Other race alone
2000
2022
-
- 4,652,49078.9%White alone
- 441,5097.5%Hispanic
- 319,4015.4%Asian alone
- 184,6313.1%Black alone
- 175,9263.0%Two or more races
- 85,3961.4%American Indian alone
- 22,7790.4%Native Hawaiian and Other
Pacific Islander alone - 11,9890.2%Other race alone

-
- 4,941,45663.5%White alone
- 1,093,31314.0%Hispanic
- 755,8329.7%Asian alone
- 523,4486.7%Two or more races
- 299,5373.8%Black alone
- 69,0240.9%American Indian alone
- 52,2310.7%Native Hawaiian and Other
Pacific Islander alone - 50,9450.7%Other race alone

Income and house value in Tahuya
- Median household income in 2022
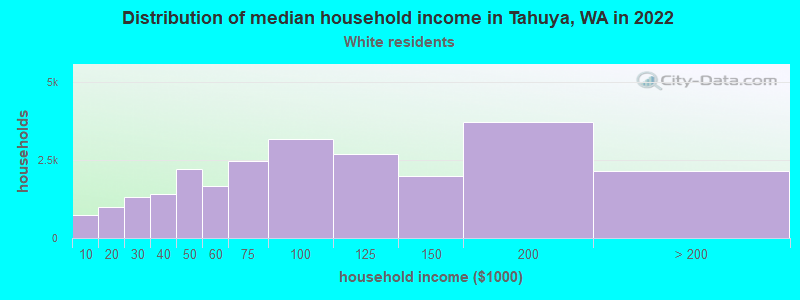
- $89,459White non-Hispanic householders
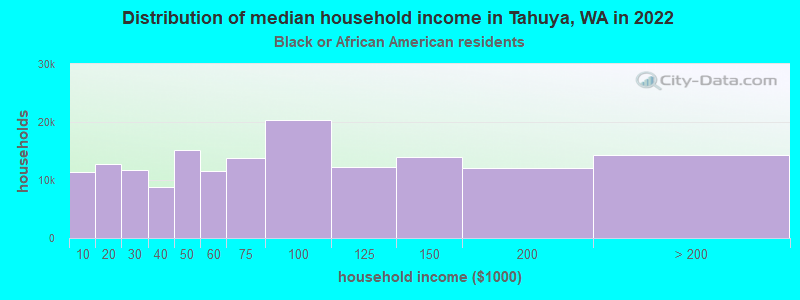
- $61,610Black householders
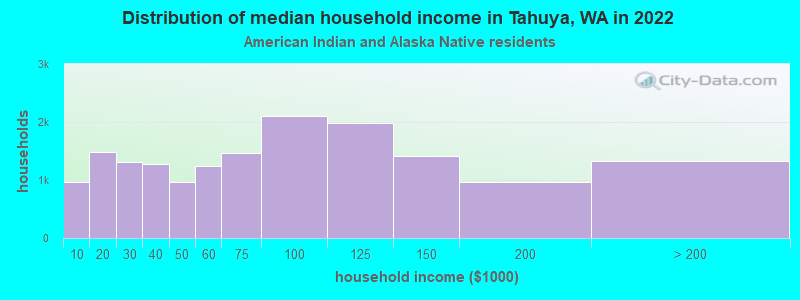
- $65,836American Indian and Alaska Native householders
- $49,839Some other race householders
- $53,139Two or more races householders
- $131,924Hispanic or Latino race householders
- Median 2022 house value
- $489,558White Non-Hispanic householders
- $490,272Black or African American householders
- $151,538American Indian or Alaska Native householders
- over $1,000,000Asian householders
- $338,733Native Hawaiian and other Pacific Islander householders
- $412,185Some other race householders
- $507,030Two or more races householders
- $460,677Hispanic or Latino householders
Household income for White non-Hispanic householders
Household income for Black householders
Household income for American Indian and Alaska Native householders
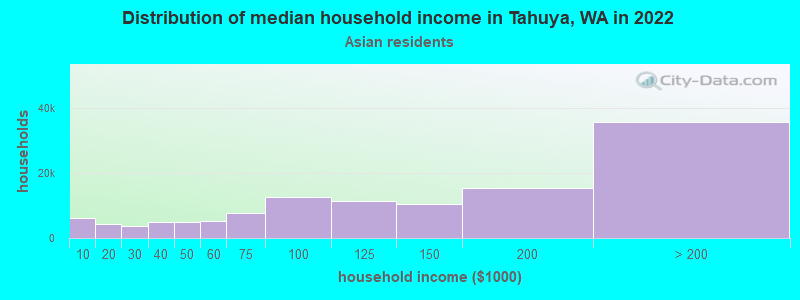
Household income for Asian householders
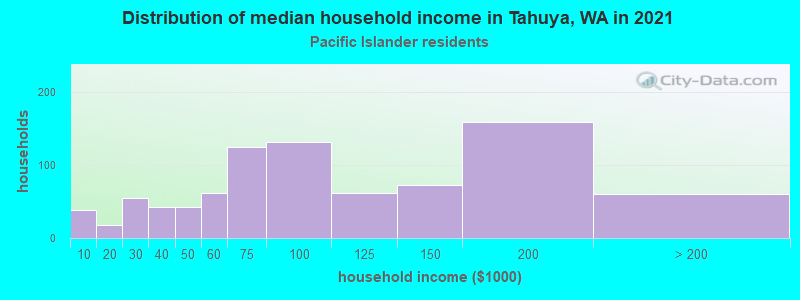
Household income for Native Hawaiian and other Pacific Islander householders
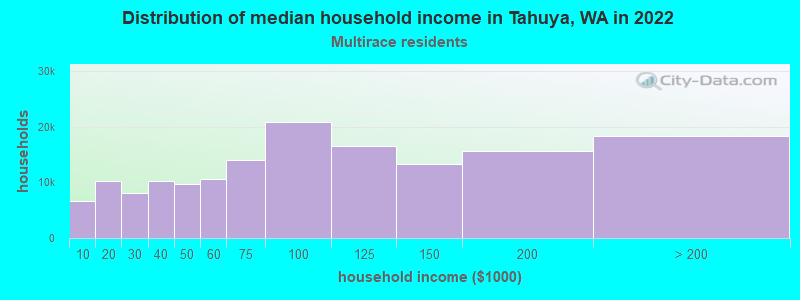
Household income for Two or more races householders
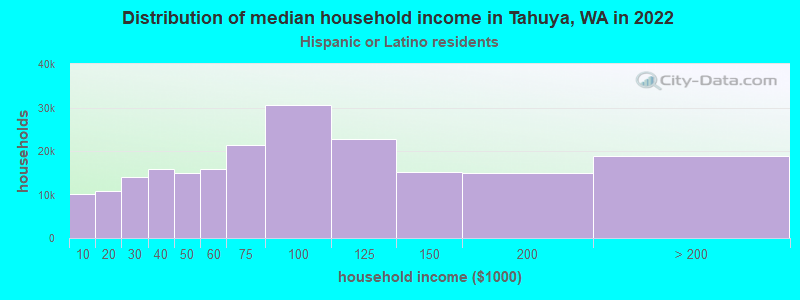
Household income for Hispanic or Latino race householders
Zip code: 98588