Races in Stow, Ohio (OH) Detailed Stats
Data:
Races - White alone (%)
Races - White alone (% change since 2000)
Races - Black alone (%)
Races - Black alone (% change since 2000)
Races - American Indian alone (%)
Races - American Indian alone (% change since 2000)
Races - Asian alone (%)
Races - Asian alone (% change since 2000)
Races - Hispanic (%)
Races - Hispanic (% change since 2000)
Races - Native Hawaiian and Other Pacific Islander alone (%)
Races - Native Hawaiian and Other Pacific Islander alone (% change since 2000)
Races - Two or more races(%)
Races - Two or more races(% change since 2000)
Races - Other race alone (%)
Races - Other race alone (% change since 2000)
Racial diversity
Place of birth - Born in state of residence (%)
Place of birth - Born in state of residence (%) - White
Place of birth - Born in state of residence (%) - Black or African American
Place of birth - Born in state of residence (%) - Asian
Place of birth - Born in state of residence (%) - Hispanic or Latino
Place of birth - Born in state of residence (%) - American Indian and Alaska Native
Place of birth - Born in state of residence (%) - Multirace
Place of birth - Born in state of residence (%) - Other Race
Place of birth - Born in other state (%)
Place of birth - Born in other state (%) - White
Place of birth - Born in other state (%) - Black or African American
Place of birth - Born in other state (%) - Asian
Place of birth - Born in other state (%) - Hispanic or Latino
Place of birth - Born in other state (%) - American Indian and Alaska Native
Place of birth - Born in other state (%) - Multirace
Place of birth - Born in other state (%) - Other Race
Place of birth - Native, outside of US (%)
Place of birth - Native, outside of US (%) - White
Place of birth - Native, outside of US (%) - Black or African American
Place of birth - Native, outside of US (%) - Asian
Place of birth - Native, outside of US (%) - Hispanic or Latino
Place of birth - Native, outside of US (%) - American Indian and Alaska Native
Place of birth - Native, outside of US (%) - Multirace
Place of birth - Native, outside of US (%) - Other Race
Place of birth - Foreign born (%)
Place of birth - Foreign born (%) - White
Place of birth - Foreign born (%) - Black or African American
Place of birth - Foreign born (%) - Asian
Place of birth - Foreign born (%) - Hispanic or Latino
Place of birth - Foreign born (%) - American Indian and Alaska Native
Place of birth - Foreign born (%) - Multirace
Place of birth - Foreign born (%) - Other Race
Residents speaking English at home (%)
Residents speaking English at home - Born in the United States (%)
Residents speaking English at home - Native, born elsewhere (%)
Residents speaking English at home - Foreign born (%)
Residents speaking Spanish at home (%)
Residents speaking Spanish at home - Born in the United States (%)
Residents speaking Spanish at home - Native, born elsewhere (%)
Residents speaking Spanish at home - Foreign born (%)
Residents speaking other language at home (%)
Residents speaking other language at home - Born in the United States (%)
Residents speaking other language at home - Native, born elsewhere (%)
Residents speaking other language at home - Foreign born (%)
Marital status - Never married (%)
Marital status - Now married (%)
Marital status - Separated (%)
Marital status - Widowed (%)
Marital status - Divorced (%)
Ancestries Reported - Arab (%)
Ancestries Reported - Czech (%)
Ancestries Reported - Danish (%)
Ancestries Reported - Dutch (%)
Ancestries Reported - English (%)
Ancestries Reported - French (%)
Ancestries Reported - French Canadian (%)
Ancestries Reported - German (%)
Ancestries Reported - Greek (%)
Ancestries Reported - Hungarian (%)
Ancestries Reported - Irish (%)
Ancestries Reported - Italian (%)
Ancestries Reported - Lithuanian (%)
Ancestries Reported - Norwegian (%)
Ancestries Reported - Polish (%)
Ancestries Reported - Portuguese (%)
Ancestries Reported - Russian (%)
Ancestries Reported - Scotch-Irish (%)
Ancestries Reported - Scottish (%)
Ancestries Reported - Slovak (%)
Ancestries Reported - Subsaharan African (%)
Ancestries Reported - Swedish (%)
Ancestries Reported - Swiss (%)
Ancestries Reported - Ukrainian (%)
Ancestries Reported - United States (%)
Ancestries Reported - Welsh (%)
Ancestries Reported - West Indian (%)
Ancestries Reported - Other (%)
Geographical mobility - Same house 1 year ago (%)
Geographical mobility - Same house 1 year ago (%) - White
Geographical mobility - Same house 1 year ago (%) - Black or African American
Geographical mobility - Same house 1 year ago (%) - Asian
Geographical mobility - Same house 1 year ago (%) - Hispanic or Latino
Geographical mobility - Same house 1 year ago (%) - American Indian and Alaska Native
Geographical mobility - Same house 1 year ago (%) - Multirace
Geographical mobility - Same house 1 year ago (%) - Other Race
Geographical mobility - Moved within same county (%)
Geographical mobility - Moved within same county (%) - White
Geographical mobility - Moved within same county (%) - Black or African American
Geographical mobility - Moved within same county (%) - Asian
Geographical mobility - Moved within same county (%) - Hispanic or Latino
Geographical mobility - Moved within same county (%) - American Indian and Alaska Native
Geographical mobility - Moved within same county (%) - Multirace
Geographical mobility - Moved within same county (%) - Other Race
Geographical mobility - Moved from different county within same state (%)
Geographical mobility - Moved from different county within same state (%) - White
Geographical mobility - Moved from different county within same state (%) - Black or African American
Geographical mobility - Moved from different county within same state (%) - Asian
Geographical mobility - Moved from different county within same state (%) - Hispanic or Latino
Geographical mobility - Moved from different county within same state (%) - American Indian and Alaska Native
Geographical mobility - Moved from different county within same state (%) - Multirace
Geographical mobility - Moved from different county within same state (%) - Other Race
Geographical mobility - Moved from different state (%)
Geographical mobility - Moved from different state (%) - White
Geographical mobility - Moved from different state (%) - Black or African American
Geographical mobility - Moved from different state (%) - Asian
Geographical mobility - Moved from different state (%) - Hispanic or Latino
Geographical mobility - Moved from different state (%) - American Indian and Alaska Native
Geographical mobility - Moved from different state (%) - Multirace
Geographical mobility - Moved from different state (%) - Other Race
Geographical mobility - Moved from abroad (%)
Geographical mobility - Moved from abroad (%) - White
Geographical mobility - Moved from abroad (%) - Black or African American
Geographical mobility - Moved from abroad (%) - Asian
Geographical mobility - Moved from abroad (%) - Hispanic or Latino
Geographical mobility - Moved from abroad (%) - American Indian and Alaska Native
Geographical mobility - Moved from abroad (%) - Multirace
Geographical mobility - Moved from abroad (%) - Other Race
Place of birth for the foreign-born population - Ireland (%)
Place of birth for the foreign-born population - Denmark (%)
Place of birth for the foreign-born population - Norway (%)
Place of birth for the foreign-born population - Sweden (%)
Place of birth for the foreign-born population - United Kingdom (%)
Place of birth for the foreign-born population - England (%)
Place of birth for the foreign-born population - Scotland (%)
Place of birth for the foreign-born population - Other Northern Europe (%)
Place of birth for the foreign-born population - Austria (%)
Place of birth for the foreign-born population - Belgium (%)
Place of birth for the foreign-born population - France (%)
Place of birth for the foreign-born population - Germany (%)
Place of birth for the foreign-born population - Netherlands (%)
Place of birth for the foreign-born population - Switzerland (%)
Place of birth for the foreign-born population - Other Western Europe (%)
Place of birth for the foreign-born population - Greece (%)
Place of birth for the foreign-born population - Italy (%)
Place of birth for the foreign-born population - Portugal (%)
Place of birth for the foreign-born population - Spain (%)
Place of birth for the foreign-born population - Other Southern Europe (%)
Place of birth for the foreign-born population - Albania (%)
Place of birth for the foreign-born population - Belarus (%)
Place of birth for the foreign-born population - Bosnia and Herzegovina (%)
Place of birth for the foreign-born population - Bulgaria (%)
Place of birth for the foreign-born population - Croatia (%)
Place of birth for the foreign-born population - Czechoslovakia (%)
Place of birth for the foreign-born population - Hungary (%)
Place of birth for the foreign-born population - Latvia (%)
Place of birth for the foreign-born population - Lithuania (%)
Place of birth for the foreign-born population - North Macedonia (Macedonia) (%)
Place of birth for the foreign-born population - Moldova (%)
Place of birth for the foreign-born population - Poland (%)
Place of birth for the foreign-born population - Romania (%)
Place of birth for the foreign-born population - Russia (%)
Place of birth for the foreign-born population - Serbia (%)
Place of birth for the foreign-born population - Ukraine (%)
Place of birth for the foreign-born population - Other Eastern Europe (%)
Place of birth for the foreign-born population - China (%)
Place of birth for the foreign-born population - Hong Kong (%)
Place of birth for the foreign-born population - Taiwan (%)
Place of birth for the foreign-born population - Japan (%)
Place of birth for the foreign-born population - Korea (%)
Place of birth for the foreign-born population - Other Eastern Asia (%)
Place of birth for the foreign-born population - Afghanistan (%)
Place of birth for the foreign-born population - Bangladesh (%)
Place of birth for the foreign-born population - India (%)
Place of birth for the foreign-born population - Iran (%)
Place of birth for the foreign-born population - Kazakhstan (%)
Place of birth for the foreign-born population - Nepal (%)
Place of birth for the foreign-born population - Pakistan (%)
Place of birth for the foreign-born population - Sri Lanka (%)
Place of birth for the foreign-born population - Uzbekistan (%)
Place of birth for the foreign-born population - Other South Central Asia (%)
Place of birth for the foreign-born population - Burma (%)
Place of birth for the foreign-born population - Cambodia (%)
Place of birth for the foreign-born population - Indonesia (%)
Place of birth for the foreign-born population - Laos (%)
Place of birth for the foreign-born population - Malaysia (%)
Place of birth for the foreign-born population - Philippines (%)
Place of birth for the foreign-born population - Singapore (%)
Place of birth for the foreign-born population - Thailand (%)
Place of birth for the foreign-born population - Vietnam (%)
Place of birth for the foreign-born population - Other South Eastern Asia (%)
Place of birth for the foreign-born population - Armenia (%)
Place of birth for the foreign-born population - Iraq (%)
Place of birth for the foreign-born population - Israel (%)
Place of birth for the foreign-born population - Jordan (%)
Place of birth for the foreign-born population - Kuwait (%)
Place of birth for the foreign-born population - Lebanon (%)
Place of birth for the foreign-born population - Saudi Arabia (%)
Place of birth for the foreign-born population - Syria (%)
Place of birth for the foreign-born population - Turkey (%)
Place of birth for the foreign-born population - Yemen (%)
Place of birth for the foreign-born population - Other Western Asia (%)
Place of birth for the foreign-born population - Eritrea (%)
Place of birth for the foreign-born population - Ethiopia (%)
Place of birth for the foreign-born population - Kenya (%)
Place of birth for the foreign-born population - Somalia (%)
Place of birth for the foreign-born population - Uganda (%)
Place of birth for the foreign-born population - Zimbabwe (%)
Place of birth for the foreign-born population - Other Eastern Africa (%)
Place of birth for the foreign-born population - Cameroon (%)
Place of birth for the foreign-born population - Congo (%)
Place of birth for the foreign-born population - Democratic Republic of Congo (Zaire) (%)
Place of birth for the foreign-born population - Other Middle Africa (%)
Place of birth for the foreign-born population - Egypt (%)
Place of birth for the foreign-born population - Morocco (%)
Place of birth for the foreign-born population - Sudan (%)
Place of birth for the foreign-born population - Other Northern Africa (%)
Place of birth for the foreign-born population - South Africa (%)
Place of birth for the foreign-born population - Other Southern Africa (%)
Place of birth for the foreign-born population - Cabo Verde (%)
Place of birth for the foreign-born population - Ghana (%)
Place of birth for the foreign-born population - Liberia (%)
Place of birth for the foreign-born population - Nigeria (%)
Place of birth for the foreign-born population - Senegal (%)
Place of birth for the foreign-born population - Sierra Leone (%)
Place of birth for the foreign-born population - Other Western Africa (%)
Place of birth for the foreign-born population - Australia (%)
Place of birth for the foreign-born population - New Zealand (%)
Place of birth for the foreign-born population - Fiji (%)
Place of birth for the foreign-born population - Micronesia (%)
Place of birth for the foreign-born population - Bahamas (%)
Place of birth for the foreign-born population - Barbados (%)
Place of birth for the foreign-born population - Cuba (%)
Place of birth for the foreign-born population - Dominica (%)
Place of birth for the foreign-born population - Dominican Republic (%)
Place of birth for the foreign-born population - Grenada (%)
Place of birth for the foreign-born population - Haiti (%)
Place of birth for the foreign-born population - Jamaica (%)
Place of birth for the foreign-born population - St. Vincent and the Grenadines (%)
Place of birth for the foreign-born population - Trinidad and Tobago (%)
Place of birth for the foreign-born population - West Indies (%)
Place of birth for the foreign-born population - Other Caribbean (%)
Place of birth for the foreign-born population - Belize (%)
Place of birth for the foreign-born population - Costa Rica (%)
Place of birth for the foreign-born population - El Salvador (%)
Place of birth for the foreign-born population - Guatemala (%)
Place of birth for the foreign-born population - Honduras (%)
Place of birth for the foreign-born population - Mexico (%)
Place of birth for the foreign-born population - Nicaragua (%)
Place of birth for the foreign-born population - Panama (%)
Place of birth for the foreign-born population - Other Central America (%)
Place of birth for the foreign-born population - Argentina (%)
Place of birth for the foreign-born population - Bolivia (%)
Place of birth for the foreign-born population - Brazil (%)
Place of birth for the foreign-born population - Chile (%)
Place of birth for the foreign-born population - Colombia (%)
Place of birth for the foreign-born population - Ecuador (%)
Place of birth for the foreign-born population - Guyana (%)
Place of birth for the foreign-born population - Peru (%)
Place of birth for the foreign-born population - Uruguay (%)
Place of birth for the foreign-born population - Venezuela (%)
Place of birth for the foreign-born population - Other South America (%)
Place of birth for the foreign-born population - Canada (%)
Place of birth for the foreign-born population - Other Northern America (%)
Place of birth for the foreign-born population - Other (%)
Latest news about races in Stow, OH collected exclusively by city-data.com from local newspapers, TV, and radio stations
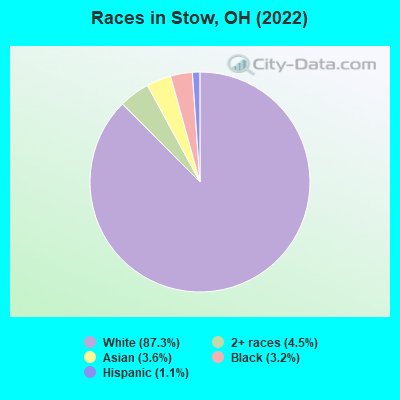
According to 2022 data, the most numerous races in Stow, OH are White alone (29,892 residents), Black alone (1,103 residents), and Two or more races (1,524 residents). 94.1% of Stow residents speak English at home. 4.9% of Stow, OH residents are foreign-born (3.4% born in Asia, 0.9% born in Europe), which is 18.4% greater than the foreign-born rate of 4.0% across the entire state of Ohio.
Race distribution in Stow
2000 2022
9,538,111 84.0% White alone 1,290,662 11.4% Black alone 217,123 1.9% Hispanic 137,770 1.2% Two or more races 131,670 1.2% Asian alone 21,985 0.2% American Indian alone 13,483 0.1% Other race alone 2,336 0.02% Native Hawaiian and Other
8,948,793 76.1% White alone 1,401,403 11.9% Black alone 529,291 4.5% Two or more races 517,232 4.4% Hispanic 293,387 2.5% Asian alone 52,805 0.4% Other race alone 9,785 0.08% American Indian alone 3,362 0.03% Native Hawaiian and Other
Income and house value in Stow Median household income in 2022 $87,565 White non-Hispanic householders$56,827 Black householders$53,411 Asian householders$94,775 Two or more races householders$136,416 Hispanic or Latino race householdersMedian 2022 house value $244,759 White Non-Hispanic householders$202,958 Black or African American householders$278,269 American Indian or Alaska Native householders $251,841 Asian householders$242,859 Two or more races householders$177,048 Hispanic or Latino householders
Median age by race in Stow
41.9 Median age for White residents41.4 42.6 39.1 Median age for Black or African American residents32.5 41.4 -502,953,586.0 Median age for American Indian / Alaska Native residents-668,371,695.8 -390,759,075.5 30.7 Median age for Asian residents34.4 26.9 -800,387,596.1 Median age for Native Hawaiian / Pacific Islander residents-666,666,666.0 -805,394,989.6 28.4 Median age for Other race residents32.3 6.7 25.8 Median age for Two or more races residents21.6 32.0 41.9 Median age for White alone residents41.4 42.8 37.7 Median age for Hispanic or Latino residents38.8 40.8
Owner/renter occupied households by race in Stow
House owners and renters - White residents 9,307 73.4% Owner occupied3,364 26.6% Renter occupiedHouse owners and renters - Black or African American residents 237 57.0% Owner occupied179 43.0% Renter occupiedHouse owners and renters - American Indian / Alaska Native residents 19 100.0% Owner occupiedHouse owners and renters - Asian residents 215 57.0% Owner occupied162 43.0% Renter occupiedHouse owners and renters - Other race residents 2 11.9% Owner occupied12 88.1% Renter occupiedHouse owners and renters - Two or more races residents 253 56.1% Owner occupied198 43.9% Renter occupiedHouse owners and renters - White alone residents 9,310 73.4% Owner occupied3,374 26.6% Renter occupiedHouse owners and renters - Hispanic or Latino residents 38 52.8% Owner occupied34 47.2% Renter occupied
Language usage in Stow
English speakers - Total 94.1% of residents of Stow speak English at home.
0.6% of residents speak Spanish at home 169 90.9% Speak English very well17 9.1% Speak English less than very well5.2% of residents speak other language at home 1,049 62.1% Speak English very well641 37.9% Speak English less than very well
English speakers - Born in the United States 99.4% of residents of Stow speak English at home.
0.1% of residents speak Spanish at home 6 100.0% Speak English very well0.7% of residents speak other language at home 46 100.0% Speak English very well
English speakers - Native, born elsewhere 81.8% of residents of Stow speak English at home.
10.1% of residents speak other language at home 10 100.0% Speak English very well
English speakers - Foreign-born 13.6% of residents of Stow speak English at home.
3.0% of residents speak Spanish at home 51 100.0% Speak English very well84.5% of residents speak other language at home 774 54.6% Speak English very well644 45.4% Speak English less than very well
White (Caucasian) - Speak only English Native:
98.9% (27,581)Foreign-born:
26.3% (201)
White (Caucasian) - Speak another language Native:
1.1% (307)Foreign-born:
74.5% (567)
Black or African American - Speak only English Native:
98.4% (865)Foreign-born:
38.4% (18)
Black or African American - Speak another language Native:
1.6% (14)Foreign-born:
62.3% (29)
Asian - Speak only English Native:
48.2% (103)Foreign-born:
1.7% (15)
Asian - Speak another language Native:
49.4% (105)Foreign-born:
100.0% (831)
Two or more races - Speak only English Native:
100.0% (1,376)Foreign-born:
0.9% (1)
Two or more races - Speak another language Native:
1.0% (14)Foreign-born:
100.0% (68)
White alone - Speak only English Native:
98.9% (27,540)Foreign-born:
25.6% (175)
White alone - Speak another language Native:
1.0% (275)Foreign-born:
75.7% (518)
Hispanic or Latino - Speak only English Native:
71.0% (208)Foreign-born:
36.5% (27)
Hispanic or Latino - Speak another language Native:
25.2% (74)Foreign-born:
62.1% (46)
Foreign-born residents in Stow 1,679 residents are foreign born (3.4% Asia , 0.9% Europe ).
Marital status for residents in Stow Marital status - White (Caucasian) population 15 years and over
Males 32.6% Never married56.9% Now married0.4% Separated2.8% Widowed7.4% DivorcedFemales 27.2% Never married53.4% Now married0.6% Separated7.8% Widowed10.9% DivorcedWomen who gave birth in the past 12 months Now married:
60.2% (195)Unmarried:
39.8% (129)
Women who did not give birth in the past 12 months Now married:
44.6% (2,922)Unmarried:
55.4% (3,633)
Marital status - Black or African American population 15 years and over
Males 38.9% Never married59.3% Now married0.0% Separated0.0% Widowed1.8% DivorcedFemales 37.7% Never married33.8% Now married1.1% Separated12.7% Widowed14.7% DivorcedWomen who gave birth in the past 12 months Now married:
100.0% (33)Unmarried:
0.0% (0)
Women who did not give birth in the past 12 months Now married:
45.8% (78)Unmarried:
54.2% (92)
Marital status - Asian population 15 years and over
Males 28.5% Never married66.4% Now married0.0% Separated0.0% Widowed5.1% DivorcedFemales 26.0% Never married59.3% Now married0.0% Separated12.7% Widowed2.0% DivorcedWomen who did not give birth in the past 12 months Now married:
50.2% (142)Unmarried:
49.8% (141)
Marital status - Other race population 15 years and over
Males 35.4% Never married33.3% Now married0.0% Separated0.0% Widowed31.2% DivorcedFemales 0.0% Never married100.0% Now married0.0% Separated0.0% Widowed0.0% DivorcedWomen who did not give birth in the past 12 months Now married:
100.0% (11)Unmarried:
0.0% (0)
Marital status - Two or more races population 15 years and over
Males 53.4% Never married43.6% Now married0.0% Separated2.6% Widowed0.4% DivorcedFemales 18.5% Never married72.4% Now married0.0% Separated7.0% Widowed2.1% DivorcedWomen who gave birth in the past 12 months Now married:
100.0% (39)Unmarried:
0.0% (0)
Women who did not give birth in the past 12 months Now married:
64.4% (151)Unmarried:
35.6% (84)
Marital status - White alone, not Hispanic / Latino population 15 years and over
Males 32.7% Never married56.7% Now married0.4% Separated2.8% Widowed7.4% DivorcedFemales 27.3% Never married53.3% Now married0.6% Separated7.9% Widowed11.0% DivorcedWomen who gave birth in the past 12 months Now married:
60.2% (197)Unmarried:
39.8% (130)
Women who did not give birth in the past 12 months Now married:
44.4% (2,912)Unmarried:
55.6% (3,653)
Marital status - Hispanic or Latino population 15 years and over
Males 22.0% Never married62.5% Now married0.0% Separated0.0% Widowed15.5% DivorcedFemales 24.3% Never married61.3% Now married0.0% Separated14.4% Widowed0.0% DivorcedWomen who did not give birth in the past 12 months Now married:
61.4% (42)Unmarried:
38.6% (27)
Ancestries in Stow
2,416 17.7% German1,552 11.4% English1,355 9.9% Italian1,044 7.6% American880 6.4% Irish824 6.0% European415 3.0% Polish152 1.1% Slovak151 1.1% Lebanese142 1.0% Hungarian126 0.9% Serbian125 0.9% Croatian116 0.8% Scotch-Irish110 0.8% Scottish103 0.8% Arab95 0.7% Slovene84 0.6% British79 0.6% Eastern European77 0.6% Dutch76 0.6% African71 0.5% Iraqi67 0.5% Russian66 0.5% Nigerian44 0.3% Welsh42 0.3% Turkish40 0.3% Czech38 0.3% Austrian35 0.3% Swedish35 0.3% Ukrainian33 0.2% Finnish27 0.2% Swiss24 0.2% Portuguese23 0.2% Canadian20 0.1% Bahamian19 0.1% French16 0.1% Danish16 0.1% Yugoslavian15 0.1% Lithuanian13 0.10% Belgian13 0.10% Pennsylvania German12 0.09% Czechoslovakian11 0.08% French Canadian9 0.07% Romanian7 0.05% Greek6 0.04% Armenian4 0.03% Iranian
Geographical mobility in Stow Same house 1 year ago 26,379 88.4% White (Caucasian)937 86.5% Black or African American22 100.0% American Indian / Alaska Native1,028 81.5% Asian78 73.4% Other race1,301 86.2% Two or more races26,214 88.3% White alone, not Hispanic / Latino328 91.1% Hispanic or LatinoMoved within same county 1,937 6.5% White / Caucasian75 7.0% Black or African American224 17.8% Asian14 13.3% Other race53 3.5% Two or more races1,987 6.7% White alone, not Hispanic / Latino8 2.2% Hispanic or LatinoMoved within same state 799 2.7% White / Caucasian44 4.1% Black or African American20 1.6% Asian15 13.8% Other race54 3.6% Two or more races787 2.7% White alone, not Hispanic / Latino21 5.8% Hispanic or LatinoMoved from different state 629 2.1% White / Caucasian17 1.5% Black or African American18 1.4% Asian37 2.4% Two or more races629 2.1% White alone, not Hispanic / LatinoMoved from abroad 94 0.3% White16 1.5% Black or African American100 0.3% White alone, not Hispanic / Latino
Children Nativity (place of birth) in Stow
Children under 6 years - Living with two parents Both parents native 1,328 100.0% NativeBoth parents foreign-born 260 92.5% Native21 7.5% Foreign-bornOne native, one foreign-born parent 70 100.0% NativeChildren under 6 years - Living with one parent Native parent 453 100.0% NativeForeign-born parent 54 100.0% NativeChildren 6 to 17 years - Living with two parents Both parents native 3,257 99.9% Native2 0.1% Foreign-bornBoth parents foreign-born 167 81.0% Native39 19.0% Foreign-bornOne native, one foreign-born parent 203 100.0% NativeChildren 6 to 17 years - Living with one parent Native parent 954 99.4% Native5 0.6% Foreign-bornForeign-born parent 28 65.7% Native15 34.3% Foreign-born
Grandparents responsible for own grandchildren in Stow
Grandparents (30 to 59 years) White / Caucasian 66 45.5% Responsible for grandchildren80 54.5% Not responsible for grandchildrenBlack or African American 33 100.0% Responsible for grandchildrenWhite alone, not Hispanic / Latino 67 45.7% Responsible for grandchildren80 54.3% Not responsible for grandchildrenGrandparents (60 years and over) White / Caucasian 48 26.5% Responsible for grandchildren134 73.5% Not responsible for grandchildrenWhite alone, not Hispanic / Latino 48 26.4% Responsible for grandchildren135 73.6% Not responsible for grandchildren