Races in St. George, Utah (UT) Detailed Stats
Data:
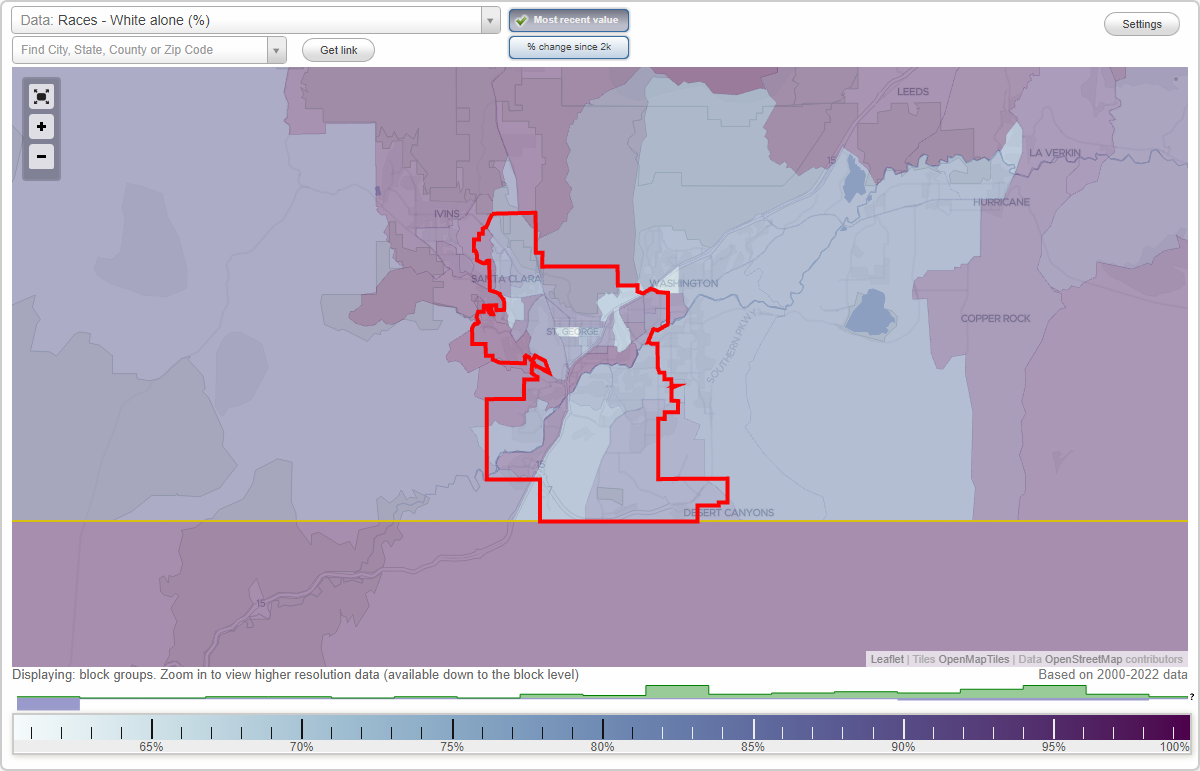
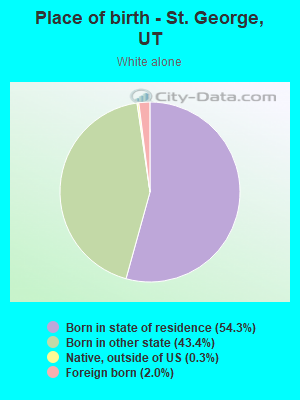
Races - White alone (%)
Races - White alone (% change since 2000)
Races - Black alone (%)
Races - Black alone (% change since 2000)
Races - American Indian alone (%)
Races - American Indian alone (% change since 2000)
Races - Asian alone (%)
Races - Asian alone (% change since 2000)
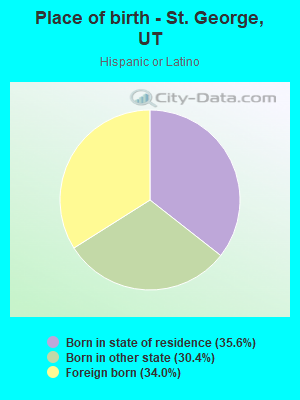
Races - Hispanic (%)
Races - Hispanic (% change since 2000)
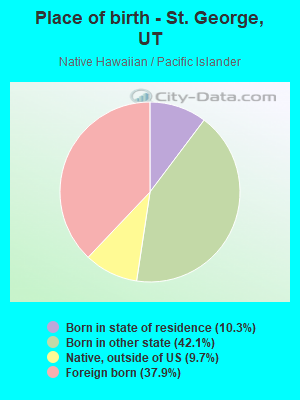
Races - Native Hawaiian and Other Pacific Islander alone (%)
Races - Native Hawaiian and Other Pacific Islander alone (% change since 2000)
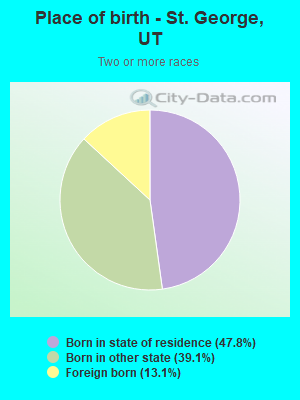
Races - Two or more races(%)
Races - Two or more races(% change since 2000)
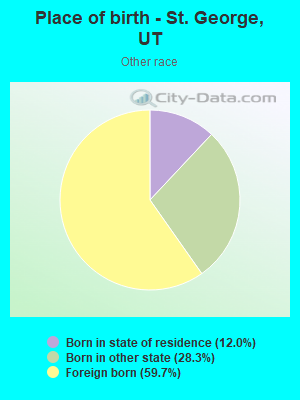
Races - Other race alone (%)
Races - Other race alone (% change since 2000)
Racial diversity
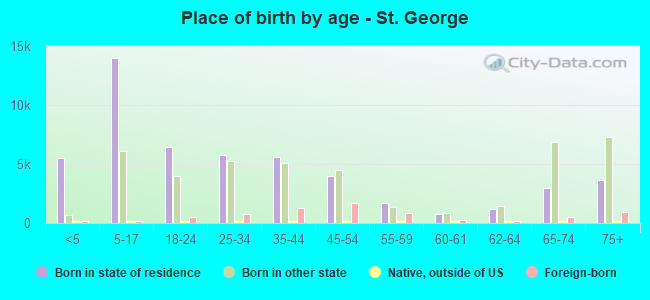
Place of birth - Born in state of residence (%)
Place of birth - Born in state of residence (%) - White
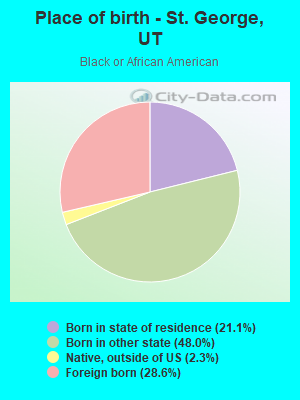
Place of birth - Born in state of residence (%) - Black or African American
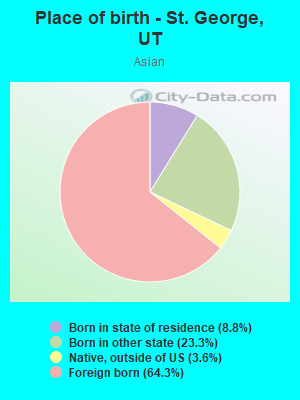
Place of birth - Born in state of residence (%) - Asian
Place of birth - Born in state of residence (%) - Hispanic or Latino
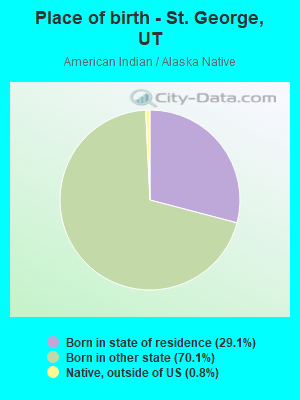
Place of birth - Born in state of residence (%) - American Indian and Alaska Native
Place of birth - Born in state of residence (%) - Multirace
Place of birth - Born in state of residence (%) - Other Race
Place of birth - Born in other state (%)
Place of birth - Born in other state (%) - White
Place of birth - Born in other state (%) - Black or African American
Place of birth - Born in other state (%) - Asian
Place of birth - Born in other state (%) - Hispanic or Latino
Place of birth - Born in other state (%) - American Indian and Alaska Native
Place of birth - Born in other state (%) - Multirace
Place of birth - Born in other state (%) - Other Race
Place of birth - Native, outside of US (%)
Place of birth - Native, outside of US (%) - White
Place of birth - Native, outside of US (%) - Black or African American
Place of birth - Native, outside of US (%) - Asian
Place of birth - Native, outside of US (%) - Hispanic or Latino
Place of birth - Native, outside of US (%) - American Indian and Alaska Native
Place of birth - Native, outside of US (%) - Multirace
Place of birth - Native, outside of US (%) - Other Race
Place of birth - Foreign born (%)
Place of birth - Foreign born (%) - White
Place of birth - Foreign born (%) - Black or African American
Place of birth - Foreign born (%) - Asian
Place of birth - Foreign born (%) - Hispanic or Latino
Place of birth - Foreign born (%) - American Indian and Alaska Native
Place of birth - Foreign born (%) - Multirace
Place of birth - Foreign born (%) - Other Race
Residents speaking English at home (%)
Residents speaking English at home - Born in the United States (%)
Residents speaking English at home - Native, born elsewhere (%)
Residents speaking English at home - Foreign born (%)
Residents speaking Spanish at home (%)
Residents speaking Spanish at home - Born in the United States (%)
Residents speaking Spanish at home - Native, born elsewhere (%)
Residents speaking Spanish at home - Foreign born (%)
Residents speaking other language at home (%)
Residents speaking other language at home - Born in the United States (%)
Residents speaking other language at home - Native, born elsewhere (%)
Residents speaking other language at home - Foreign born (%)
Marital status - Never married (%)
Marital status - Now married (%)
Marital status - Separated (%)
Marital status - Widowed (%)
Marital status - Divorced (%)
Ancestries Reported - Arab (%)
Ancestries Reported - Czech (%)
Ancestries Reported - Danish (%)
Ancestries Reported - Dutch (%)
Ancestries Reported - English (%)
Ancestries Reported - French (%)
Ancestries Reported - French Canadian (%)
Ancestries Reported - German (%)
Ancestries Reported - Greek (%)
Ancestries Reported - Hungarian (%)
Ancestries Reported - Irish (%)
Ancestries Reported - Italian (%)
Ancestries Reported - Lithuanian (%)
Ancestries Reported - Norwegian (%)
Ancestries Reported - Polish (%)
Ancestries Reported - Portuguese (%)
Ancestries Reported - Russian (%)
Ancestries Reported - Scotch-Irish (%)
Ancestries Reported - Scottish (%)
Ancestries Reported - Slovak (%)
Ancestries Reported - Subsaharan African (%)
Ancestries Reported - Swedish (%)
Ancestries Reported - Swiss (%)
Ancestries Reported - Ukrainian (%)
Ancestries Reported - United States (%)
Ancestries Reported - Welsh (%)
Ancestries Reported - West Indian (%)
Ancestries Reported - Other (%)
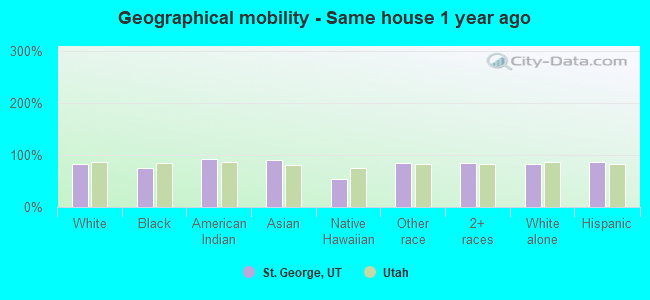
Geographical mobility - Same house 1 year ago (%)
Geographical mobility - Same house 1 year ago (%) - White
Geographical mobility - Same house 1 year ago (%) - Black or African American
Geographical mobility - Same house 1 year ago (%) - Asian
Geographical mobility - Same house 1 year ago (%) - Hispanic or Latino
Geographical mobility - Same house 1 year ago (%) - American Indian and Alaska Native
Geographical mobility - Same house 1 year ago (%) - Multirace
Geographical mobility - Same house 1 year ago (%) - Other Race
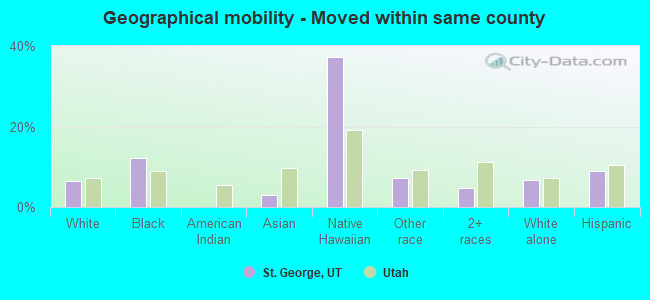
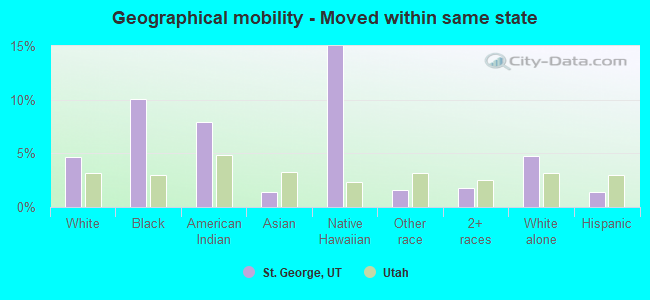
Geographical mobility - Moved within same county (%)
Geographical mobility - Moved within same county (%) - White
Geographical mobility - Moved within same county (%) - Black or African American
Geographical mobility - Moved within same county (%) - Asian
Geographical mobility - Moved within same county (%) - Hispanic or Latino
Geographical mobility - Moved within same county (%) - American Indian and Alaska Native
Geographical mobility - Moved within same county (%) - Multirace
Geographical mobility - Moved within same county (%) - Other Race
Geographical mobility - Moved from different county within same state (%)
Geographical mobility - Moved from different county within same state (%) - White
Geographical mobility - Moved from different county within same state (%) - Black or African American
Geographical mobility - Moved from different county within same state (%) - Asian
Geographical mobility - Moved from different county within same state (%) - Hispanic or Latino
Geographical mobility - Moved from different county within same state (%) - American Indian and Alaska Native
Geographical mobility - Moved from different county within same state (%) - Multirace
Geographical mobility - Moved from different county within same state (%) - Other Race
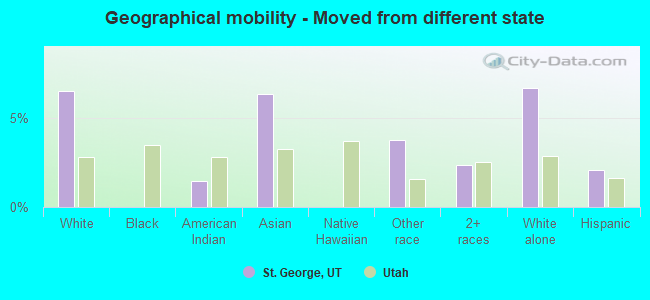
Geographical mobility - Moved from different state (%)
Geographical mobility - Moved from different state (%) - White
Geographical mobility - Moved from different state (%) - Black or African American
Geographical mobility - Moved from different state (%) - Asian
Geographical mobility - Moved from different state (%) - Hispanic or Latino
Geographical mobility - Moved from different state (%) - American Indian and Alaska Native
Geographical mobility - Moved from different state (%) - Multirace
Geographical mobility - Moved from different state (%) - Other Race
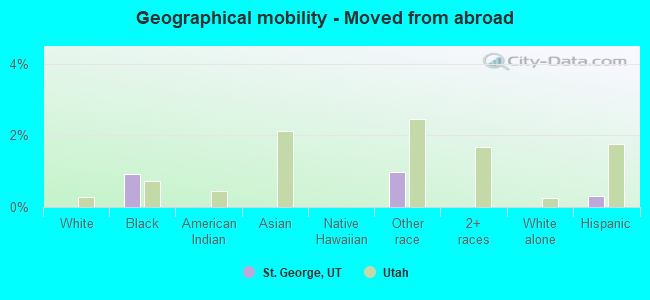
Geographical mobility - Moved from abroad (%)
Geographical mobility - Moved from abroad (%) - White
Geographical mobility - Moved from abroad (%) - Black or African American
Geographical mobility - Moved from abroad (%) - Asian
Geographical mobility - Moved from abroad (%) - Hispanic or Latino
Geographical mobility - Moved from abroad (%) - American Indian and Alaska Native
Geographical mobility - Moved from abroad (%) - Multirace
Geographical mobility - Moved from abroad (%) - Other Race
Place of birth for the foreign-born population - Ireland (%)
Place of birth for the foreign-born population - Denmark (%)
Place of birth for the foreign-born population - Norway (%)
Place of birth for the foreign-born population - Sweden (%)
Place of birth for the foreign-born population - United Kingdom (%)
Place of birth for the foreign-born population - England (%)
Place of birth for the foreign-born population - Scotland (%)
Place of birth for the foreign-born population - Other Northern Europe (%)
Place of birth for the foreign-born population - Austria (%)
Place of birth for the foreign-born population - Belgium (%)
Place of birth for the foreign-born population - France (%)
Place of birth for the foreign-born population - Germany (%)
Place of birth for the foreign-born population - Netherlands (%)
Place of birth for the foreign-born population - Switzerland (%)
Place of birth for the foreign-born population - Other Western Europe (%)
Place of birth for the foreign-born population - Greece (%)
Place of birth for the foreign-born population - Italy (%)
Place of birth for the foreign-born population - Portugal (%)
Place of birth for the foreign-born population - Spain (%)
Place of birth for the foreign-born population - Other Southern Europe (%)
Place of birth for the foreign-born population - Albania (%)
Place of birth for the foreign-born population - Belarus (%)
Place of birth for the foreign-born population - Bosnia and Herzegovina (%)
Place of birth for the foreign-born population - Bulgaria (%)
Place of birth for the foreign-born population - Croatia (%)
Place of birth for the foreign-born population - Czechoslovakia (%)
Place of birth for the foreign-born population - Hungary (%)
Place of birth for the foreign-born population - Latvia (%)
Place of birth for the foreign-born population - Lithuania (%)
Place of birth for the foreign-born population - North Macedonia (Macedonia) (%)
Place of birth for the foreign-born population - Moldova (%)
Place of birth for the foreign-born population - Poland (%)
Place of birth for the foreign-born population - Romania (%)
Place of birth for the foreign-born population - Russia (%)
Place of birth for the foreign-born population - Serbia (%)
Place of birth for the foreign-born population - Ukraine (%)
Place of birth for the foreign-born population - Other Eastern Europe (%)
Place of birth for the foreign-born population - China (%)
Place of birth for the foreign-born population - Hong Kong (%)
Place of birth for the foreign-born population - Taiwan (%)
Place of birth for the foreign-born population - Japan (%)
Place of birth for the foreign-born population - Korea (%)
Place of birth for the foreign-born population - Other Eastern Asia (%)
Place of birth for the foreign-born population - Afghanistan (%)
Place of birth for the foreign-born population - Bangladesh (%)
Place of birth for the foreign-born population - India (%)
Place of birth for the foreign-born population - Iran (%)
Place of birth for the foreign-born population - Kazakhstan (%)
Place of birth for the foreign-born population - Nepal (%)
Place of birth for the foreign-born population - Pakistan (%)
Place of birth for the foreign-born population - Sri Lanka (%)
Place of birth for the foreign-born population - Uzbekistan (%)
Place of birth for the foreign-born population - Other South Central Asia (%)
Place of birth for the foreign-born population - Burma (%)
Place of birth for the foreign-born population - Cambodia (%)
Place of birth for the foreign-born population - Indonesia (%)
Place of birth for the foreign-born population - Laos (%)
Place of birth for the foreign-born population - Malaysia (%)
Place of birth for the foreign-born population - Philippines (%)
Place of birth for the foreign-born population - Singapore (%)
Place of birth for the foreign-born population - Thailand (%)
Place of birth for the foreign-born population - Vietnam (%)
Place of birth for the foreign-born population - Other South Eastern Asia (%)
Place of birth for the foreign-born population - Armenia (%)
Place of birth for the foreign-born population - Iraq (%)
Place of birth for the foreign-born population - Israel (%)
Place of birth for the foreign-born population - Jordan (%)
Place of birth for the foreign-born population - Kuwait (%)
Place of birth for the foreign-born population - Lebanon (%)
Place of birth for the foreign-born population - Saudi Arabia (%)
Place of birth for the foreign-born population - Syria (%)
Place of birth for the foreign-born population - Turkey (%)
Place of birth for the foreign-born population - Yemen (%)
Place of birth for the foreign-born population - Other Western Asia (%)
Place of birth for the foreign-born population - Eritrea (%)
Place of birth for the foreign-born population - Ethiopia (%)
Place of birth for the foreign-born population - Kenya (%)
Place of birth for the foreign-born population - Somalia (%)
Place of birth for the foreign-born population - Uganda (%)
Place of birth for the foreign-born population - Zimbabwe (%)
Place of birth for the foreign-born population - Other Eastern Africa (%)
Place of birth for the foreign-born population - Cameroon (%)
Place of birth for the foreign-born population - Congo (%)
Place of birth for the foreign-born population - Democratic Republic of Congo (Zaire) (%)
Place of birth for the foreign-born population - Other Middle Africa (%)
Place of birth for the foreign-born population - Egypt (%)
Place of birth for the foreign-born population - Morocco (%)
Place of birth for the foreign-born population - Sudan (%)
Place of birth for the foreign-born population - Other Northern Africa (%)
Place of birth for the foreign-born population - South Africa (%)
Place of birth for the foreign-born population - Other Southern Africa (%)
Place of birth for the foreign-born population - Cabo Verde (%)
Place of birth for the foreign-born population - Ghana (%)
Place of birth for the foreign-born population - Liberia (%)
Place of birth for the foreign-born population - Nigeria (%)
Place of birth for the foreign-born population - Senegal (%)
Place of birth for the foreign-born population - Sierra Leone (%)
Place of birth for the foreign-born population - Other Western Africa (%)
Place of birth for the foreign-born population - Australia (%)
Place of birth for the foreign-born population - New Zealand (%)
Place of birth for the foreign-born population - Fiji (%)
Place of birth for the foreign-born population - Micronesia (%)
Place of birth for the foreign-born population - Bahamas (%)
Place of birth for the foreign-born population - Barbados (%)
Place of birth for the foreign-born population - Cuba (%)
Place of birth for the foreign-born population - Dominica (%)
Place of birth for the foreign-born population - Dominican Republic (%)
Place of birth for the foreign-born population - Grenada (%)
Place of birth for the foreign-born population - Haiti (%)
Place of birth for the foreign-born population - Jamaica (%)
Place of birth for the foreign-born population - St. Vincent and the Grenadines (%)
Place of birth for the foreign-born population - Trinidad and Tobago (%)
Place of birth for the foreign-born population - West Indies (%)
Place of birth for the foreign-born population - Other Caribbean (%)
Place of birth for the foreign-born population - Belize (%)
Place of birth for the foreign-born population - Costa Rica (%)
Place of birth for the foreign-born population - El Salvador (%)
Place of birth for the foreign-born population - Guatemala (%)
Place of birth for the foreign-born population - Honduras (%)
Place of birth for the foreign-born population - Mexico (%)
Place of birth for the foreign-born population - Nicaragua (%)
Place of birth for the foreign-born population - Panama (%)
Place of birth for the foreign-born population - Other Central America (%)
Place of birth for the foreign-born population - Argentina (%)
Place of birth for the foreign-born population - Bolivia (%)
Place of birth for the foreign-born population - Brazil (%)
Place of birth for the foreign-born population - Chile (%)
Place of birth for the foreign-born population - Colombia (%)
Place of birth for the foreign-born population - Ecuador (%)
Place of birth for the foreign-born population - Guyana (%)
Place of birth for the foreign-born population - Peru (%)
Place of birth for the foreign-born population - Uruguay (%)
Place of birth for the foreign-born population - Venezuela (%)
Place of birth for the foreign-born population - Other South America (%)
Place of birth for the foreign-born population - Canada (%)
Place of birth for the foreign-born population - Other Northern America (%)
Place of birth for the foreign-born population - Other (%)
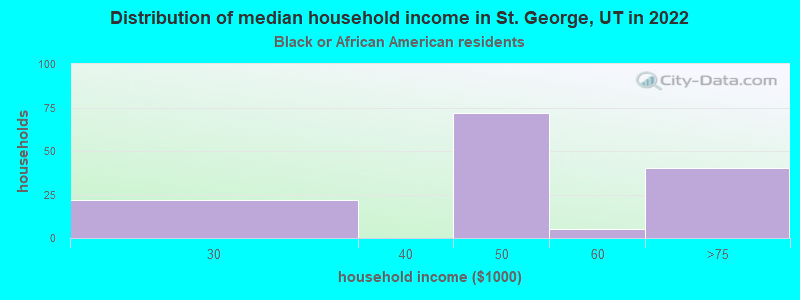
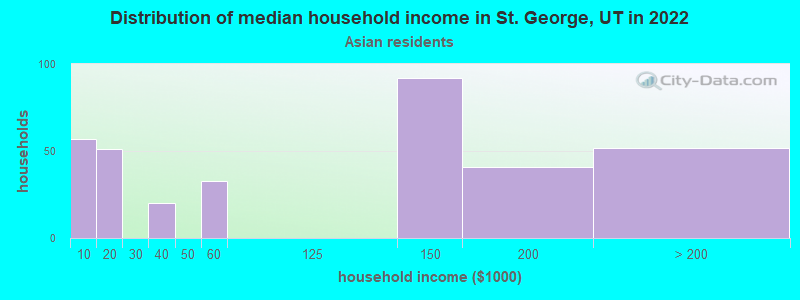
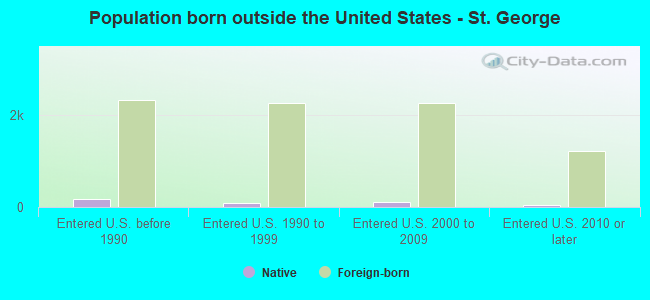
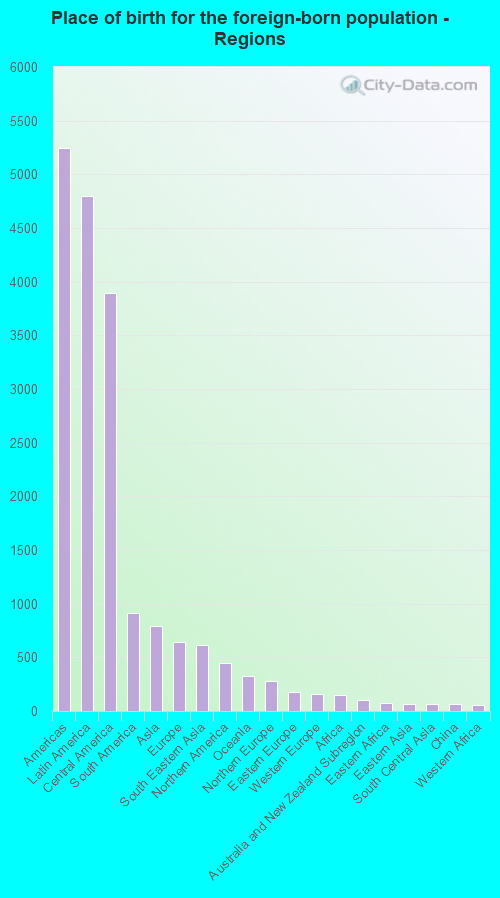
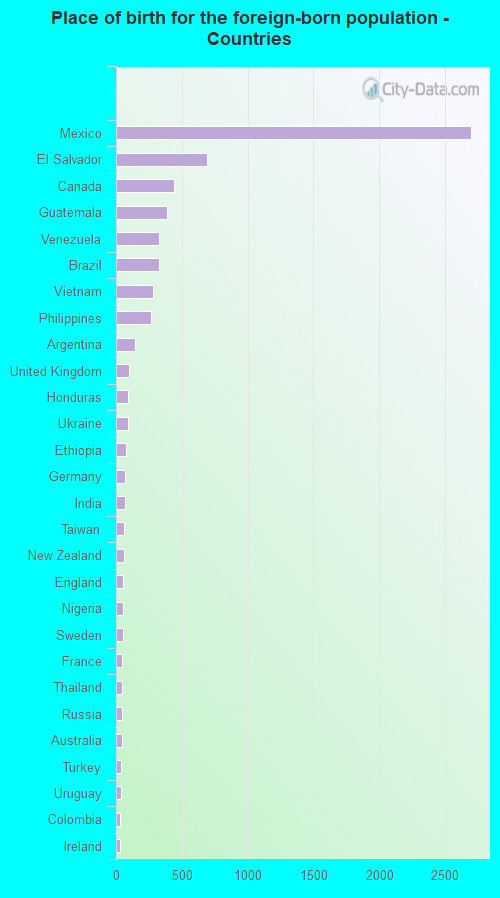
According to 2022 data, the most numerous races in St. George, UT are White alone (83,623 residents), Hispanic (11,128 residents), and Two or more races (3,836 residents). 87.5% of St. George residents speak English at home. 6.9% of St. George, UT residents are foreign-born (4.7% born in Latin America, 0.8% born in Asia), which is 15.9% less than the foreign-born rate of 8.0% across the entire state of Utah.
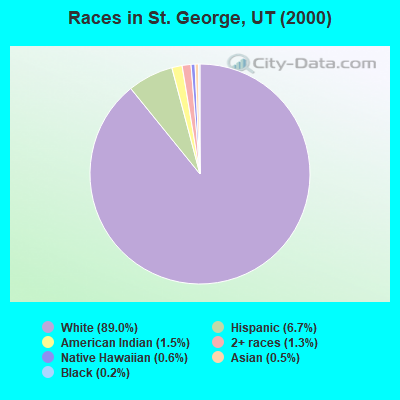
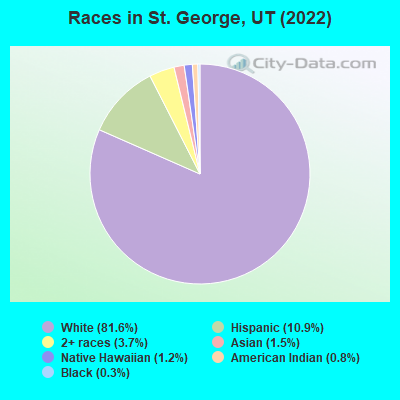
Race distribution in St. George
2000 2022
1,904,265 85.3% White alone 201,559 9.0% Hispanic 36,483 1.6% Asian alone 31,308 1.4% Two or more races 26,663 1.2% American Indian alone 14,806 0.7% Native Hawaiian and Other 16,137 0.7% Black alone 1,948 0.09% Other race alone
2,557,466 75.6% White alone 512,086 15.1% Hispanic 119,308 3.5% Two or more races 82,388 2.4% Asian alone 36,978 1.1% Native Hawaiian and Other 34,873 1.0% Black alone 22,803 0.7% American Indian alone 14,898 0.4% Other race alone
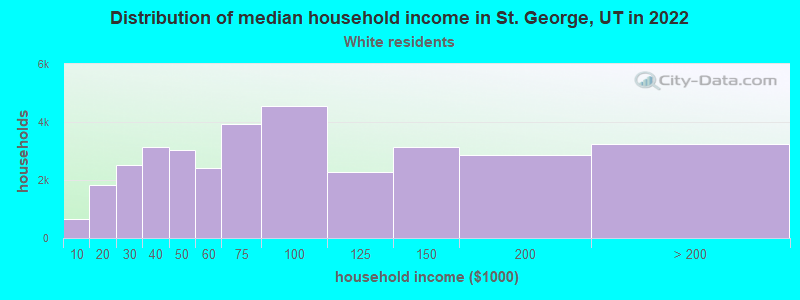
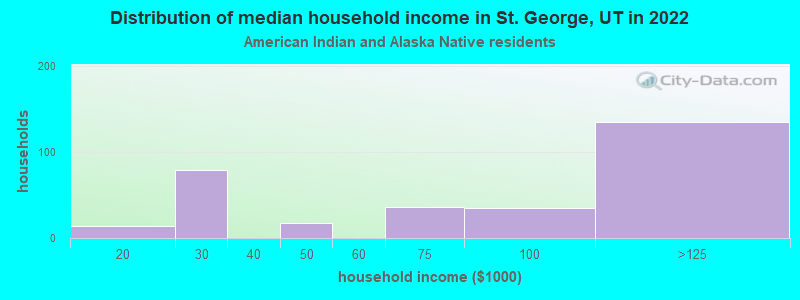
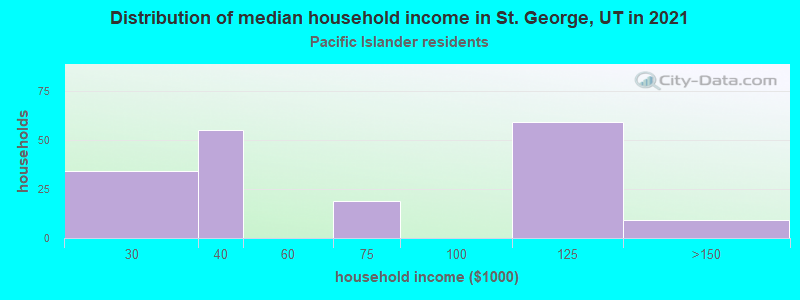
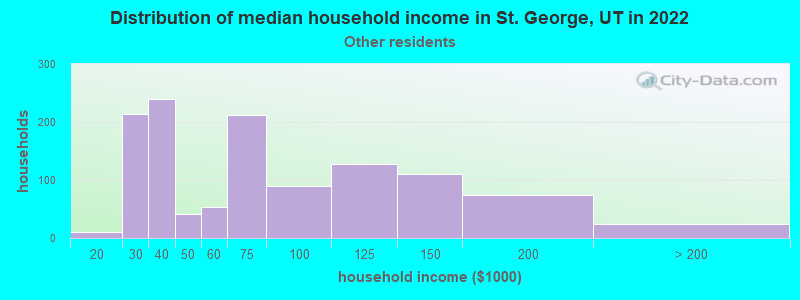
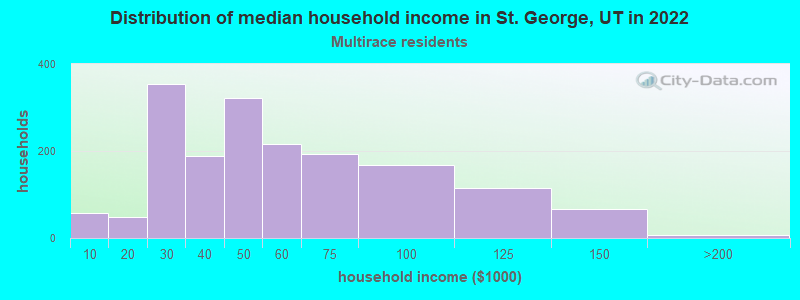
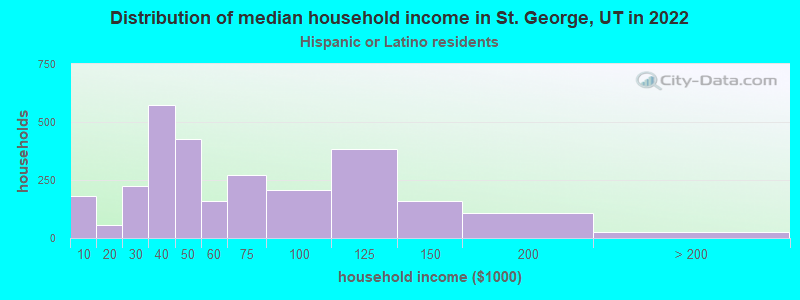
Income and house value in St. George Median household income in 2022 $71,564 White non-Hispanic householders$100,070 Native Hawaiian and other Pacific Islander householders$67,967 Some other race householders$42,063 Two or more races householders$43,639 Hispanic or Latino race householdersMedian 2022 house value $544,957 White Non-Hispanic householders$426,933 Black or African American householders$374,183 American Indian or Alaska Native householders $395,815 Asian householders$569,245 Native Hawaiian and other Pacific Islander householders$477,027 Some other race householders$607,194 Two or more races householders$530,156 Hispanic or Latino householders
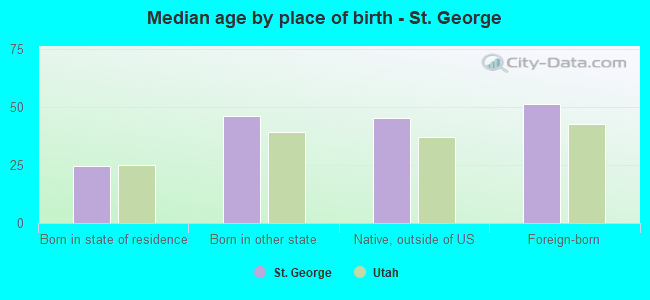
Median age by race in St. George
39.2 Median age for White residents38.1 40.2 22.7 Median age for Black or African American residents23.0 19.1 56.4 Median age for American Indian / Alaska Native residents56.3 56.4 27.4 Median age for Asian residents18.9 27.9 48.5 Median age for Native Hawaiian / Pacific Islander residents49.4 39.7 31.1 Median age for Other race residents23.9 51.0 15.9 Median age for Two or more races residents15.2 29.5 39.4 Median age for White alone residents38.6 40.3 23.9 Median age for Hispanic or Latino residents18.4 36.9
Owner/renter occupied households by race in St. George
House owners and renters - White residents 24,213 72.1% Owner occupied9,383 27.9% Renter occupiedHouse owners and renters - Black or African American residents 65 54.8% Owner occupied53 45.2% Renter occupiedHouse owners and renters - American Indian / Alaska Native residents 132 44.7% Owner occupied163 55.3% Renter occupiedHouse owners and renters - Asian residents 361 100.0% Owner occupiedHouse owners and renters - Native Hawaiian / Pacific Islander residents 155 53.6% Owner occupied134 46.4% Renter occupiedHouse owners and renters - Other race residents 625 65.7% Owner occupied326 34.3% Renter occupiedHouse owners and renters - Two or more races residents 1,177 58.5% Owner occupied835 41.5% Renter occupiedHouse owners and renters - White alone residents 23,950 71.9% Owner occupied9,343 28.1% Renter occupiedHouse owners and renters - Hispanic or Latino residents 1,365 64.4% Owner occupied753 35.6% Renter occupied
Language usage in St. George
English speakers - Total 87.5% of residents of St. George speak English at home.
8.3% of residents speak Spanish at home 5,457 68.0% Speak English very well2,569 32.0% Speak English less than very well4.1% of residents speak other language at home 2,766 69.5% Speak English very well1,212 30.5% Speak English less than very well
English speakers - Born in the United States 92.3% of residents of St. George speak English at home.
6.3% of residents speak Spanish at home 2,274 85.2% Speak English very well394 14.8% Speak English less than very well1.5% of residents speak other language at home 328 51.7% Speak English very well306 48.3% Speak English less than very well
English speakers - Native, born elsewhere 61.9% of residents of St. George speak English at home.
38.1% of residents speak other language at home 161 100.0% Speak English very well
English speakers - Foreign-born 30.7% of residents of St. George speak English at home.
43.0% of residents speak Spanish at home 1,181 38.7% Speak English very well1,874 61.3% Speak English less than very well26.3% of residents speak other language at home 961 51.5% Speak English very well906 48.5% Speak English less than very well
White (Caucasian) - Speak only English Native:
96.9% (75,569)Foreign-born:
76.8% (1,450)
White (Caucasian) - Speak another language Native:
3.1% (2,437)Foreign-born:
23.2% (437)
Black or African American - Speak only English Native:
85.8% (406)Foreign-born:
80.6% (149)
Black or African American - Speak another language Native:
9.9% (47)Foreign-born:
28.0% (52)
Asian - Speak only English Native:
45.6% (179)Foreign-born:
17.2% (174)
Asian - Speak another language Native:
61.9% (243)Foreign-born:
83.4% (841)
Native Hawaiian / Pacific Islander - Speak only English Native:
63.7% (460)Foreign-born:
3.7% (10)
Native Hawaiian / Pacific Islander - Speak another language Native:
36.8% (265)Foreign-born:
100.0% (272)
Other race - Speak only English Native:
28.2% (422)Foreign-born:
22.2% (526)
Other race - Speak another language Native:
71.8% (1,077)Foreign-born:
77.8% (1,840)
Two or more races - Speak only English Native:
60.0% (4,227)Foreign-born:
13.1% (154)
Two or more races - Speak another language Native:
40.0% (2,819)Foreign-born:
86.9% (1,026)
White alone - Speak only English Native:
97.4% (74,754)Foreign-born:
85.0% (1,407)
White alone - Speak another language Native:
2.6% (2,000)Foreign-born:
15.0% (248)
Hispanic or Latino - Speak only English Native:
35.5% (2,405)Foreign-born:
19.1% (723)
Hispanic or Latino - Speak another language Native:
64.5% (4,371)Foreign-born:
80.9% (3,055)
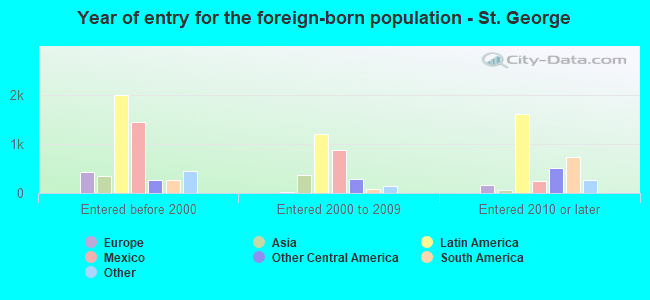
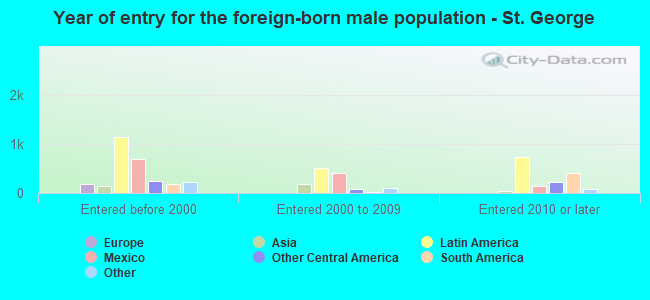
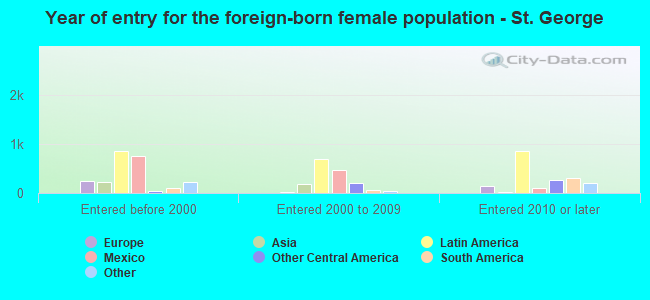
Foreign-born residents in St. George 7,159 residents are foreign born (4.7% Latin America , 0.8% Asia ).
Marital status for residents in St. George Marital status - White (Caucasian) population 15 years and over
Males 26.3% Never married62.9% Now married0.8% Separated2.9% Widowed7.1% DivorcedFemales 21.4% Never married57.6% Now married1.1% Separated9.1% Widowed10.7% DivorcedWomen who gave birth in the past 12 months Now married:
89.6% (1,666)Unmarried:
10.4% (194)
Women who did not give birth in the past 12 months Now married:
50.4% (8,003)Unmarried:
49.6% (7,885)
Marital status - Black or African American population 15 years and over
Males 46.3% Never married31.5% Now married2.4% Separated0.0% Widowed19.9% DivorcedFemales 99.1% Never married0.9% Now married0.0% Separated0.0% Widowed0.0% DivorcedWomen who did not give birth in the past 12 months Now married:
0.0% (0)Unmarried:
100.0% (232)
Marital status - American Indian / Alaska Native population 15 years and over
Males 31.6% Never married62.4% Now married0.0% Separated0.0% Widowed6.0% DivorcedFemales 36.6% Never married55.0% Now married0.0% Separated1.3% Widowed7.1% DivorcedWomen who did not give birth in the past 12 months Now married:
51.2% (232)Unmarried:
48.8% (221)
Marital status - Asian population 15 years and over
Males 49.2% Never married35.6% Now married0.0% Separated0.0% Widowed15.3% DivorcedFemales 13.8% Never married66.9% Now married0.0% Separated0.0% Widowed19.2% DivorcedWomen who did not give birth in the past 12 months Now married:
78.4% (186)Unmarried:
21.6% (51)
Marital status - Native Hawaiian / Pacific Islander population 15 years and over
Males 39.6% Never married38.2% Now married12.0% Separated6.9% Widowed3.2% DivorcedFemales 71.9% Never married15.7% Now married0.0% Separated3.0% Widowed9.4% DivorcedWomen who did not give birth in the past 12 months Now married:
13.0% (41)Unmarried:
87.0% (271)
Marital status - Other race population 15 years and over
Males 34.3% Never married65.0% Now married0.0% Separated0.0% Widowed0.8% DivorcedFemales 40.1% Never married48.3% Now married4.6% Separated5.8% Widowed1.3% DivorcedWomen who did not give birth in the past 12 months Now married:
45.3% (545)Unmarried:
54.7% (658)
Marital status - Two or more races population 15 years and over
Males 38.2% Never married52.2% Now married0.0% Separated2.2% Widowed7.5% DivorcedFemales 19.1% Never married47.3% Now married5.2% Separated4.0% Widowed24.3% DivorcedWomen who gave birth in the past 12 months Now married:
65.0% (118)Unmarried:
35.0% (64)
Women who did not give birth in the past 12 months Now married:
45.1% (518)Unmarried:
54.9% (629)
Marital status - White alone, not Hispanic / Latino population 15 years and over
Males 25.9% Never married63.1% Now married0.8% Separated2.9% Widowed7.1% DivorcedFemales 21.6% Never married57.4% Now married1.2% Separated9.1% Widowed10.9% DivorcedWomen who gave birth in the past 12 months Now married:
89.6% (1,666)Unmarried:
10.4% (194)
Women who did not give birth in the past 12 months Now married:
49.9% (7,758)Unmarried:
50.1% (7,797)
Marital status - Hispanic or Latino population 15 years and over
Males 53.5% Never married41.8% Now married0.0% Separated0.0% Widowed4.7% DivorcedFemales 19.1% Never married55.6% Now married5.1% Separated2.9% Widowed17.3% DivorcedWomen who gave birth in the past 12 months Now married:
37.6% (39)Unmarried:
62.4% (64)
Women who did not give birth in the past 12 months Now married:
56.7% (1,400)Unmarried:
43.3% (1,068)
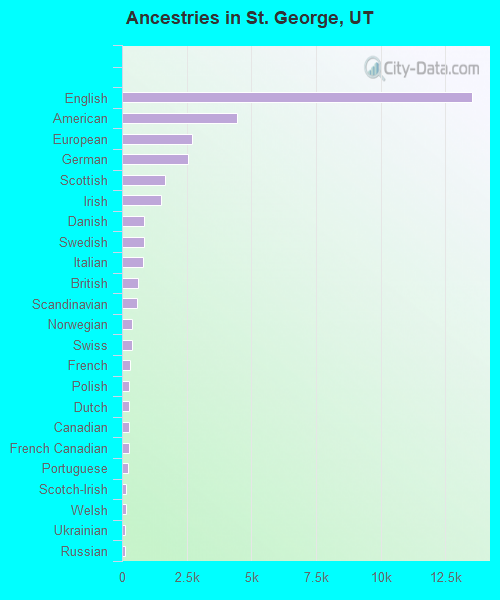
Ancestries in St. George
13,507 27.5% English4,433 9.0% American2,689 5.5% European2,552 5.2% German1,646 3.3% Scottish1,511 3.1% Irish865 1.8% Danish836 1.7% Swedish830 1.7% Italian602 1.2% British597 1.2% Scandinavian378 0.8% Norwegian368 0.7% Swiss293 0.6% French278 0.6% Polish274 0.6% Dutch265 0.5% Canadian252 0.5% French Canadian240 0.5% Portuguese156 0.3% Scotch-Irish144 0.3% Welsh135 0.3% Ukrainian130 0.3% Russian119 0.2% Egyptian102 0.2% Northern European98 0.2% Eastern European78 0.2% Ethiopian66 0.1% Brazilian56 0.1% Finnish39 0.08% Czech37 0.08% Jamaican34 0.07% Slovak33 0.07% Pennsylvania German32 0.07% Hungarian30 0.06% Austrian24 0.05% Greek21 0.04% Romanian20 0.04% African20 0.04% Turkish16 0.03% Croatian6 0.01% Australian
Geographical mobility in St. George Same house 1 year ago 68,844 82.3% White (Caucasian)505 75.5% Black or African American1,389 92.9% American Indian / Alaska Native1,077 89.7% Asian548 53.7% Native Hawaiian / Pacific Islander3,839 85.4% Other race6,789 85.6% Two or more races67,311 82.0% White alone, not Hispanic / Latino10,726 86.6% Hispanic or LatinoMoved within same county 5,464 6.5% White / Caucasian81 12.1% Black or African American34 2.9% Asian381 37.3% Native Hawaiian / Pacific Islander322 7.2% Other race378 4.8% Two or more races5,423 6.6% White alone, not Hispanic / Latino1,099 8.9% Hispanic or LatinoMoved within same state 3,906 4.7% White / Caucasian67 10.1% Black or African American118 7.9% American Indian / Alaska Native17 1.4% Asian153 15.0% Native Hawaiian / Pacific Islander73 1.6% Other race138 1.7% Two or more races3,906 4.8% White alone, not Hispanic / Latino169 1.4% Hispanic or LatinoMoved from different state 5,443 6.5% White / Caucasian22 1.5% American Indian / Alaska Native76 6.3% Asian169 3.8% Other race188 2.4% Two or more races5,443 6.6% White alone, not Hispanic / Latino259 2.1% Hispanic or LatinoMoved from abroad 6 0.9% Black or African American44 1.0% Other race39 0.3% Hispanic or Latino
Children Nativity (place of birth) in St. George
Children under 6 years - Living with two parents Both parents native 5,123 100.0% NativeBoth parents foreign-born 448 100.0% NativeOne native, one foreign-born parent 442 89.8% Native50 10.2% Foreign-bornChildren under 6 years - Living with one parent Native parent 1,421 100.0% NativeForeign-born parent 213 100.0% NativeChildren 6 to 17 years - Living with two parents Both parents native 9,812 99.8% Native23 0.2% Foreign-bornBoth parents foreign-born 2,538 89.6% Native295 10.4% Foreign-bornOne native, one foreign-born parent 765 100.0% NativeChildren 6 to 17 years - Living with one parent Native parent 3,276 100.0% NativeForeign-born parent 772 54.8% Native636 45.2% Foreign-born
Grandparents responsible for own grandchildren in St. George
Grandparents (30 to 59 years) White / Caucasian 72 14.3% Responsible for grandchildren435 85.7% Not responsible for grandchildrenAmerican Indian / Alaska Native 34 18.9% Responsible for grandchildren147 81.1% Not responsible for grandchildrenOther race 19 25.4% Responsible for grandchildren57 74.6% Not responsible for grandchildrenWhite alone, not Hispanic / Latino 80 15.8% Responsible for grandchildren424 84.2% Not responsible for grandchildrenHispanic or Latino 17 5.2% Responsible for grandchildren301 94.8% Not responsible for grandchildrenGrandparents (60 years and over) White / Caucasian 116 38.5% Responsible for grandchildren186 61.5% Not responsible for grandchildrenOther race 81 100.0% Not responsible for grandchildrenWhite alone, not Hispanic / Latino 116 40.1% Responsible for grandchildren174 59.9% Not responsible for grandchildrenHispanic or Latino 173 100.0% Not responsible for grandchildren