Races in Springfield, New Jersey (NJ) Detailed Stats
Ancestries, Foreign-born residents, place of birth

Recent posts about races in Springfield, New Jersey on our local forum with over 2,400,000 registered users:
 | Maplewood right next to Irvington - is this house worth it?? (23 replies) |
| Thoughts on Summit? (72 replies) |
| Is Springfield, NJ one of the few true middle class towns left? (52 replies) |
| Asian Indian moving to Hackensack area (10 replies) |
| Which Stores in Northern NJ Have Fresh Sliced Smoked Salmon/Lox? (56 replies) |
| Springfield, NJ - what's it like? (3 replies) |
Latest news about races in Springfield, NJ collected exclusively by city-data.com from local newspapers, TV, and radio stations
20.4% of Springfield, NJ residents are foreign-born (10.7% born in Europe, 4.4% born in Asia, 3.7% born in Latin America), which is 13.0% less than the foreign-born rate of 23.0% across the entire state of New Jersey.
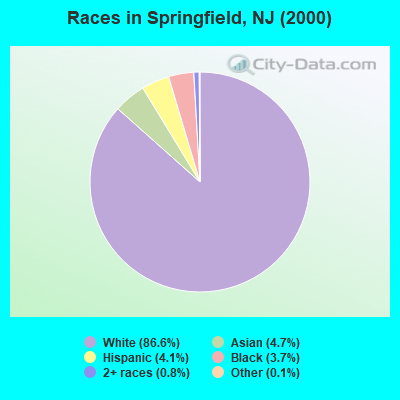
Race distribution in Springfield

- 12,49186.6%White alone
- 6754.7%Asian alone
- 5974.1%Hispanic
- 5363.7%Black alone
- 1100.8%Two or more races
- 180.1%Other race alone
- 20.01%American Indian alone
2000
2022
-
- 5,557,20966.0%White alone
- 1,117,19113.3%Hispanic
- 1,096,17113.0%Black alone
- 477,0125.7%Asian alone
- 133,6891.6%Two or more races
- 19,5650.2%Other race alone
- 11,3380.1%American Indian alone
- 2,1750.03%Native Hawaiian and Other
Pacific Islander alone

-
- 4,766,47651.5%White alone
- 2,028,47021.9%Hispanic
- 1,111,63212.0%Black alone
- 923,54610.0%Asian alone
- 332,2373.6%Two or more races
- 89,8471.0%Other race alone
- 8,5570.09%American Indian alone
- 9340.01%Native Hawaiian and Other
Pacific Islander alone

Income and house value in Springfield
- Median household income in 2022
- $147,235White non-Hispanic householders
- $143,959Black householders
- $70,237American Indian and Alaska Native householders
- $188,602Asian householders
- $143,241Some other race householders
- $167,200Two or more races householders
- $143,053Hispanic or Latino race householders
- Median 2022 house value
- $682,905White Non-Hispanic householders
- $507,254Black or African American householders
- $303,543American Indian or Alaska Native householders
- $666,176Asian householders
- $539,632Two or more races householders
- $652,146Hispanic or Latino householders
Household income for White non-Hispanic householders

Household income for Black householders

Household income for American Indian and Alaska Native householders

Household income for Asian householders

Household income for Two or more races householders

Household income for Hispanic or Latino race householders

Foreign-born residents in Springfield
2,937 residents are foreign born (10.7% Europe, 4.4% Asia, 3.7% Latin America).
| This city: | 20.4% |
| New Jersey: | 17.5% |
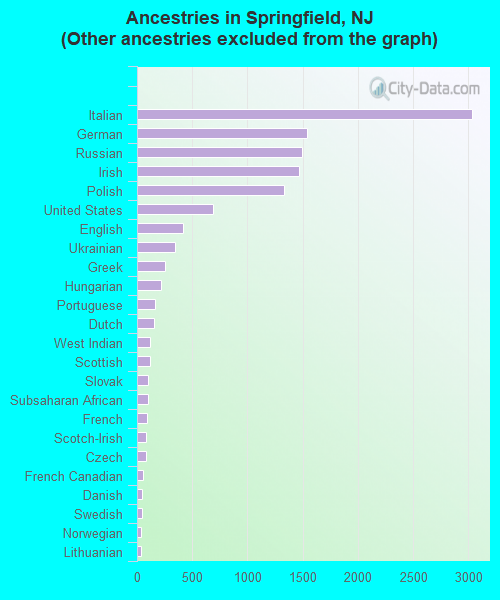
Ancestries in Springfield

- 3,69623.4%Other
- 3,03619.3%Italian
- 1,5389.8%German
- 1,4939.5%Russian
- 1,4719.3%Irish
- 1,3288.4%Polish
- 6894.4%United States
- 4192.7%English
- 3482.2%Ukrainian
- 2501.6%Greek
- 2161.4%Hungarian
- 1651.0%Portuguese
- 1541.0%Dutch
- 1160.7%West Indian
- 1140.7%Scottish
- 1000.6%Slovak
- 960.6%Subsaharan African
- 890.6%French
- 810.5%Scotch-Irish
- 780.5%Czech
- 550.3%French Canadian
- 430.3%Danish
- 410.3%Swedish
- 380.2%Norwegian
- 370.2%Lithuanian
- 260.2%Welsh
- 230.1%Swiss
- 220.1%Arab
Zip codes: 07081.