Races in Spring Lake, North Carolina (NC) Detailed Stats
Data:
Races - White alone (%)
Races - White alone (% change since 2000)
Races - Black alone (%)
Races - Black alone (% change since 2000)
Races - American Indian alone (%)
Races - American Indian alone (% change since 2000)
Races - Asian alone (%)
Races - Asian alone (% change since 2000)
Races - Hispanic (%)
Races - Hispanic (% change since 2000)
Races - Native Hawaiian and Other Pacific Islander alone (%)
Races - Native Hawaiian and Other Pacific Islander alone (% change since 2000)
Races - Two or more races(%)
Races - Two or more races(% change since 2000)
Races - Other race alone (%)
Races - Other race alone (% change since 2000)
Racial diversity
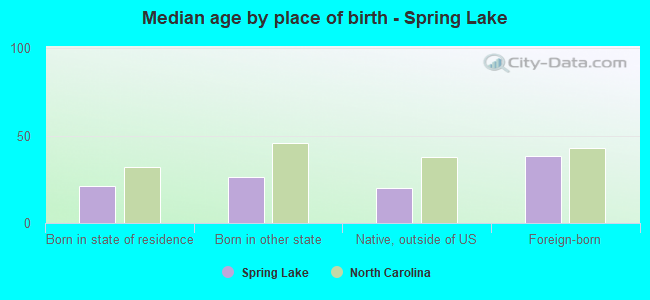
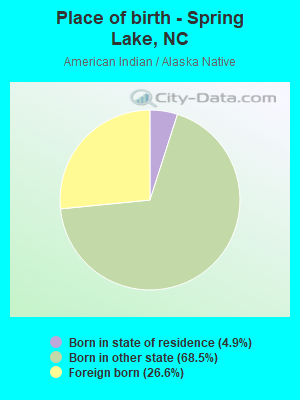
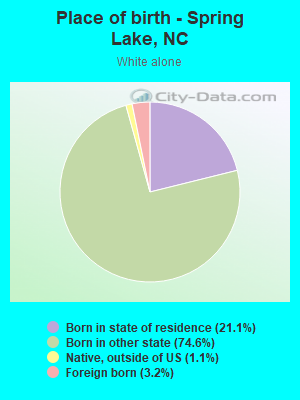
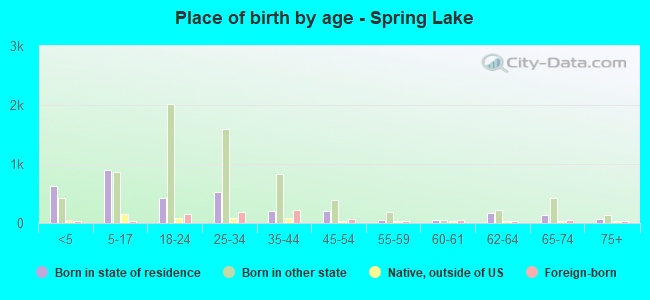
Place of birth - Born in state of residence (%)
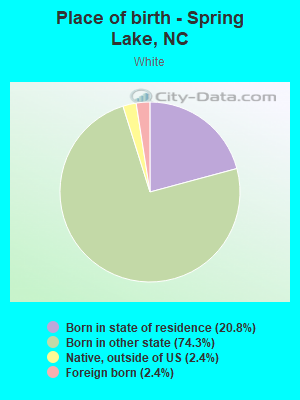
Place of birth - Born in state of residence (%) - White
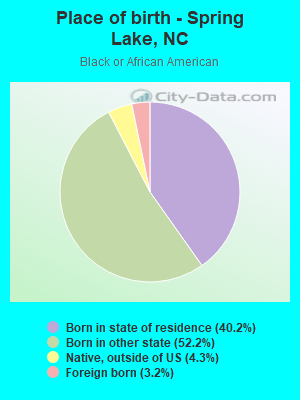
Place of birth - Born in state of residence (%) - Black or African American
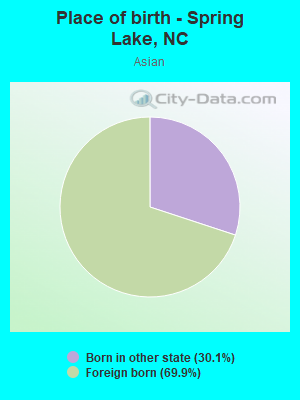
Place of birth - Born in state of residence (%) - Asian
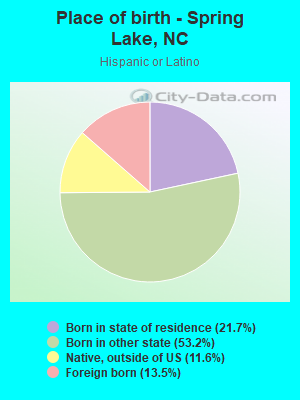
Place of birth - Born in state of residence (%) - Hispanic or Latino
Place of birth - Born in state of residence (%) - American Indian and Alaska Native
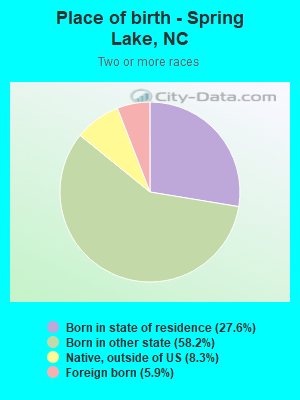
Place of birth - Born in state of residence (%) - Multirace
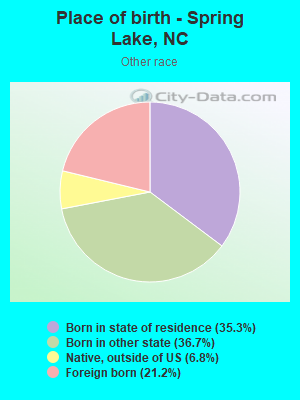
Place of birth - Born in state of residence (%) - Other Race
Place of birth - Born in other state (%)
Place of birth - Born in other state (%) - White
Place of birth - Born in other state (%) - Black or African American
Place of birth - Born in other state (%) - Asian
Place of birth - Born in other state (%) - Hispanic or Latino
Place of birth - Born in other state (%) - American Indian and Alaska Native
Place of birth - Born in other state (%) - Multirace
Place of birth - Born in other state (%) - Other Race
Place of birth - Native, outside of US (%)
Place of birth - Native, outside of US (%) - White
Place of birth - Native, outside of US (%) - Black or African American
Place of birth - Native, outside of US (%) - Asian
Place of birth - Native, outside of US (%) - Hispanic or Latino
Place of birth - Native, outside of US (%) - American Indian and Alaska Native
Place of birth - Native, outside of US (%) - Multirace
Place of birth - Native, outside of US (%) - Other Race
Place of birth - Foreign born (%)
Place of birth - Foreign born (%) - White
Place of birth - Foreign born (%) - Black or African American
Place of birth - Foreign born (%) - Asian
Place of birth - Foreign born (%) - Hispanic or Latino
Place of birth - Foreign born (%) - American Indian and Alaska Native
Place of birth - Foreign born (%) - Multirace
Place of birth - Foreign born (%) - Other Race
Residents speaking English at home (%)
Residents speaking English at home - Born in the United States (%)
Residents speaking English at home - Native, born elsewhere (%)
Residents speaking English at home - Foreign born (%)
Residents speaking Spanish at home (%)
Residents speaking Spanish at home - Born in the United States (%)
Residents speaking Spanish at home - Native, born elsewhere (%)
Residents speaking Spanish at home - Foreign born (%)
Residents speaking other language at home (%)
Residents speaking other language at home - Born in the United States (%)
Residents speaking other language at home - Native, born elsewhere (%)
Residents speaking other language at home - Foreign born (%)
Marital status - Never married (%)
Marital status - Now married (%)
Marital status - Separated (%)
Marital status - Widowed (%)
Marital status - Divorced (%)
Ancestries Reported - Arab (%)
Ancestries Reported - Czech (%)
Ancestries Reported - Danish (%)
Ancestries Reported - Dutch (%)
Ancestries Reported - English (%)
Ancestries Reported - French (%)
Ancestries Reported - French Canadian (%)
Ancestries Reported - German (%)
Ancestries Reported - Greek (%)
Ancestries Reported - Hungarian (%)
Ancestries Reported - Irish (%)
Ancestries Reported - Italian (%)
Ancestries Reported - Lithuanian (%)
Ancestries Reported - Norwegian (%)
Ancestries Reported - Polish (%)
Ancestries Reported - Portuguese (%)
Ancestries Reported - Russian (%)
Ancestries Reported - Scotch-Irish (%)
Ancestries Reported - Scottish (%)
Ancestries Reported - Slovak (%)
Ancestries Reported - Subsaharan African (%)
Ancestries Reported - Swedish (%)
Ancestries Reported - Swiss (%)
Ancestries Reported - Ukrainian (%)
Ancestries Reported - United States (%)
Ancestries Reported - Welsh (%)
Ancestries Reported - West Indian (%)
Ancestries Reported - Other (%)
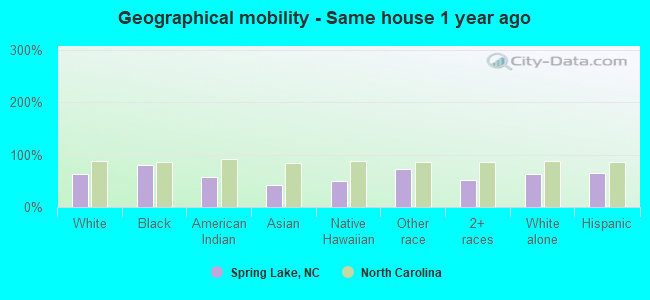
Geographical mobility - Same house 1 year ago (%)
Geographical mobility - Same house 1 year ago (%) - White
Geographical mobility - Same house 1 year ago (%) - Black or African American
Geographical mobility - Same house 1 year ago (%) - Asian
Geographical mobility - Same house 1 year ago (%) - Hispanic or Latino
Geographical mobility - Same house 1 year ago (%) - American Indian and Alaska Native
Geographical mobility - Same house 1 year ago (%) - Multirace
Geographical mobility - Same house 1 year ago (%) - Other Race
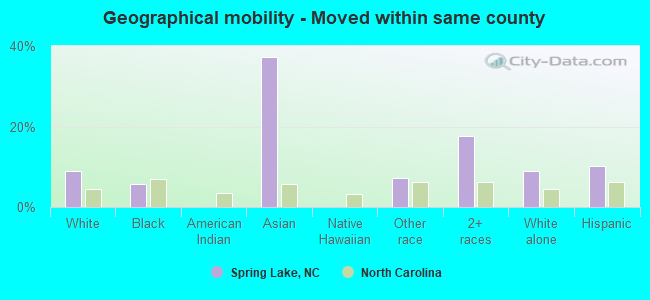
Geographical mobility - Moved within same county (%)
Geographical mobility - Moved within same county (%) - White
Geographical mobility - Moved within same county (%) - Black or African American
Geographical mobility - Moved within same county (%) - Asian
Geographical mobility - Moved within same county (%) - Hispanic or Latino
Geographical mobility - Moved within same county (%) - American Indian and Alaska Native
Geographical mobility - Moved within same county (%) - Multirace
Geographical mobility - Moved within same county (%) - Other Race
Geographical mobility - Moved from different county within same state (%)
Geographical mobility - Moved from different county within same state (%) - White
Geographical mobility - Moved from different county within same state (%) - Black or African American
Geographical mobility - Moved from different county within same state (%) - Asian
Geographical mobility - Moved from different county within same state (%) - Hispanic or Latino
Geographical mobility - Moved from different county within same state (%) - American Indian and Alaska Native
Geographical mobility - Moved from different county within same state (%) - Multirace
Geographical mobility - Moved from different county within same state (%) - Other Race
Geographical mobility - Moved from different state (%)
Geographical mobility - Moved from different state (%) - White
Geographical mobility - Moved from different state (%) - Black or African American
Geographical mobility - Moved from different state (%) - Asian
Geographical mobility - Moved from different state (%) - Hispanic or Latino
Geographical mobility - Moved from different state (%) - American Indian and Alaska Native
Geographical mobility - Moved from different state (%) - Multirace
Geographical mobility - Moved from different state (%) - Other Race
Geographical mobility - Moved from abroad (%)
Geographical mobility - Moved from abroad (%) - White
Geographical mobility - Moved from abroad (%) - Black or African American
Geographical mobility - Moved from abroad (%) - Asian
Geographical mobility - Moved from abroad (%) - Hispanic or Latino
Geographical mobility - Moved from abroad (%) - American Indian and Alaska Native
Geographical mobility - Moved from abroad (%) - Multirace
Geographical mobility - Moved from abroad (%) - Other Race
Place of birth for the foreign-born population - Ireland (%)
Place of birth for the foreign-born population - Denmark (%)
Place of birth for the foreign-born population - Norway (%)
Place of birth for the foreign-born population - Sweden (%)
Place of birth for the foreign-born population - United Kingdom (%)
Place of birth for the foreign-born population - England (%)
Place of birth for the foreign-born population - Scotland (%)
Place of birth for the foreign-born population - Other Northern Europe (%)
Place of birth for the foreign-born population - Austria (%)
Place of birth for the foreign-born population - Belgium (%)
Place of birth for the foreign-born population - France (%)
Place of birth for the foreign-born population - Germany (%)
Place of birth for the foreign-born population - Netherlands (%)
Place of birth for the foreign-born population - Switzerland (%)
Place of birth for the foreign-born population - Other Western Europe (%)
Place of birth for the foreign-born population - Greece (%)
Place of birth for the foreign-born population - Italy (%)
Place of birth for the foreign-born population - Portugal (%)
Place of birth for the foreign-born population - Spain (%)
Place of birth for the foreign-born population - Other Southern Europe (%)
Place of birth for the foreign-born population - Albania (%)
Place of birth for the foreign-born population - Belarus (%)
Place of birth for the foreign-born population - Bosnia and Herzegovina (%)
Place of birth for the foreign-born population - Bulgaria (%)
Place of birth for the foreign-born population - Croatia (%)
Place of birth for the foreign-born population - Czechoslovakia (%)
Place of birth for the foreign-born population - Hungary (%)
Place of birth for the foreign-born population - Latvia (%)
Place of birth for the foreign-born population - Lithuania (%)
Place of birth for the foreign-born population - North Macedonia (Macedonia) (%)
Place of birth for the foreign-born population - Moldova (%)
Place of birth for the foreign-born population - Poland (%)
Place of birth for the foreign-born population - Romania (%)
Place of birth for the foreign-born population - Russia (%)
Place of birth for the foreign-born population - Serbia (%)
Place of birth for the foreign-born population - Ukraine (%)
Place of birth for the foreign-born population - Other Eastern Europe (%)
Place of birth for the foreign-born population - China (%)
Place of birth for the foreign-born population - Hong Kong (%)
Place of birth for the foreign-born population - Taiwan (%)
Place of birth for the foreign-born population - Japan (%)
Place of birth for the foreign-born population - Korea (%)
Place of birth for the foreign-born population - Other Eastern Asia (%)
Place of birth for the foreign-born population - Afghanistan (%)
Place of birth for the foreign-born population - Bangladesh (%)
Place of birth for the foreign-born population - India (%)
Place of birth for the foreign-born population - Iran (%)
Place of birth for the foreign-born population - Kazakhstan (%)
Place of birth for the foreign-born population - Nepal (%)
Place of birth for the foreign-born population - Pakistan (%)
Place of birth for the foreign-born population - Sri Lanka (%)
Place of birth for the foreign-born population - Uzbekistan (%)
Place of birth for the foreign-born population - Other South Central Asia (%)
Place of birth for the foreign-born population - Burma (%)
Place of birth for the foreign-born population - Cambodia (%)
Place of birth for the foreign-born population - Indonesia (%)
Place of birth for the foreign-born population - Laos (%)
Place of birth for the foreign-born population - Malaysia (%)
Place of birth for the foreign-born population - Philippines (%)
Place of birth for the foreign-born population - Singapore (%)
Place of birth for the foreign-born population - Thailand (%)
Place of birth for the foreign-born population - Vietnam (%)
Place of birth for the foreign-born population - Other South Eastern Asia (%)
Place of birth for the foreign-born population - Armenia (%)
Place of birth for the foreign-born population - Iraq (%)
Place of birth for the foreign-born population - Israel (%)
Place of birth for the foreign-born population - Jordan (%)
Place of birth for the foreign-born population - Kuwait (%)
Place of birth for the foreign-born population - Lebanon (%)
Place of birth for the foreign-born population - Saudi Arabia (%)
Place of birth for the foreign-born population - Syria (%)
Place of birth for the foreign-born population - Turkey (%)
Place of birth for the foreign-born population - Yemen (%)
Place of birth for the foreign-born population - Other Western Asia (%)
Place of birth for the foreign-born population - Eritrea (%)
Place of birth for the foreign-born population - Ethiopia (%)
Place of birth for the foreign-born population - Kenya (%)
Place of birth for the foreign-born population - Somalia (%)
Place of birth for the foreign-born population - Uganda (%)
Place of birth for the foreign-born population - Zimbabwe (%)
Place of birth for the foreign-born population - Other Eastern Africa (%)
Place of birth for the foreign-born population - Cameroon (%)
Place of birth for the foreign-born population - Congo (%)
Place of birth for the foreign-born population - Democratic Republic of Congo (Zaire) (%)
Place of birth for the foreign-born population - Other Middle Africa (%)
Place of birth for the foreign-born population - Egypt (%)
Place of birth for the foreign-born population - Morocco (%)
Place of birth for the foreign-born population - Sudan (%)
Place of birth for the foreign-born population - Other Northern Africa (%)
Place of birth for the foreign-born population - South Africa (%)
Place of birth for the foreign-born population - Other Southern Africa (%)
Place of birth for the foreign-born population - Cabo Verde (%)
Place of birth for the foreign-born population - Ghana (%)
Place of birth for the foreign-born population - Liberia (%)
Place of birth for the foreign-born population - Nigeria (%)
Place of birth for the foreign-born population - Senegal (%)
Place of birth for the foreign-born population - Sierra Leone (%)
Place of birth for the foreign-born population - Other Western Africa (%)
Place of birth for the foreign-born population - Australia (%)
Place of birth for the foreign-born population - New Zealand (%)
Place of birth for the foreign-born population - Fiji (%)
Place of birth for the foreign-born population - Micronesia (%)
Place of birth for the foreign-born population - Bahamas (%)
Place of birth for the foreign-born population - Barbados (%)
Place of birth for the foreign-born population - Cuba (%)
Place of birth for the foreign-born population - Dominica (%)
Place of birth for the foreign-born population - Dominican Republic (%)
Place of birth for the foreign-born population - Grenada (%)
Place of birth for the foreign-born population - Haiti (%)
Place of birth for the foreign-born population - Jamaica (%)
Place of birth for the foreign-born population - St. Vincent and the Grenadines (%)
Place of birth for the foreign-born population - Trinidad and Tobago (%)
Place of birth for the foreign-born population - West Indies (%)
Place of birth for the foreign-born population - Other Caribbean (%)
Place of birth for the foreign-born population - Belize (%)
Place of birth for the foreign-born population - Costa Rica (%)
Place of birth for the foreign-born population - El Salvador (%)
Place of birth for the foreign-born population - Guatemala (%)
Place of birth for the foreign-born population - Honduras (%)
Place of birth for the foreign-born population - Mexico (%)
Place of birth for the foreign-born population - Nicaragua (%)
Place of birth for the foreign-born population - Panama (%)
Place of birth for the foreign-born population - Other Central America (%)
Place of birth for the foreign-born population - Argentina (%)
Place of birth for the foreign-born population - Bolivia (%)
Place of birth for the foreign-born population - Brazil (%)
Place of birth for the foreign-born population - Chile (%)
Place of birth for the foreign-born population - Colombia (%)
Place of birth for the foreign-born population - Ecuador (%)
Place of birth for the foreign-born population - Guyana (%)
Place of birth for the foreign-born population - Peru (%)
Place of birth for the foreign-born population - Uruguay (%)
Place of birth for the foreign-born population - Venezuela (%)
Place of birth for the foreign-born population - Other South America (%)
Place of birth for the foreign-born population - Canada (%)
Place of birth for the foreign-born population - Other Northern America (%)
Place of birth for the foreign-born population - Other (%)
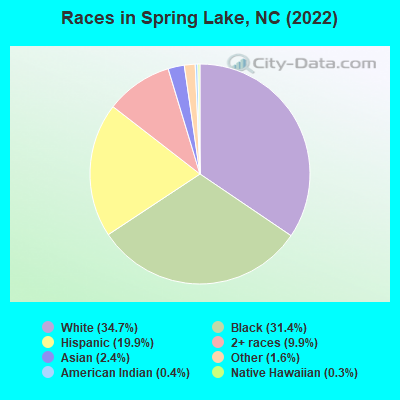
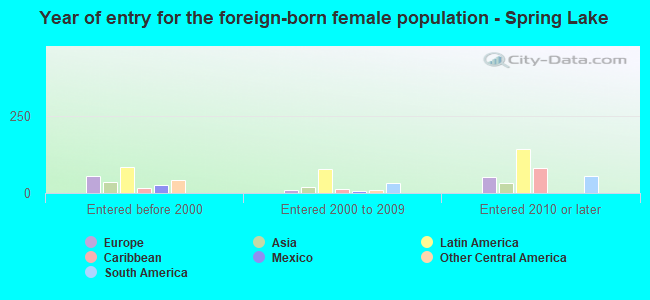
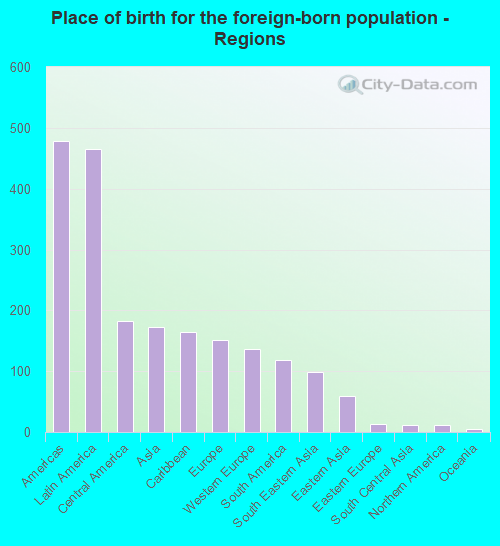
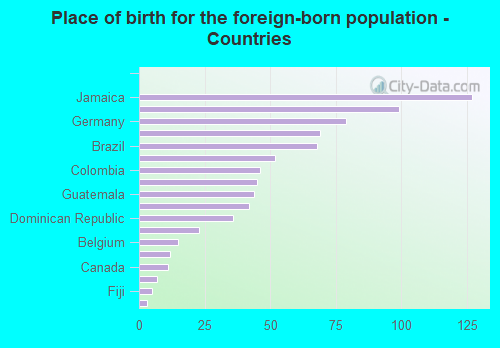
According to 2022 data, the most numerous races in Spring Lake, NC are White alone (4,083 residents), Black alone (3,696 residents), and Hispanic (2,343 residents). 85.2% of Spring Lake residents speak English at home. 6.9% of Spring Lake, NC residents are foreign-born (3.8% born in Latin America, 1.4% born in Asia, 1.2% born in Europe), which is 16.7% less than the foreign-born rate of 8.0% across the entire state of North Carolina.
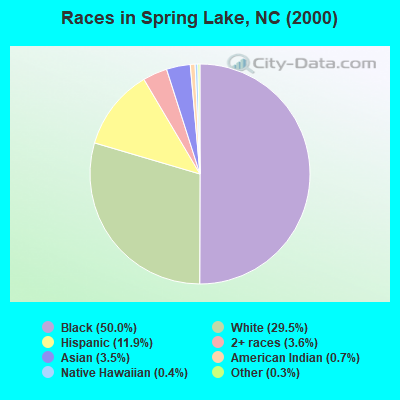
Race distribution in Spring Lake
2000 2022
5,647,155 70.2% White alone 1,723,301 21.4% Black alone 378,963 4.7% Hispanic 112,416 1.4% Asian alone 95,333 1.2% American Indian alone 79,965 1.0% Two or more races 9,015 0.1% Other race alone 3,165 0.04% Native Hawaiian and Other
6,497,519 60.7% White alone 2,155,650 20.1% Black alone 1,114,799 10.4% Hispanic 438,061 4.1% Two or more races 341,052 3.2% Asian alone 91,758 0.9% American Indian alone 50,180 0.5% Other race alone 9,954 0.09% Native Hawaiian and Other
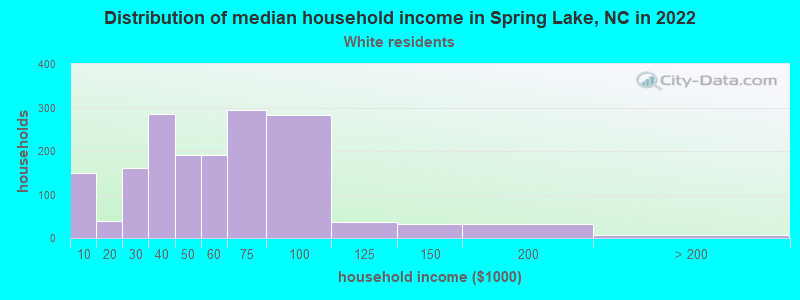
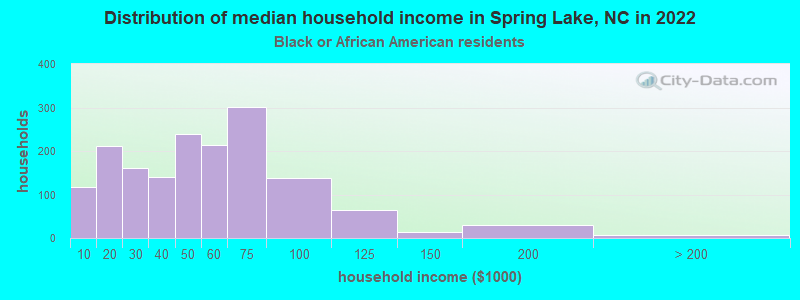
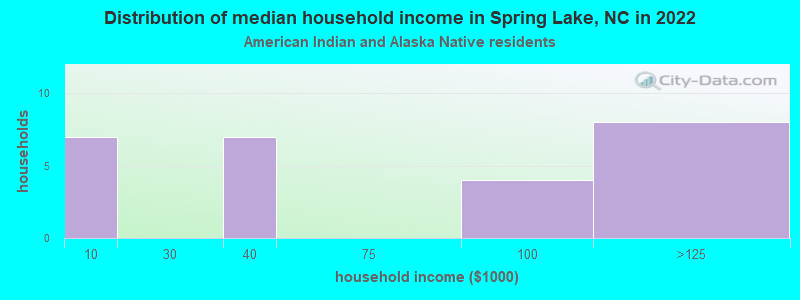
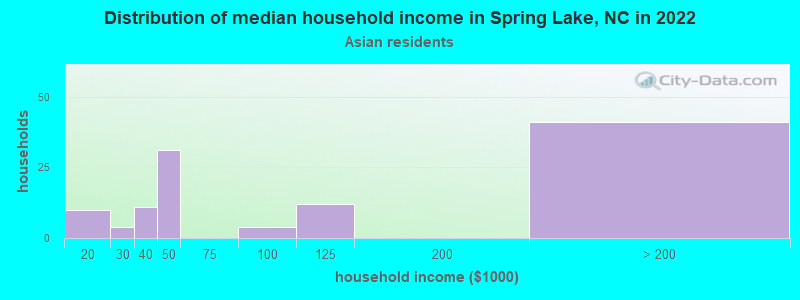
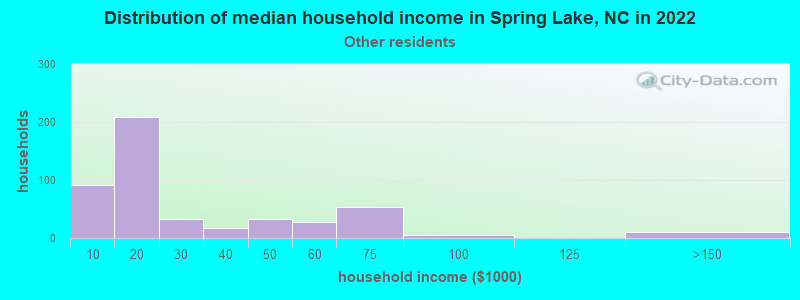
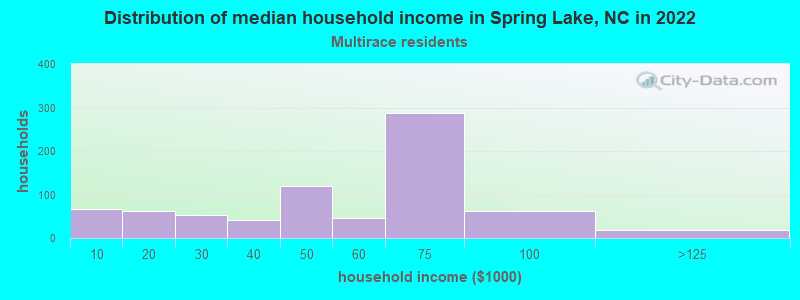
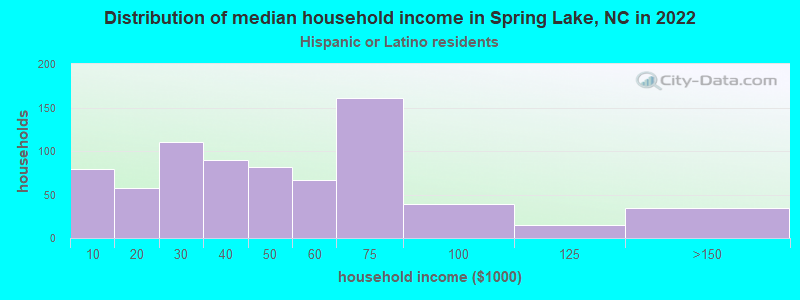
Income and house value in Spring Lake Median household income in 2022 $52,566 White non-Hispanic householders$46,950 Black householders$16,471 Some other race householders$52,308 Two or more races householders$45,504 Hispanic or Latino race householdersMedian 2022 house value $118,669 White Non-Hispanic householders$130,808 Black or African American householders$63,407 American Indian or Alaska Native householders $116,433 Asian householders$115,156 Some other race householders$137,516 Two or more races householders$117,871 Hispanic or Latino householders
Median age by race in Spring Lake
25.6 Median age for White residents25.3 25.8 30.5 Median age for Black or African American residents28.5 34.2 31.0 Median age for American Indian / Alaska Native residents-741,869,918.0 27.4 25.5 Median age for Asian residents23.9 27.4 22.2 Median age for Native Hawaiian / Pacific Islander residents27.2 -619,329,387.9 30.9 Median age for Other race residents25.6 35.6 20.2 Median age for Two or more races residents18.7 22.0 25.7 Median age for White alone residents25.5 25.8 21.8 Median age for Hispanic or Latino residents21.4 22.3
Owner/renter occupied households by race in Spring Lake
House owners and renters - White residents 345 20.9% Owner occupied1,303 79.1% Renter occupiedHouse owners and renters - Black or African American residents 593 36.0% Owner occupied1,054 64.0% Renter occupiedHouse owners and renters - American Indian / Alaska Native residents 22 100.0% Renter occupiedHouse owners and renters - Asian residents 97 100.0% Renter occupiedHouse owners and renters - Other race residents 148 36.7% Owner occupied256 63.3% Renter occupiedHouse owners and renters - Two or more races residents 39 5.0% Owner occupied729 95.0% Renter occupiedHouse owners and renters - White alone residents 342 21.6% Owner occupied1,246 78.4% Renter occupiedHouse owners and renters - Hispanic or Latino residents 91 13.3% Owner occupied596 86.7% Renter occupied
Language usage in Spring Lake
English speakers - Total 85.2% of residents of Spring Lake speak English at home.
10.1% of residents speak Spanish at home 688 64.7% Speak English very well375 35.3% Speak English less than very well4.8% of residents speak other language at home 420 82.7% Speak English very well88 17.3% Speak English less than very well
English speakers - Born in the United States 90.1% of residents of Spring Lake speak English at home.
7.4% of residents speak Spanish at home 445 89.2% Speak English very well54 10.8% Speak English less than very well2.2% of residents speak other language at home 146 100.0% Speak English very well
English speakers - Native, born elsewhere 63.5% of residents of Spring Lake speak English at home.
35.4% of residents speak Spanish at home 55 36.4% Speak English very well96 63.6% Speak English less than very well2.6% of residents speak other language at home 11 100.0% Speak English very well
English speakers - Foreign-born 18.0% of residents of Spring Lake speak English at home.
42.7% of residents speak Spanish at home 179 53.0% Speak English very well159 47.0% Speak English less than very well40.5% of residents speak other language at home 231 72.2% Speak English very well89 27.8% Speak English less than very well
White (Caucasian) - Speak only English Native:
93.8% (3,636)Foreign-born:
22.7% (24)
White (Caucasian) - Speak another language Native:
5.4% (211)Foreign-born:
77.0% (83)
Black or African American - Speak only English Native:
100.0% (3,333)Foreign-born:
90.7% (98)
Asian - Speak only English Native:
11.6% (8)Foreign-born:
3.8% (8)
Asian - Speak another language Native:
79.2% (52)Foreign-born:
98.9% (214)
Other race - Speak only English Native:
70.0% (518)Foreign-born:
2.5% (5)
Other race - Speak another language Native:
26.0% (193)Foreign-born:
97.7% (200)
Two or more races - Speak another language Native:
26.6% (478)Foreign-born:
97.2% (130)
White alone - Speak only English Native:
97.5% (3,457)Foreign-born:
18.9% (24)
White alone - Speak another language Native:
2.5% (90)Foreign-born:
85.5% (108)
Hispanic or Latino - Speak only English Native:
60.1% (1,046)Foreign-born:
2.5% (8)
Hispanic or Latino - Speak another language Native:
40.4% (703)Foreign-born:
98.9% (315)
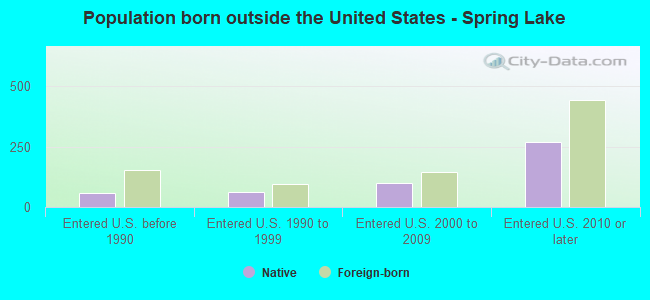
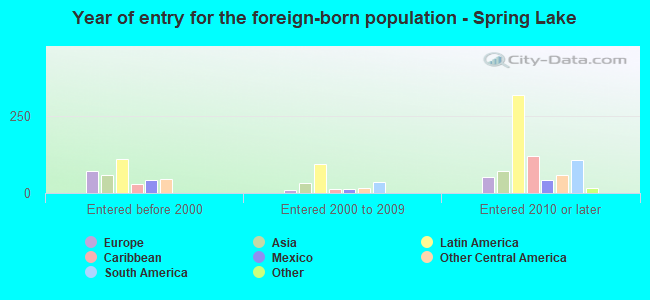
Foreign-born residents in Spring Lake 806 residents are foreign born (3.8% Latin America , 1.4% Asia , 1.2% Europe ).
This city:
6.9%North Carolina:
8.3%
Marital status for residents in Spring Lake Marital status - White (Caucasian) population 15 years and over
Males 37.5% Never married56.0% Now married1.7% Separated1.1% Widowed3.7% DivorcedFemales 26.0% Never married56.2% Now married1.4% Separated5.1% Widowed11.3% DivorcedWomen who gave birth in the past 12 months Now married:
100.0% (140)Unmarried:
0.0% (0)
Women who did not give birth in the past 12 months Now married:
58.4% (658)Unmarried:
41.6% (468)
Marital status - Black or African American population 15 years and over
Males 42.2% Never married42.4% Now married5.0% Separated2.6% Widowed7.8% DivorcedFemales 35.2% Never married29.9% Now married6.5% Separated9.4% Widowed19.0% DivorcedWomen who gave birth in the past 12 months Now married:
100.0% (62)Unmarried:
0.0% (0)
Women who did not give birth in the past 12 months Now married:
36.1% (349)Unmarried:
63.9% (617)
Marital status - American Indian / Alaska Native population 15 years and over
Males 0.0% Never married61.9% Now married0.0% Separated0.0% Widowed38.1% DivorcedFemales 7.3% Never married54.5% Now married0.0% Separated14.5% Widowed23.6% DivorcedWomen who did not give birth in the past 12 months Now married:
81.1% (32)Unmarried:
18.9% (7)
Marital status - Asian population 15 years and over
Males 42.7% Never married43.8% Now married13.5% Separated0.0% Widowed0.0% DivorcedFemales 16.6% Never married72.4% Now married11.0% Separated0.0% Widowed0.0% DivorcedWomen who gave birth in the past 12 months Now married:
100.0% (5)Unmarried:
0.0% (0)
Women who did not give birth in the past 12 months Now married:
73.5% (78)Unmarried:
26.5% (28)
Marital status - Native Hawaiian / Pacific Islander population 15 years and over
Males 100.0% Never married0.0% Now married0.0% Separated0.0% Widowed0.0% DivorcedFemales 0.0% Never married100.0% Now married0.0% Separated0.0% Widowed0.0% DivorcedWomen who did not give birth in the past 12 months Now married:
100.0% (18)Unmarried:
0.0% (0)
Marital status - Other race population 15 years and over
Males 23.8% Never married76.2% Now married0.0% Separated0.0% Widowed0.0% DivorcedFemales 11.3% Never married51.4% Now married21.2% Separated0.0% Widowed16.0% DivorcedWomen who gave birth in the past 12 months Now married:
100.0% (64)Unmarried:
0.0% (0)
Women who did not give birth in the past 12 months Now married:
56.2% (108)Unmarried:
43.7% (84)
Marital status - Two or more races population 15 years and over
Males 62.6% Never married30.8% Now married0.0% Separated0.0% Widowed6.7% DivorcedFemales 52.6% Never married27.4% Now married4.0% Separated2.3% Widowed13.6% DivorcedWomen who gave birth in the past 12 months Now married:
38.0% (22)Unmarried:
62.0% (36)
Women who did not give birth in the past 12 months Now married:
30.7% (196)Unmarried:
69.3% (442)
Marital status - White alone, not Hispanic / Latino population 15 years and over
Males 38.1% Never married54.6% Now married1.9% Separated1.2% Widowed4.1% DivorcedFemales 28.6% Never married52.6% Now married1.6% Separated5.8% Widowed11.3% DivorcedWomen who gave birth in the past 12 months Now married:
100.0% (114)Unmarried:
0.0% (0)
Women who did not give birth in the past 12 months Now married:
54.6% (563)Unmarried:
45.4% (467)
Marital status - Hispanic or Latino population 15 years and over
Males 48.0% Never married52.0% Now married0.0% Separated0.0% Widowed0.0% DivorcedFemales 15.8% Never married66.7% Now married1.1% Separated0.0% Widowed16.4% DivorcedWomen who gave birth in the past 12 months Now married:
91.5% (112)Unmarried:
8.5% (10)
Women who did not give birth in the past 12 months Now married:
68.1% (378)Unmarried:
31.9% (177)
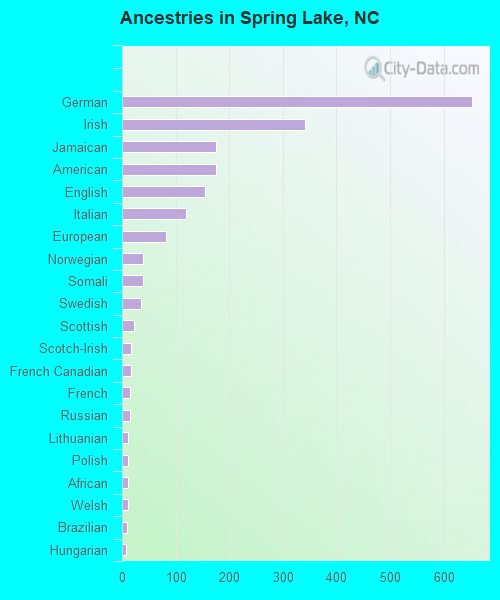
Ancestries in Spring Lake
652 9.5% German342 5.0% Irish176 2.6% Jamaican175 2.5% American154 2.2% English119 1.7% Italian83 1.2% European39 0.6% Norwegian39 0.6% Somali35 0.5% Swedish22 0.3% Scottish17 0.2% Scotch-Irish16 0.2% French Canadian14 0.2% French14 0.2% Russian12 0.2% Lithuanian11 0.2% Polish11 0.2% African11 0.2% Welsh9 0.1% Brazilian8 0.1% Hungarian5 0.07% British5 0.07% Portuguese4 0.06% Eastern European2 0.03% Northern European
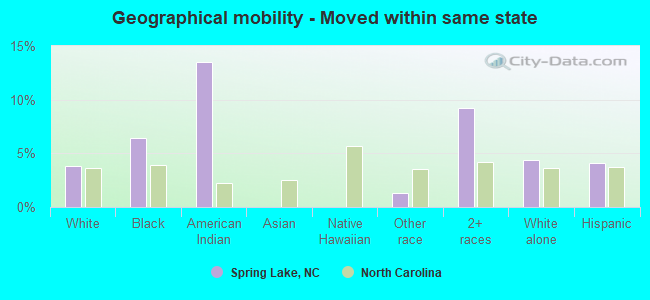
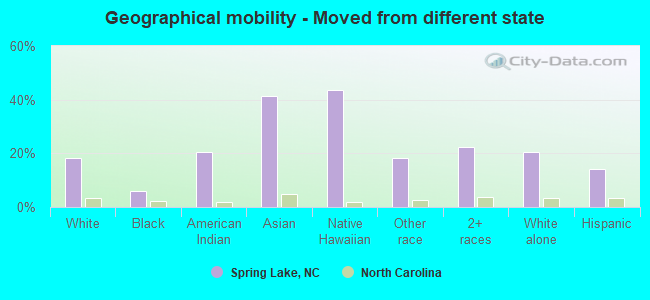
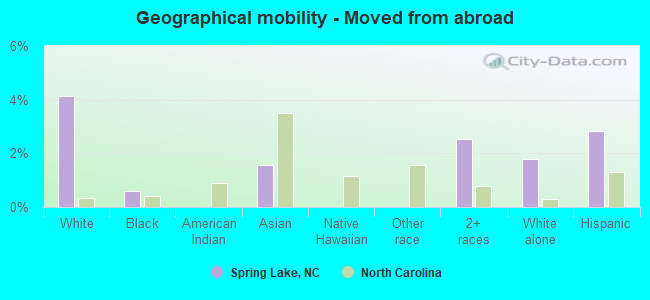
Geographical mobility in Spring Lake Same house 1 year ago 2,736 62.8% White (Caucasian)2,981 80.0% Black or African American45 56.7% American Indian / Alaska Native115 41.2% Asian23 48.9% Native Hawaiian / Pacific Islander699 71.6% Other race1,129 50.7% Two or more races2,484 62.1% White alone, not Hispanic / Latino1,463 65.1% Hispanic or LatinoMoved within same county 393 9.0% White / Caucasian209 5.6% Black or African American104 37.2% Asian70 7.2% Other race394 17.7% Two or more races358 9.0% White alone, not Hispanic / Latino227 10.1% Hispanic or LatinoMoved within same state 166 3.8% White / Caucasian239 6.4% Black or African American11 13.5% American Indian / Alaska Native13 1.3% Other race205 9.2% Two or more races173 4.3% White alone, not Hispanic / Latino93 4.1% Hispanic or LatinoMoved from different state 800 18.4% White / Caucasian226 6.1% Black or African American16 20.6% American Indian / Alaska Native116 41.5% Asian20 43.5% Native Hawaiian / Pacific Islander178 18.2% Other race494 22.2% Two or more races822 20.6% White alone, not Hispanic / Latino321 14.3% Hispanic or LatinoMoved from abroad 180 4.1% White23 0.6% Black or African American4 1.6% Asian56 2.5% Two or more races71 1.8% White alone, not Hispanic / Latino63 2.8% Hispanic or Latino
Children Nativity (place of birth) in Spring Lake
Children under 6 years - Living with two parents Both parents native 800 100.0% NativeBoth parents foreign-born 6 100.0% NativeOne native, one foreign-born parent 132 100.0% NativeChildren under 6 years - Living with one parent Native parent 381 100.0% NativeForeign-born parent 1 7.1% Native19 92.9% Foreign-bornChildren 6 to 17 years - Living with two parents Both parents native 598 99.1% Native6 0.9% Foreign-bornBoth parents foreign-born 7 25.4% Native20 74.6% Foreign-bornOne native, one foreign-born parent 144 100.0% NativeChildren 6 to 17 years - Living with one parent Native parent 833 100.0% NativeForeign-born parent 57 59.8% Native38 40.2% Foreign-born
Grandparents responsible for own grandchildren in Spring Lake
Grandparents (30 to 59 years) White / Caucasian 42 100.0% Not responsible for grandchildrenBlack or African American 38 53.5% Responsible for grandchildren33 46.5% Not responsible for grandchildrenAmerican Indian / Alaska Native 22 100.0% Not responsible for grandchildrenTwo or more races 8 100.0% Not responsible for grandchildrenWhite alone, not Hispanic / Latino 44 100.0% Not responsible for grandchildrenGrandparents (60 years and over) Black or African American 90 71.0% Responsible for grandchildren37 29.0% Not responsible for grandchildren