Races in Southwest Grayson, Texas (TX) Detailed Stats
Ancestries, Foreign-born residents, place of birth
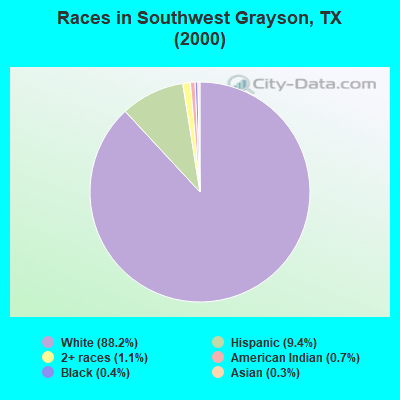
Race distribution in Southwest Grayson

- 6,77088.2%White alone
- 7189.4%Hispanic
- 821.1%Two or more races
- 540.7%American Indian alone
- 290.4%Black alone
- 230.3%Asian alone
2000
2022
-
- 10,933,31352.4%White alone
- 6,669,66632.0%Hispanic
- 2,364,25511.3%Black alone
- 554,4452.7%Asian alone
- 230,5671.1%Two or more races
- 68,8590.3%American Indian alone
- 19,9580.10%Other race alone
- 10,7570.05%Native Hawaiian and Other
Pacific Islander alone

-
- 12,070,64240.2%Hispanic
- 11,683,43038.9%White alone
- 3,508,70611.7%Black alone
- 1,608,1735.4%Asian alone
- 956,5603.2%Two or more races
- 125,7630.4%Other race alone
- 47,0230.2%American Indian alone
- 29,2750.10%Native Hawaiian and Other
Pacific Islander alone

Income and house value in Southwest Grayson
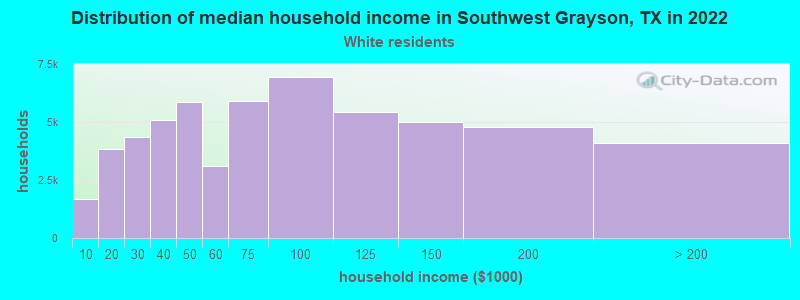
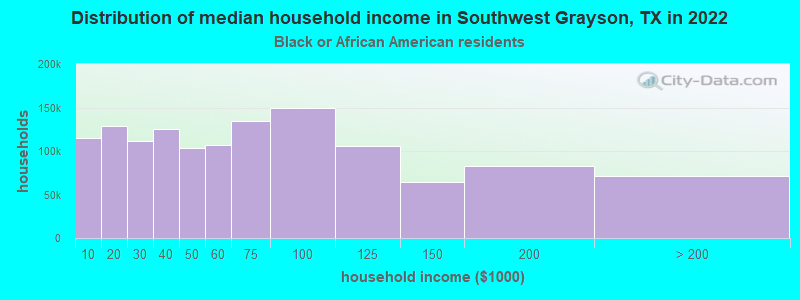
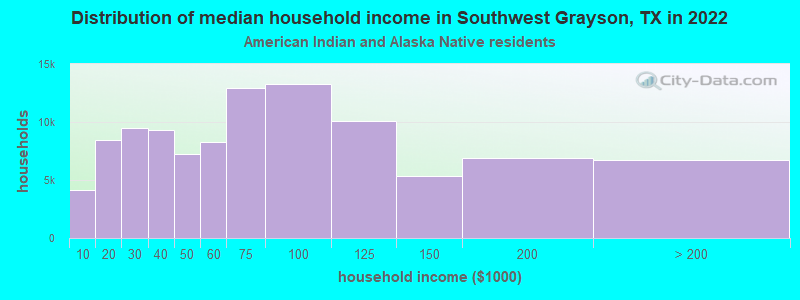
- Median household income in 2022
- $87,510White non-Hispanic householders
- $107,460Black householders
- $131,947American Indian and Alaska Native householders
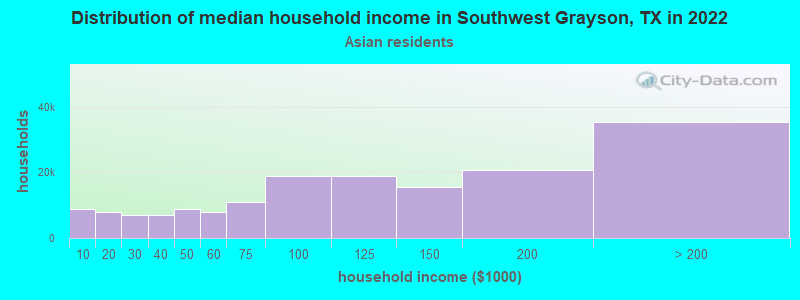
- $22,881Asian householders
- $84,887Some other race householders
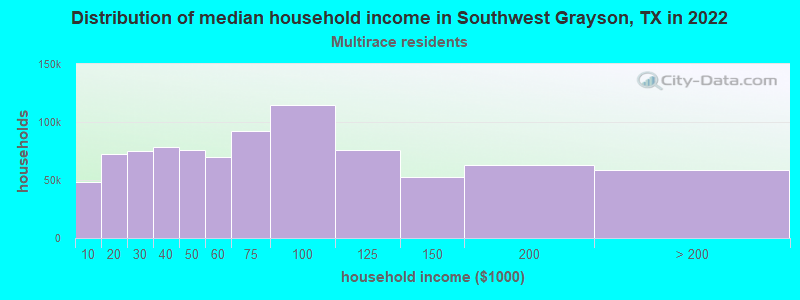
- $53,854Two or more races householders
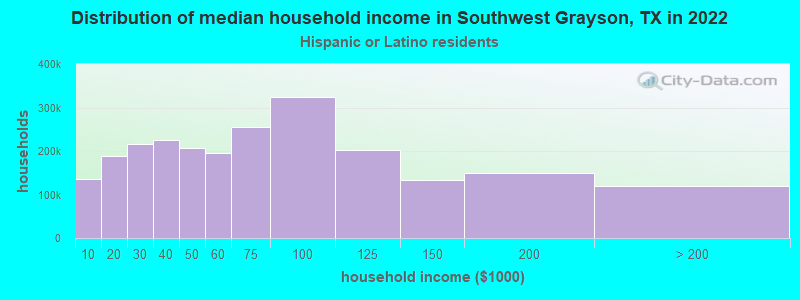
- $72,774Hispanic or Latino race householders
- Median 2022 house value
- $299,639White Non-Hispanic householders
- $240,154Black or African American householders
- $404,199American Indian or Alaska Native householders
- $350,995Asian householders
- $494,719Some other race householders
- $254,194Two or more races householders
- $363,188Hispanic or Latino householders
Household income for White non-Hispanic householders
Household income for Black householders
Household income for American Indian and Alaska Native householders
Household income for Asian householders
Household income for Two or more races householders
Household income for Hispanic or Latino race householders
Zip code: 76233