Races in South Riding, Virginia (VA) Detailed Stats
Data:
Races - White alone (%)
Races - White alone (% change since 2000)
Races - Black alone (%)
Races - Black alone (% change since 2000)
Races - American Indian alone (%)
Races - American Indian alone (% change since 2000)
Races - Asian alone (%)
Races - Asian alone (% change since 2000)
Races - Hispanic (%)
Races - Hispanic (% change since 2000)
Races - Native Hawaiian and Other Pacific Islander alone (%)
Races - Native Hawaiian and Other Pacific Islander alone (% change since 2000)
Races - Two or more races(%)
Races - Two or more races(% change since 2000)
Races - Other race alone (%)
Races - Other race alone (% change since 2000)
Racial diversity
Place of birth - Born in state of residence (%)
Place of birth - Born in state of residence (%) - White
Place of birth - Born in state of residence (%) - Black or African American
Place of birth - Born in state of residence (%) - Asian
Place of birth - Born in state of residence (%) - Hispanic or Latino
Place of birth - Born in state of residence (%) - American Indian and Alaska Native
Place of birth - Born in state of residence (%) - Multirace
Place of birth - Born in state of residence (%) - Other Race
Place of birth - Born in other state (%)
Place of birth - Born in other state (%) - White
Place of birth - Born in other state (%) - Black or African American
Place of birth - Born in other state (%) - Asian
Place of birth - Born in other state (%) - Hispanic or Latino
Place of birth - Born in other state (%) - American Indian and Alaska Native
Place of birth - Born in other state (%) - Multirace
Place of birth - Born in other state (%) - Other Race
Place of birth - Native, outside of US (%)
Place of birth - Native, outside of US (%) - White
Place of birth - Native, outside of US (%) - Black or African American
Place of birth - Native, outside of US (%) - Asian
Place of birth - Native, outside of US (%) - Hispanic or Latino
Place of birth - Native, outside of US (%) - American Indian and Alaska Native
Place of birth - Native, outside of US (%) - Multirace
Place of birth - Native, outside of US (%) - Other Race
Place of birth - Foreign born (%)
Place of birth - Foreign born (%) - White
Place of birth - Foreign born (%) - Black or African American
Place of birth - Foreign born (%) - Asian
Place of birth - Foreign born (%) - Hispanic or Latino
Place of birth - Foreign born (%) - American Indian and Alaska Native
Place of birth - Foreign born (%) - Multirace
Place of birth - Foreign born (%) - Other Race
Residents speaking English at home (%)
Residents speaking English at home - Born in the United States (%)
Residents speaking English at home - Native, born elsewhere (%)
Residents speaking English at home - Foreign born (%)
Residents speaking Spanish at home (%)
Residents speaking Spanish at home - Born in the United States (%)
Residents speaking Spanish at home - Native, born elsewhere (%)
Residents speaking Spanish at home - Foreign born (%)
Residents speaking other language at home (%)
Residents speaking other language at home - Born in the United States (%)
Residents speaking other language at home - Native, born elsewhere (%)
Residents speaking other language at home - Foreign born (%)
Marital status - Never married (%)
Marital status - Now married (%)
Marital status - Separated (%)
Marital status - Widowed (%)
Marital status - Divorced (%)
Ancestries Reported - Arab (%)
Ancestries Reported - Czech (%)
Ancestries Reported - Danish (%)
Ancestries Reported - Dutch (%)
Ancestries Reported - English (%)
Ancestries Reported - French (%)
Ancestries Reported - French Canadian (%)
Ancestries Reported - German (%)
Ancestries Reported - Greek (%)
Ancestries Reported - Hungarian (%)
Ancestries Reported - Irish (%)
Ancestries Reported - Italian (%)
Ancestries Reported - Lithuanian (%)
Ancestries Reported - Norwegian (%)
Ancestries Reported - Polish (%)
Ancestries Reported - Portuguese (%)
Ancestries Reported - Russian (%)
Ancestries Reported - Scotch-Irish (%)
Ancestries Reported - Scottish (%)
Ancestries Reported - Slovak (%)
Ancestries Reported - Subsaharan African (%)
Ancestries Reported - Swedish (%)
Ancestries Reported - Swiss (%)
Ancestries Reported - Ukrainian (%)
Ancestries Reported - United States (%)
Ancestries Reported - Welsh (%)
Ancestries Reported - West Indian (%)
Ancestries Reported - Other (%)
Geographical mobility - Same house 1 year ago (%)
Geographical mobility - Same house 1 year ago (%) - White
Geographical mobility - Same house 1 year ago (%) - Black or African American
Geographical mobility - Same house 1 year ago (%) - Asian
Geographical mobility - Same house 1 year ago (%) - Hispanic or Latino
Geographical mobility - Same house 1 year ago (%) - American Indian and Alaska Native
Geographical mobility - Same house 1 year ago (%) - Multirace
Geographical mobility - Same house 1 year ago (%) - Other Race
Geographical mobility - Moved within same county (%)
Geographical mobility - Moved within same county (%) - White
Geographical mobility - Moved within same county (%) - Black or African American
Geographical mobility - Moved within same county (%) - Asian
Geographical mobility - Moved within same county (%) - Hispanic or Latino
Geographical mobility - Moved within same county (%) - American Indian and Alaska Native
Geographical mobility - Moved within same county (%) - Multirace
Geographical mobility - Moved within same county (%) - Other Race
Geographical mobility - Moved from different county within same state (%)
Geographical mobility - Moved from different county within same state (%) - White
Geographical mobility - Moved from different county within same state (%) - Black or African American
Geographical mobility - Moved from different county within same state (%) - Asian
Geographical mobility - Moved from different county within same state (%) - Hispanic or Latino
Geographical mobility - Moved from different county within same state (%) - American Indian and Alaska Native
Geographical mobility - Moved from different county within same state (%) - Multirace
Geographical mobility - Moved from different county within same state (%) - Other Race
Geographical mobility - Moved from different state (%)
Geographical mobility - Moved from different state (%) - White
Geographical mobility - Moved from different state (%) - Black or African American
Geographical mobility - Moved from different state (%) - Asian
Geographical mobility - Moved from different state (%) - Hispanic or Latino
Geographical mobility - Moved from different state (%) - American Indian and Alaska Native
Geographical mobility - Moved from different state (%) - Multirace
Geographical mobility - Moved from different state (%) - Other Race
Geographical mobility - Moved from abroad (%)
Geographical mobility - Moved from abroad (%) - White
Geographical mobility - Moved from abroad (%) - Black or African American
Geographical mobility - Moved from abroad (%) - Asian
Geographical mobility - Moved from abroad (%) - Hispanic or Latino
Geographical mobility - Moved from abroad (%) - American Indian and Alaska Native
Geographical mobility - Moved from abroad (%) - Multirace
Geographical mobility - Moved from abroad (%) - Other Race
Place of birth for the foreign-born population - Ireland (%)
Place of birth for the foreign-born population - Denmark (%)
Place of birth for the foreign-born population - Norway (%)
Place of birth for the foreign-born population - Sweden (%)
Place of birth for the foreign-born population - United Kingdom (%)
Place of birth for the foreign-born population - England (%)
Place of birth for the foreign-born population - Scotland (%)
Place of birth for the foreign-born population - Other Northern Europe (%)
Place of birth for the foreign-born population - Austria (%)
Place of birth for the foreign-born population - Belgium (%)
Place of birth for the foreign-born population - France (%)
Place of birth for the foreign-born population - Germany (%)
Place of birth for the foreign-born population - Netherlands (%)
Place of birth for the foreign-born population - Switzerland (%)
Place of birth for the foreign-born population - Other Western Europe (%)
Place of birth for the foreign-born population - Greece (%)
Place of birth for the foreign-born population - Italy (%)
Place of birth for the foreign-born population - Portugal (%)
Place of birth for the foreign-born population - Spain (%)
Place of birth for the foreign-born population - Other Southern Europe (%)
Place of birth for the foreign-born population - Albania (%)
Place of birth for the foreign-born population - Belarus (%)
Place of birth for the foreign-born population - Bosnia and Herzegovina (%)
Place of birth for the foreign-born population - Bulgaria (%)
Place of birth for the foreign-born population - Croatia (%)
Place of birth for the foreign-born population - Czechoslovakia (%)
Place of birth for the foreign-born population - Hungary (%)
Place of birth for the foreign-born population - Latvia (%)
Place of birth for the foreign-born population - Lithuania (%)
Place of birth for the foreign-born population - North Macedonia (Macedonia) (%)
Place of birth for the foreign-born population - Moldova (%)
Place of birth for the foreign-born population - Poland (%)
Place of birth for the foreign-born population - Romania (%)
Place of birth for the foreign-born population - Russia (%)
Place of birth for the foreign-born population - Serbia (%)
Place of birth for the foreign-born population - Ukraine (%)
Place of birth for the foreign-born population - Other Eastern Europe (%)
Place of birth for the foreign-born population - China (%)
Place of birth for the foreign-born population - Hong Kong (%)
Place of birth for the foreign-born population - Taiwan (%)
Place of birth for the foreign-born population - Japan (%)
Place of birth for the foreign-born population - Korea (%)
Place of birth for the foreign-born population - Other Eastern Asia (%)
Place of birth for the foreign-born population - Afghanistan (%)
Place of birth for the foreign-born population - Bangladesh (%)
Place of birth for the foreign-born population - India (%)
Place of birth for the foreign-born population - Iran (%)
Place of birth for the foreign-born population - Kazakhstan (%)
Place of birth for the foreign-born population - Nepal (%)
Place of birth for the foreign-born population - Pakistan (%)
Place of birth for the foreign-born population - Sri Lanka (%)
Place of birth for the foreign-born population - Uzbekistan (%)
Place of birth for the foreign-born population - Other South Central Asia (%)
Place of birth for the foreign-born population - Burma (%)
Place of birth for the foreign-born population - Cambodia (%)
Place of birth for the foreign-born population - Indonesia (%)
Place of birth for the foreign-born population - Laos (%)
Place of birth for the foreign-born population - Malaysia (%)
Place of birth for the foreign-born population - Philippines (%)
Place of birth for the foreign-born population - Singapore (%)
Place of birth for the foreign-born population - Thailand (%)
Place of birth for the foreign-born population - Vietnam (%)
Place of birth for the foreign-born population - Other South Eastern Asia (%)
Place of birth for the foreign-born population - Armenia (%)
Place of birth for the foreign-born population - Iraq (%)
Place of birth for the foreign-born population - Israel (%)
Place of birth for the foreign-born population - Jordan (%)
Place of birth for the foreign-born population - Kuwait (%)
Place of birth for the foreign-born population - Lebanon (%)
Place of birth for the foreign-born population - Saudi Arabia (%)
Place of birth for the foreign-born population - Syria (%)
Place of birth for the foreign-born population - Turkey (%)
Place of birth for the foreign-born population - Yemen (%)
Place of birth for the foreign-born population - Other Western Asia (%)
Place of birth for the foreign-born population - Eritrea (%)
Place of birth for the foreign-born population - Ethiopia (%)
Place of birth for the foreign-born population - Kenya (%)
Place of birth for the foreign-born population - Somalia (%)
Place of birth for the foreign-born population - Uganda (%)
Place of birth for the foreign-born population - Zimbabwe (%)
Place of birth for the foreign-born population - Other Eastern Africa (%)
Place of birth for the foreign-born population - Cameroon (%)
Place of birth for the foreign-born population - Congo (%)
Place of birth for the foreign-born population - Democratic Republic of Congo (Zaire) (%)
Place of birth for the foreign-born population - Other Middle Africa (%)
Place of birth for the foreign-born population - Egypt (%)
Place of birth for the foreign-born population - Morocco (%)
Place of birth for the foreign-born population - Sudan (%)
Place of birth for the foreign-born population - Other Northern Africa (%)
Place of birth for the foreign-born population - South Africa (%)
Place of birth for the foreign-born population - Other Southern Africa (%)
Place of birth for the foreign-born population - Cabo Verde (%)
Place of birth for the foreign-born population - Ghana (%)
Place of birth for the foreign-born population - Liberia (%)
Place of birth for the foreign-born population - Nigeria (%)
Place of birth for the foreign-born population - Senegal (%)
Place of birth for the foreign-born population - Sierra Leone (%)
Place of birth for the foreign-born population - Other Western Africa (%)
Place of birth for the foreign-born population - Australia (%)
Place of birth for the foreign-born population - New Zealand (%)
Place of birth for the foreign-born population - Fiji (%)
Place of birth for the foreign-born population - Micronesia (%)
Place of birth for the foreign-born population - Bahamas (%)
Place of birth for the foreign-born population - Barbados (%)
Place of birth for the foreign-born population - Cuba (%)
Place of birth for the foreign-born population - Dominica (%)
Place of birth for the foreign-born population - Dominican Republic (%)
Place of birth for the foreign-born population - Grenada (%)
Place of birth for the foreign-born population - Haiti (%)
Place of birth for the foreign-born population - Jamaica (%)
Place of birth for the foreign-born population - St. Vincent and the Grenadines (%)
Place of birth for the foreign-born population - Trinidad and Tobago (%)
Place of birth for the foreign-born population - West Indies (%)
Place of birth for the foreign-born population - Other Caribbean (%)
Place of birth for the foreign-born population - Belize (%)
Place of birth for the foreign-born population - Costa Rica (%)
Place of birth for the foreign-born population - El Salvador (%)
Place of birth for the foreign-born population - Guatemala (%)
Place of birth for the foreign-born population - Honduras (%)
Place of birth for the foreign-born population - Mexico (%)
Place of birth for the foreign-born population - Nicaragua (%)
Place of birth for the foreign-born population - Panama (%)
Place of birth for the foreign-born population - Other Central America (%)
Place of birth for the foreign-born population - Argentina (%)
Place of birth for the foreign-born population - Bolivia (%)
Place of birth for the foreign-born population - Brazil (%)
Place of birth for the foreign-born population - Chile (%)
Place of birth for the foreign-born population - Colombia (%)
Place of birth for the foreign-born population - Ecuador (%)
Place of birth for the foreign-born population - Guyana (%)
Place of birth for the foreign-born population - Peru (%)
Place of birth for the foreign-born population - Uruguay (%)
Place of birth for the foreign-born population - Venezuela (%)
Place of birth for the foreign-born population - Other South America (%)
Place of birth for the foreign-born population - Canada (%)
Place of birth for the foreign-born population - Other Northern America (%)
Place of birth for the foreign-born population - Other (%)
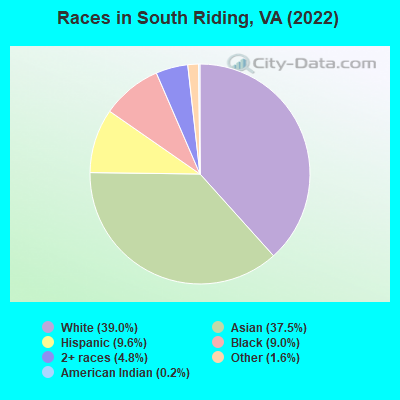
According to 2022 data, the most numerous races in South Riding, VA are White alone (13,356 residents), Black alone (3,073 residents), and Hispanic (3,276 residents). 57.9% of South Riding residents speak English at home.
Race distribution in South Riding 13,356 39.0% White alone 12,859 37.5% Asian alone 3,276 9.6% Hispanic 3,073 9.0% Black alone 1,653 4.8% Two or more races 547 1.6% Other race alone 74 0.2% American Indian alone 8 0.02% Native Hawaiian and Other
2000 2022
4,965,637 70.2% White alone 1,376,378 19.4% Black alone 329,540 4.7% Hispanic 259,277 3.7% Asian alone 114,022 1.6% Two or more races 18,596 0.3% American Indian alone 11,685 0.2% Other race alone 3,380 0.05% Native Hawaiian and Other
5,095,130 58.7% White alone 1,594,785 18.4% Black alone 905,750 10.4% Hispanic 602,881 6.9% Asian alone 406,047 4.7% Two or more races 60,419 0.7% Other race alone 11,738 0.1% American Indian alone 6,869 0.08% Native Hawaiian and Other
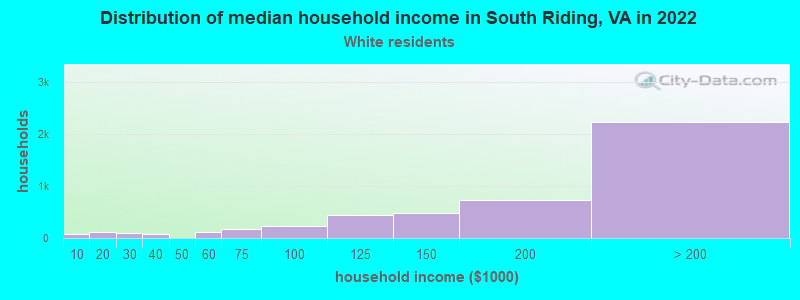
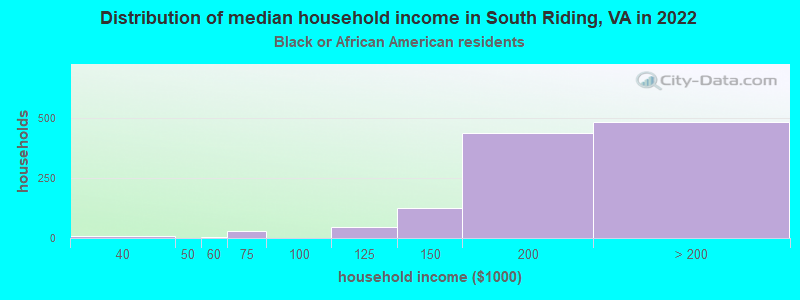
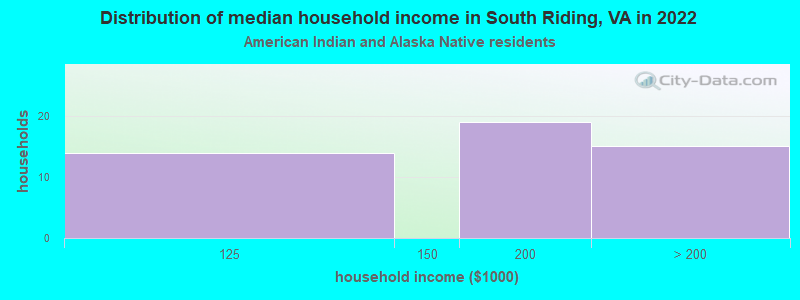
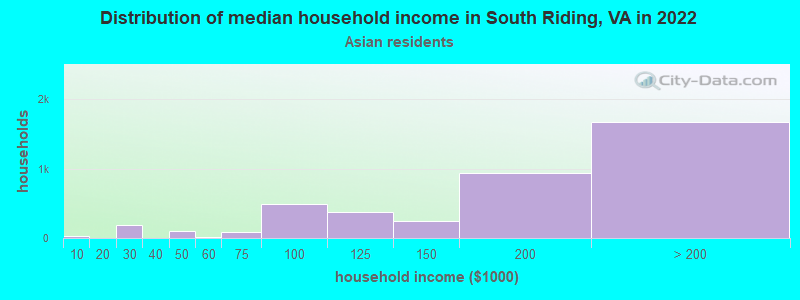
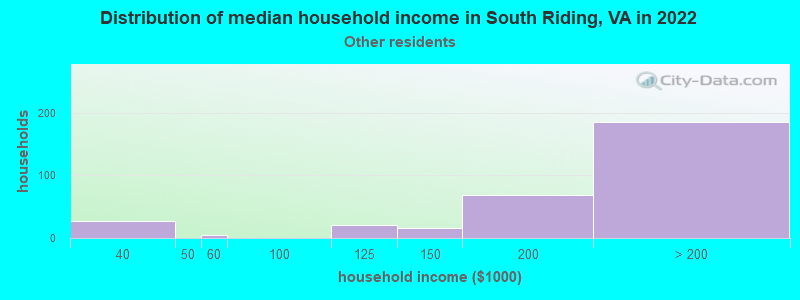
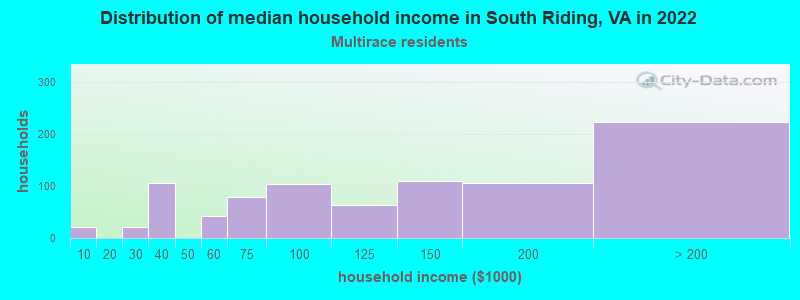
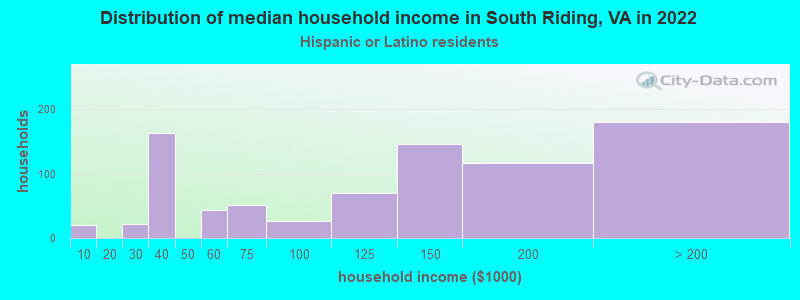
Income and house value in South Riding Median household income in 2022 $189,730 White non-Hispanic householdersover $200,000 Black householdersover $200,000 American Indian and Alaska Native householders$177,562 Asian householdersover $200,000 Some other race householders$116,519 Two or more races householders$127,801 Hispanic or Latino race householders
Median age by race in South Riding
41.2 Median age for White residents42.2 39.0 39.9 Median age for Black or African American residents37.2 39.2 80.9 Median age for American Indian / Alaska Native residents97.2 68.8 38.8 Median age for Asian residents39.9 38.4 -1,157,453,935.2 Median age for Native Hawaiian / Pacific Islander residents-541,531,822.5 -714,150,046.8 16.4 Median age for Other race residents15.1 31.1 28.1 Median age for Two or more races residents28.9 27.8 40.7 Median age for White alone residents42.4 37.6 34.3 Median age for Hispanic or Latino residents29.2 36.3
Owner/renter occupied households by race in South Riding
House owners and renters - White residents 3,942 83.6% Owner occupied775 16.4% Renter occupiedHouse owners and renters - Black or African American residents 723 65.4% Owner occupied382 34.6% Renter occupiedHouse owners and renters - American Indian / Alaska Native residents 48 100.0% Owner occupiedHouse owners and renters - Asian residents 3,714 90.5% Owner occupied389 9.5% Renter occupiedHouse owners and renters - Other race residents 242 85.9% Owner occupied40 14.1% Renter occupiedHouse owners and renters - Two or more races residents 723 85.8% Owner occupied120 14.2% Renter occupiedHouse owners and renters - White alone residents 3,892 83.8% Owner occupied753 16.2% Renter occupiedHouse owners and renters - Hispanic or Latino residents 691 84.0% Owner occupied131 16.0% Renter occupied
Language usage in South Riding
English speakers - Total 57.9% of residents of South Riding speak English at home.
6.7% of residents speak Spanish at home 1,529 70.8% Speak English very well631 29.2% Speak English less than very well37.1% of residents speak other language at home 8,456 70.3% Speak English very well3,566 29.7% Speak English less than very well
English speakers - Born in the United States 86.8% of residents of South Riding speak English at home.
6.1% of residents speak Spanish at home 474 75.8% Speak English very well151 24.2% Speak English less than very well7.9% of residents speak other language at home 730 89.8% Speak English very well83 10.2% Speak English less than very well
English speakers - Native, born elsewhere 35.8% of residents of South Riding speak English at home.
15.8% of residents speak Spanish at home 202 94.8% Speak English very well11 5.2% Speak English less than very well59.1% of residents speak other language at home 779 97.5% Speak English very well20 2.5% Speak English less than very well
English speakers - Foreign-born 15.4% of residents of South Riding speak English at home.
7.5% of residents speak Spanish at home 388 44.0% Speak English very well494 56.0% Speak English less than very well78.7% of residents speak other language at home 6,092 65.8% Speak English very well3,168 34.2% Speak English less than very well
White (Caucasian) - Speak only English Native:
93.2% (10,623)Foreign-born:
21.7% (333)
White (Caucasian) - Speak another language Native:
6.8% (779)Foreign-born:
77.9% (1,194)
Black or African American - Speak only English Native:
90.6% (2,308)Foreign-born:
39.5% (252)
Black or African American - Speak another language Native:
10.4% (266)Foreign-born:
53.6% (342)
Asian - Speak only English Native:
53.4% (1,991)Foreign-born:
13.5% (1,138)
Asian - Speak another language Native:
46.2% (1,723)Foreign-born:
86.5% (7,274)
Other race - Speak only English Native:
64.3% (806)Foreign-born:
20.6% (69)
Other race - Speak another language Native:
35.1% (439)Foreign-born:
78.0% (263)
Two or more races - Speak only English Native:
62.1% (1,400)Foreign-born:
3.8% (30)
Two or more races - Speak another language Native:
39.2% (884)Foreign-born:
95.7% (755)
White alone - Speak only English Native:
93.8% (10,441)Foreign-born:
18.4% (313)
White alone - Speak another language Native:
6.3% (696)Foreign-born:
82.8% (1,404)
Hispanic or Latino - Speak only English Native:
53.9% (1,231)Foreign-born:
6.1% (59)
Hispanic or Latino - Speak another language Native:
46.5% (1,062)Foreign-born:
93.6% (897)
Foreign-born residents in South Riding
Marital status for residents in South Riding Marital status - White (Caucasian) population 15 years and over
Males 23.6% Never married66.9% Now married1.4% Separated1.0% Widowed7.2% DivorcedFemales 22.4% Never married60.5% Now married2.6% Separated4.8% Widowed9.6% DivorcedWomen who gave birth in the past 12 months Now married:
68.5% (80)Unmarried:
31.5% (37)
Women who did not give birth in the past 12 months Now married:
60.2% (1,970)Unmarried:
39.8% (1,305)
Marital status - Black or African American population 15 years and over
Males 14.2% Never married81.1% Now married0.0% Separated0.0% Widowed4.7% DivorcedFemales 39.4% Never married57.8% Now married0.0% Separated0.0% Widowed2.8% DivorcedWomen who gave birth in the past 12 months Now married:
100.0% (46)Unmarried:
0.0% (0)
Women who did not give birth in the past 12 months Now married:
54.5% (494)Unmarried:
45.5% (412)
Marital status - American Indian / Alaska Native population 15 years and over
Males 16.7% Never married83.3% Now married0.0% Separated0.0% Widowed0.0% DivorcedFemales 0.0% Never married83.9% Now married16.1% Separated0.0% Widowed0.0% DivorcedWomen who did not give birth in the past 12 months Now married:
100.0% (32)Unmarried:
0.0% (0)
Marital status - Asian population 15 years and over
Males 21.8% Never married75.4% Now married0.4% Separated0.2% Widowed2.2% DivorcedFemales 14.9% Never married76.3% Now married0.7% Separated3.3% Widowed4.7% DivorcedWomen who gave birth in the past 12 months Now married:
100.0% (167)Unmarried:
0.0% (0)
Women who did not give birth in the past 12 months Now married:
75.1% (2,616)Unmarried:
24.9% (869)
Marital status - Other race population 15 years and over
Males 34.2% Never married48.7% Now married8.0% Separated9.1% Widowed0.0% DivorcedFemales 38.3% Never married49.7% Now married1.7% Separated0.0% Widowed10.3% DivorcedWomen who did not give birth in the past 12 months Now married:
46.3% (155)Unmarried:
53.7% (180)
Marital status - Two or more races population 15 years and over
Males 45.4% Never married49.1% Now married2.0% Separated0.0% Widowed3.5% DivorcedFemales 45.0% Never married40.6% Now married2.9% Separated3.7% Widowed7.8% DivorcedWomen who gave birth in the past 12 months Now married:
100.0% (24)Unmarried:
0.0% (0)
Women who did not give birth in the past 12 months Now married:
38.3% (383)Unmarried:
61.7% (617)
Marital status - White alone, not Hispanic / Latino population 15 years and over
Males 22.5% Never married67.6% Now married1.5% Separated1.0% Widowed7.4% DivorcedFemales 23.6% Never married61.4% Now married2.4% Separated3.3% Widowed9.3% DivorcedWomen who gave birth in the past 12 months Now married:
68.5% (84)Unmarried:
31.5% (39)
Women who did not give birth in the past 12 months Now married:
59.9% (1,938)Unmarried:
40.1% (1,300)
Marital status - Hispanic or Latino population 15 years and over
Males 40.5% Never married57.1% Now married0.0% Separated0.0% Widowed2.5% DivorcedFemales 32.4% Never married47.8% Now married3.5% Separated9.4% Widowed6.9% DivorcedWomen who gave birth in the past 12 months Now married:
100.0% (31)Unmarried:
0.0% (0)
Women who did not give birth in the past 12 months Now married:
46.7% (437)Unmarried:
53.3% (499)
Ancestries in South Riding
666 3.7% English551 3.0% American516 2.8% Irish437 2.4% German371 2.0% Italian354 1.9% Afghan239 1.3% Iranian211 1.2% Turkish192 1.1% Iraqi176 1.0% European141 0.8% Swedish130 0.7% Dutch127 0.7% African108 0.6% Scottish86 0.5% Egyptian86 0.5% Northern European65 0.4% Norwegian64 0.4% Welsh61 0.3% Syrian59 0.3% Sierra Leonean57 0.3% West Indian50 0.3% Scotch-Irish45 0.2% French42 0.2% Trinidadian and Tobagonian41 0.2% Ghanaian41 0.2% Kenyan38 0.2% Romanian37 0.2% Assyrian36 0.2% Eastern European34 0.2% Moroccan32 0.2% Austrian32 0.2% Ethiopian30 0.2% South African29 0.2% Hungarian29 0.2% Swiss27 0.1% Belgian26 0.1% Russian25 0.1% Danish24 0.1% Czech23 0.1% British18 0.10% Canadian16 0.09% Polish15 0.08% Jordanian14 0.08% Brazilian13 0.07% U.S. Virgin Islander12 0.07% Lithuanian12 0.07% Croatian9 0.05% Arab9 0.05% Greek8 0.04% Slavic7 0.04% Slovak
Geographical mobility in South Riding Same house 1 year ago 12,398 92.6% White (Caucasian)2,576 78.2% Black or African American120 85.6% American Indian / Alaska Native11,046 85.4% Asian12 95.3% Native Hawaiian / Pacific Islander1,319 84.2% Other race3,157 92.3% Two or more races12,184 92.2% White alone, not Hispanic / Latino2,902 88.7% Hispanic or LatinoMoved within same county 419 3.1% White / Caucasian130 3.9% Black or African American518 4.0% Asian67 4.3% Other race156 4.6% Two or more races453 3.4% White alone, not Hispanic / Latino58 1.8% Hispanic or LatinoMoved within same state 441 3.3% White / Caucasian254 7.7% Black or African American761 5.9% Asian171 10.9% Other race64 1.9% Two or more races458 3.5% White alone, not Hispanic / Latino183 5.6% Hispanic or LatinoMoved from different state 201 1.5% White / Caucasian198 6.0% Black or African American443 3.4% Asian13 0.8% Other race12 0.3% Two or more races180 1.4% White alone, not Hispanic / Latino222 6.8% Hispanic or LatinoMoved from abroad 12 0.1% White19 13.6% American Indian / Alaska Native230 1.8% Asian38 1.1% Two or more races12 0.1% White alone, not Hispanic / Latino28 0.9% Hispanic or Latino
Children Nativity (place of birth) in South Riding
Children under 6 years - Living with two parents Both parents native 718 100.0% NativeBoth parents foreign-born 1,039 94.6% Native59 5.4% Foreign-bornOne native, one foreign-born parent 326 100.0% NativeChildren under 6 years - Living with one parent Native parent 54 100.0% NativeForeign-born parent 132 100.0% NativeChildren 6 to 17 years - Living with two parents Both parents native 2,351 100.0% NativeBoth parents foreign-born 2,394 86.1% Native385 13.9% Foreign-bornOne native, one foreign-born parent 920 100.0% NativeChildren 6 to 17 years - Living with one parent Native parent 872 100.0% NativeForeign-born parent 403 48.3% Native431 51.7% Foreign-born
Grandparents responsible for own grandchildren in South Riding
Grandparents (30 to 59 years) White / Caucasian 7 32.0% Responsible for grandchildren15 68.0% Not responsible for grandchildrenAsian 159 100.0% Not responsible for grandchildrenOther race 61 100.0% Not responsible for grandchildrenTwo or more races 13 100.0% Responsible for grandchildrenWhite alone, not Hispanic / Latino 7 30.1% Responsible for grandchildren17 69.9% Not responsible for grandchildrenHispanic or Latino 34 100.0% Not responsible for grandchildrenGrandparents (60 years and over) White / Caucasian 10 6.9% Responsible for grandchildren141 93.1% Not responsible for grandchildrenAsian 218 100.0% Not responsible for grandchildrenOther race 23 100.0% Not responsible for grandchildrenTwo or more races 31 80.5% Responsible for grandchildren8 19.5% Not responsible for grandchildrenWhite alone, not Hispanic / Latino 11 9.1% Responsible for grandchildren105 90.9% Not responsible for grandchildrenHispanic or Latino 30 32.0% Responsible for grandchildren65 68.0% Not responsible for grandchildren