Races in Slidell, Louisiana (LA) Detailed Stats
Data:
Races - White alone (%)
Races - White alone (% change since 2000)
Races - Black alone (%)
Races - Black alone (% change since 2000)
Races - American Indian alone (%)
Races - American Indian alone (% change since 2000)
Races - Asian alone (%)
Races - Asian alone (% change since 2000)
Races - Hispanic (%)
Races - Hispanic (% change since 2000)
Races - Native Hawaiian and Other Pacific Islander alone (%)
Races - Native Hawaiian and Other Pacific Islander alone (% change since 2000)
Races - Two or more races(%)
Races - Two or more races(% change since 2000)
Races - Other race alone (%)
Races - Other race alone (% change since 2000)
Racial diversity
Place of birth - Born in state of residence (%)
Place of birth - Born in state of residence (%) - White
Place of birth - Born in state of residence (%) - Black or African American
Place of birth - Born in state of residence (%) - Asian
Place of birth - Born in state of residence (%) - Hispanic or Latino
Place of birth - Born in state of residence (%) - American Indian and Alaska Native
Place of birth - Born in state of residence (%) - Multirace
Place of birth - Born in state of residence (%) - Other Race
Place of birth - Born in other state (%)
Place of birth - Born in other state (%) - White
Place of birth - Born in other state (%) - Black or African American
Place of birth - Born in other state (%) - Asian
Place of birth - Born in other state (%) - Hispanic or Latino
Place of birth - Born in other state (%) - American Indian and Alaska Native
Place of birth - Born in other state (%) - Multirace
Place of birth - Born in other state (%) - Other Race
Place of birth - Native, outside of US (%)
Place of birth - Native, outside of US (%) - White
Place of birth - Native, outside of US (%) - Black or African American
Place of birth - Native, outside of US (%) - Asian
Place of birth - Native, outside of US (%) - Hispanic or Latino
Place of birth - Native, outside of US (%) - American Indian and Alaska Native
Place of birth - Native, outside of US (%) - Multirace
Place of birth - Native, outside of US (%) - Other Race
Place of birth - Foreign born (%)
Place of birth - Foreign born (%) - White
Place of birth - Foreign born (%) - Black or African American
Place of birth - Foreign born (%) - Asian
Place of birth - Foreign born (%) - Hispanic or Latino
Place of birth - Foreign born (%) - American Indian and Alaska Native
Place of birth - Foreign born (%) - Multirace
Place of birth - Foreign born (%) - Other Race
Residents speaking English at home (%)
Residents speaking English at home - Born in the United States (%)
Residents speaking English at home - Native, born elsewhere (%)
Residents speaking English at home - Foreign born (%)
Residents speaking Spanish at home (%)
Residents speaking Spanish at home - Born in the United States (%)
Residents speaking Spanish at home - Native, born elsewhere (%)
Residents speaking Spanish at home - Foreign born (%)
Residents speaking other language at home (%)
Residents speaking other language at home - Born in the United States (%)
Residents speaking other language at home - Native, born elsewhere (%)
Residents speaking other language at home - Foreign born (%)
Marital status - Never married (%)
Marital status - Now married (%)
Marital status - Separated (%)
Marital status - Widowed (%)
Marital status - Divorced (%)
Ancestries Reported - Arab (%)
Ancestries Reported - Czech (%)
Ancestries Reported - Danish (%)
Ancestries Reported - Dutch (%)
Ancestries Reported - English (%)
Ancestries Reported - French (%)
Ancestries Reported - French Canadian (%)
Ancestries Reported - German (%)
Ancestries Reported - Greek (%)
Ancestries Reported - Hungarian (%)
Ancestries Reported - Irish (%)
Ancestries Reported - Italian (%)
Ancestries Reported - Lithuanian (%)
Ancestries Reported - Norwegian (%)
Ancestries Reported - Polish (%)
Ancestries Reported - Portuguese (%)
Ancestries Reported - Russian (%)
Ancestries Reported - Scotch-Irish (%)
Ancestries Reported - Scottish (%)
Ancestries Reported - Slovak (%)
Ancestries Reported - Subsaharan African (%)
Ancestries Reported - Swedish (%)
Ancestries Reported - Swiss (%)
Ancestries Reported - Ukrainian (%)
Ancestries Reported - United States (%)
Ancestries Reported - Welsh (%)
Ancestries Reported - West Indian (%)
Ancestries Reported - Other (%)
Geographical mobility - Same house 1 year ago (%)
Geographical mobility - Same house 1 year ago (%) - White
Geographical mobility - Same house 1 year ago (%) - Black or African American
Geographical mobility - Same house 1 year ago (%) - Asian
Geographical mobility - Same house 1 year ago (%) - Hispanic or Latino
Geographical mobility - Same house 1 year ago (%) - American Indian and Alaska Native
Geographical mobility - Same house 1 year ago (%) - Multirace
Geographical mobility - Same house 1 year ago (%) - Other Race
Geographical mobility - Moved within same county (%)
Geographical mobility - Moved within same county (%) - White
Geographical mobility - Moved within same county (%) - Black or African American
Geographical mobility - Moved within same county (%) - Asian
Geographical mobility - Moved within same county (%) - Hispanic or Latino
Geographical mobility - Moved within same county (%) - American Indian and Alaska Native
Geographical mobility - Moved within same county (%) - Multirace
Geographical mobility - Moved within same county (%) - Other Race
Geographical mobility - Moved from different county within same state (%)
Geographical mobility - Moved from different county within same state (%) - White
Geographical mobility - Moved from different county within same state (%) - Black or African American
Geographical mobility - Moved from different county within same state (%) - Asian
Geographical mobility - Moved from different county within same state (%) - Hispanic or Latino
Geographical mobility - Moved from different county within same state (%) - American Indian and Alaska Native
Geographical mobility - Moved from different county within same state (%) - Multirace
Geographical mobility - Moved from different county within same state (%) - Other Race
Geographical mobility - Moved from different state (%)
Geographical mobility - Moved from different state (%) - White
Geographical mobility - Moved from different state (%) - Black or African American
Geographical mobility - Moved from different state (%) - Asian
Geographical mobility - Moved from different state (%) - Hispanic or Latino
Geographical mobility - Moved from different state (%) - American Indian and Alaska Native
Geographical mobility - Moved from different state (%) - Multirace
Geographical mobility - Moved from different state (%) - Other Race
Geographical mobility - Moved from abroad (%)
Geographical mobility - Moved from abroad (%) - White
Geographical mobility - Moved from abroad (%) - Black or African American
Geographical mobility - Moved from abroad (%) - Asian
Geographical mobility - Moved from abroad (%) - Hispanic or Latino
Geographical mobility - Moved from abroad (%) - American Indian and Alaska Native
Geographical mobility - Moved from abroad (%) - Multirace
Geographical mobility - Moved from abroad (%) - Other Race
Place of birth for the foreign-born population - Ireland (%)
Place of birth for the foreign-born population - Denmark (%)
Place of birth for the foreign-born population - Norway (%)
Place of birth for the foreign-born population - Sweden (%)
Place of birth for the foreign-born population - United Kingdom (%)
Place of birth for the foreign-born population - England (%)
Place of birth for the foreign-born population - Scotland (%)
Place of birth for the foreign-born population - Other Northern Europe (%)
Place of birth for the foreign-born population - Austria (%)
Place of birth for the foreign-born population - Belgium (%)
Place of birth for the foreign-born population - France (%)
Place of birth for the foreign-born population - Germany (%)
Place of birth for the foreign-born population - Netherlands (%)
Place of birth for the foreign-born population - Switzerland (%)
Place of birth for the foreign-born population - Other Western Europe (%)
Place of birth for the foreign-born population - Greece (%)
Place of birth for the foreign-born population - Italy (%)
Place of birth for the foreign-born population - Portugal (%)
Place of birth for the foreign-born population - Spain (%)
Place of birth for the foreign-born population - Other Southern Europe (%)
Place of birth for the foreign-born population - Albania (%)
Place of birth for the foreign-born population - Belarus (%)
Place of birth for the foreign-born population - Bosnia and Herzegovina (%)
Place of birth for the foreign-born population - Bulgaria (%)
Place of birth for the foreign-born population - Croatia (%)
Place of birth for the foreign-born population - Czechoslovakia (%)
Place of birth for the foreign-born population - Hungary (%)
Place of birth for the foreign-born population - Latvia (%)
Place of birth for the foreign-born population - Lithuania (%)
Place of birth for the foreign-born population - North Macedonia (Macedonia) (%)
Place of birth for the foreign-born population - Moldova (%)
Place of birth for the foreign-born population - Poland (%)
Place of birth for the foreign-born population - Romania (%)
Place of birth for the foreign-born population - Russia (%)
Place of birth for the foreign-born population - Serbia (%)
Place of birth for the foreign-born population - Ukraine (%)
Place of birth for the foreign-born population - Other Eastern Europe (%)
Place of birth for the foreign-born population - China (%)
Place of birth for the foreign-born population - Hong Kong (%)
Place of birth for the foreign-born population - Taiwan (%)
Place of birth for the foreign-born population - Japan (%)
Place of birth for the foreign-born population - Korea (%)
Place of birth for the foreign-born population - Other Eastern Asia (%)
Place of birth for the foreign-born population - Afghanistan (%)
Place of birth for the foreign-born population - Bangladesh (%)
Place of birth for the foreign-born population - India (%)
Place of birth for the foreign-born population - Iran (%)
Place of birth for the foreign-born population - Kazakhstan (%)
Place of birth for the foreign-born population - Nepal (%)
Place of birth for the foreign-born population - Pakistan (%)
Place of birth for the foreign-born population - Sri Lanka (%)
Place of birth for the foreign-born population - Uzbekistan (%)
Place of birth for the foreign-born population - Other South Central Asia (%)
Place of birth for the foreign-born population - Burma (%)
Place of birth for the foreign-born population - Cambodia (%)
Place of birth for the foreign-born population - Indonesia (%)
Place of birth for the foreign-born population - Laos (%)
Place of birth for the foreign-born population - Malaysia (%)
Place of birth for the foreign-born population - Philippines (%)
Place of birth for the foreign-born population - Singapore (%)
Place of birth for the foreign-born population - Thailand (%)
Place of birth for the foreign-born population - Vietnam (%)
Place of birth for the foreign-born population - Other South Eastern Asia (%)
Place of birth for the foreign-born population - Armenia (%)
Place of birth for the foreign-born population - Iraq (%)
Place of birth for the foreign-born population - Israel (%)
Place of birth for the foreign-born population - Jordan (%)
Place of birth for the foreign-born population - Kuwait (%)
Place of birth for the foreign-born population - Lebanon (%)
Place of birth for the foreign-born population - Saudi Arabia (%)
Place of birth for the foreign-born population - Syria (%)
Place of birth for the foreign-born population - Turkey (%)
Place of birth for the foreign-born population - Yemen (%)
Place of birth for the foreign-born population - Other Western Asia (%)
Place of birth for the foreign-born population - Eritrea (%)
Place of birth for the foreign-born population - Ethiopia (%)
Place of birth for the foreign-born population - Kenya (%)
Place of birth for the foreign-born population - Somalia (%)
Place of birth for the foreign-born population - Uganda (%)
Place of birth for the foreign-born population - Zimbabwe (%)
Place of birth for the foreign-born population - Other Eastern Africa (%)
Place of birth for the foreign-born population - Cameroon (%)
Place of birth for the foreign-born population - Congo (%)
Place of birth for the foreign-born population - Democratic Republic of Congo (Zaire) (%)
Place of birth for the foreign-born population - Other Middle Africa (%)
Place of birth for the foreign-born population - Egypt (%)
Place of birth for the foreign-born population - Morocco (%)
Place of birth for the foreign-born population - Sudan (%)
Place of birth for the foreign-born population - Other Northern Africa (%)
Place of birth for the foreign-born population - South Africa (%)
Place of birth for the foreign-born population - Other Southern Africa (%)
Place of birth for the foreign-born population - Cabo Verde (%)
Place of birth for the foreign-born population - Ghana (%)
Place of birth for the foreign-born population - Liberia (%)
Place of birth for the foreign-born population - Nigeria (%)
Place of birth for the foreign-born population - Senegal (%)
Place of birth for the foreign-born population - Sierra Leone (%)
Place of birth for the foreign-born population - Other Western Africa (%)
Place of birth for the foreign-born population - Australia (%)
Place of birth for the foreign-born population - New Zealand (%)
Place of birth for the foreign-born population - Fiji (%)
Place of birth for the foreign-born population - Micronesia (%)
Place of birth for the foreign-born population - Bahamas (%)
Place of birth for the foreign-born population - Barbados (%)
Place of birth for the foreign-born population - Cuba (%)
Place of birth for the foreign-born population - Dominica (%)
Place of birth for the foreign-born population - Dominican Republic (%)
Place of birth for the foreign-born population - Grenada (%)
Place of birth for the foreign-born population - Haiti (%)
Place of birth for the foreign-born population - Jamaica (%)
Place of birth for the foreign-born population - St. Vincent and the Grenadines (%)
Place of birth for the foreign-born population - Trinidad and Tobago (%)
Place of birth for the foreign-born population - West Indies (%)
Place of birth for the foreign-born population - Other Caribbean (%)
Place of birth for the foreign-born population - Belize (%)
Place of birth for the foreign-born population - Costa Rica (%)
Place of birth for the foreign-born population - El Salvador (%)
Place of birth for the foreign-born population - Guatemala (%)
Place of birth for the foreign-born population - Honduras (%)
Place of birth for the foreign-born population - Mexico (%)
Place of birth for the foreign-born population - Nicaragua (%)
Place of birth for the foreign-born population - Panama (%)
Place of birth for the foreign-born population - Other Central America (%)
Place of birth for the foreign-born population - Argentina (%)
Place of birth for the foreign-born population - Bolivia (%)
Place of birth for the foreign-born population - Brazil (%)
Place of birth for the foreign-born population - Chile (%)
Place of birth for the foreign-born population - Colombia (%)
Place of birth for the foreign-born population - Ecuador (%)
Place of birth for the foreign-born population - Guyana (%)
Place of birth for the foreign-born population - Peru (%)
Place of birth for the foreign-born population - Uruguay (%)
Place of birth for the foreign-born population - Venezuela (%)
Place of birth for the foreign-born population - Other South America (%)
Place of birth for the foreign-born population - Canada (%)
Place of birth for the foreign-born population - Other Northern America (%)
Place of birth for the foreign-born population - Other (%)
Latest news about races in Slidell, LA collected exclusively by city-data.com from local newspapers, TV, and radio stations
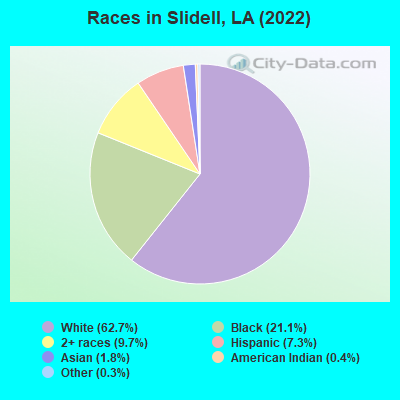
According to 2022 data, the most numerous races in Slidell, LA are White alone (18,462 residents), Black alone (6,209 residents), and Hispanic (2,147 residents). 93.8% of Slidell residents speak English at home. 3.9% of Slidell, LA residents are foreign-born (1.5% born in Asia, 1.3% born in Latin America, 1.1% born in Europe), which is about the same as the foreign-born rate of 4.0% across the entire state of Louisiana.
Race distribution in Slidell
2000 2022
2,794,391 62.5% White alone 1,443,390 32.3% Black alone 107,738 2.4% Hispanic 54,256 1.2% Asian alone 39,260 0.9% Two or more races 24,129 0.5% American Indian alone 4,736 0.1% Other race alone 1,076 0.02% Native Hawaiian and Other
2,603,221 56.7% White alone 1,420,055 30.9% Black alone 262,213 5.7% Hispanic 183,270 4.0% Two or more races 81,169 1.8% Asian alone 19,991 0.4% American Indian alone 18,043 0.4% Other race alone 2,279 0.05% Native Hawaiian and Other
Income and house value in Slidell Median household income in 2022 $73,475 White non-Hispanic householders$47,927 Black householders$40,973 American Indian and Alaska Native householders$63,592 Asian householders$46,521 Two or more races householders$38,081 Hispanic or Latino race householdersMedian 2022 house value $211,016 White Non-Hispanic householders$166,866 Black or African American householders$130,187 American Indian or Alaska Native householders $215,092 Asian householdersover $1,000,000 Native Hawaiian and other Pacific Islander householders$197,432 Some other race householders$184,073 Two or more races householders$221,658 Hispanic or Latino householders
Median age by race in Slidell
44.6 Median age for White residents42.2 46.9 27.1 Median age for Black or African American residents25.5 32.3 20.7 Median age for American Indian / Alaska Native residents16.9 25.1 28.4 Median age for Asian residents23.3 35.9 -821,138,210.6 Median age for Native Hawaiian / Pacific Islander residents-868,167,201.7 -599,999,999.4 41.1 Median age for Other race residents12.2 47.6 21.4 Median age for Two or more races residents12.9 22.6 44.9 Median age for White alone residents42.6 47.2 31.8 Median age for Hispanic or Latino residents23.7 32.2
Owner/renter occupied households by race in Slidell
House owners and renters - White residents 5,940 77.0% Owner occupied1,777 23.0% Renter occupiedHouse owners and renters - Black or African American residents 1,183 52.5% Owner occupied1,069 47.5% Renter occupiedHouse owners and renters - American Indian / Alaska Native residents 69 52.1% Owner occupied64 47.9% Renter occupiedHouse owners and renters - Asian residents 86 51.1% Owner occupied82 48.9% Renter occupiedHouse owners and renters - Other race residents 113 47.4% Owner occupied126 52.6% Renter occupiedHouse owners and renters - Two or more races residents 543 54.3% Owner occupied457 45.7% Renter occupiedHouse owners and renters - White alone residents 5,812 76.6% Owner occupied1,778 23.4% Renter occupiedHouse owners and renters - Hispanic or Latino residents 626 74.0% Owner occupied220 26.0% Renter occupied
Language usage in Slidell
English speakers - Total 93.8% of residents of Slidell speak English at home.
3.4% of residents speak Spanish at home 728 77.7% Speak English very well209 22.3% Speak English less than very well2.9% of residents speak other language at home 599 73.7% Speak English very well214 26.3% Speak English less than very well
English speakers - Born in the United States 93.9% of residents of Slidell speak English at home.
3.5% of residents speak Spanish at home 239 86.3% Speak English very well38 13.7% Speak English less than very well0.4% of residents speak other language at home 34 100.0% Speak English very well
English speakers - Native, born elsewhere 89.1% of residents of Slidell speak English at home.
4.1% of residents speak Spanish at home 16 100.0% Speak English less than very well6.6% of residents speak other language at home 26 100.0% Speak English less than very well
English speakers - Foreign-born 23.0% of residents of Slidell speak English at home.
27.6% of residents speak Spanish at home 184 70.2% Speak English very well78 29.8% Speak English less than very well48.3% of residents speak other language at home 333 72.7% Speak English very well125 27.3% Speak English less than very well
White (Caucasian) - Speak only English Native:
98.2% (17,381)Foreign-born:
56.7% (164)
White (Caucasian) - Speak another language Native:
1.8% (324)Foreign-born:
45.5% (132)
Black or African American - Speak only English Native:
99.1% (5,046)Foreign-born:
97.5% (24)
American Indian / Alaska Native - Speak another language Native:
82.1% (258)Foreign-born:
100.0% (215)
Asian - Speak only English Native:
45.2% (149)Foreign-born:
5.8% (18)
Asian - Speak another language Native:
56.9% (188)Foreign-born:
96.3% (302)
Other race - Speak another language Native:
10.5% (55)Foreign-born:
100.0% (20)
Two or more races - Speak only English Native:
95.9% (3,075)Foreign-born:
32.1% (39)
Two or more races - Speak another language Native:
4.8% (154)Foreign-born:
51.3% (62)
White alone - Speak only English Native:
98.4% (17,178)Foreign-born:
57.3% (187)
White alone - Speak another language Native:
1.6% (281)Foreign-born:
36.0% (117)
Hispanic or Latino - Speak only English Native:
75.0% (1,374)Foreign-born:
1.1% (3)
Hispanic or Latino - Speak another language Native:
24.7% (454)Foreign-born:
100.0% (261)
Foreign-born residents in Slidell 1,159 residents are foreign born (1.5% Asia , 1.3% Latin America , 1.1% Europe ).
This city:
3.9%Louisiana:
4.2%
Marital status for residents in Slidell Marital status - White (Caucasian) population 15 years and over
Males 28.8% Never married50.6% Now married4.1% Separated3.0% Widowed13.5% DivorcedFemales 21.0% Never married44.7% Now married1.3% Separated12.5% Widowed20.4% DivorcedWomen who gave birth in the past 12 months Now married:
43.4% (93)Unmarried:
56.6% (121)
Women who did not give birth in the past 12 months Now married:
46.5% (1,835)Unmarried:
53.5% (2,115)
Marital status - Black or African American population 15 years and over
Males 44.8% Never married34.8% Now married3.8% Separated3.0% Widowed13.6% DivorcedFemales 44.7% Never married28.7% Now married1.7% Separated8.4% Widowed16.5% DivorcedWomen who gave birth in the past 12 months Now married:
55.8% (112)Unmarried:
44.2% (89)
Women who did not give birth in the past 12 months Now married:
30.8% (541)Unmarried:
69.2% (1,217)
Marital status - American Indian / Alaska Native population 15 years and over
Males 42.5% Never married54.4% Now married0.0% Separated0.0% Widowed3.1% DivorcedFemales 69.1% Never married22.9% Now married0.0% Separated8.0% Widowed0.0% DivorcedWomen who gave birth in the past 12 months Now married:
0.0% (0)Unmarried:
100.0% (8)
Women who did not give birth in the past 12 months Now married:
25.0% (33)Unmarried:
75.0% (100)
Marital status - Asian population 15 years and over
Males 33.2% Never married59.0% Now married0.0% Separated0.0% Widowed7.9% DivorcedFemales 23.8% Never married67.2% Now married0.0% Separated3.4% Widowed5.6% DivorcedWomen who did not give birth in the past 12 months Now married:
52.5% (109)Unmarried:
47.5% (99)
Marital status - Other race population 15 years and over
Males 23.3% Never married76.7% Now married0.0% Separated0.0% Widowed0.0% DivorcedFemales 15.5% Never married24.8% Now married0.0% Separated0.0% Widowed59.7% DivorcedWomen who did not give birth in the past 12 months Now married:
35.0% (38)Unmarried:
65.0% (71)
Marital status - Two or more races population 15 years and over
Males 35.6% Never married54.5% Now married0.0% Separated0.0% Widowed10.0% DivorcedFemales 45.9% Never married17.8% Now married13.7% Separated14.2% Widowed8.5% DivorcedWomen who gave birth in the past 12 months Now married:
1.1% (1)Unmarried:
98.9% (129)
Women who did not give birth in the past 12 months Now married:
25.3% (152)Unmarried:
74.7% (448)
Marital status - White alone, not Hispanic / Latino population 15 years and over
Males 28.8% Never married50.4% Now married4.2% Separated3.0% Widowed13.7% DivorcedFemales 20.9% Never married44.6% Now married1.3% Separated12.8% Widowed20.3% DivorcedWomen who gave birth in the past 12 months Now married:
41.3% (87)Unmarried:
58.7% (123)
Women who did not give birth in the past 12 months Now married:
46.1% (1,790)Unmarried:
53.9% (2,097)
Marital status - Hispanic or Latino population 15 years and over
Males 35.7% Never married58.5% Now married1.4% Separated1.2% Widowed3.2% DivorcedFemales 37.1% Never married31.1% Now married0.0% Separated11.1% Widowed20.6% DivorcedWomen who gave birth in the past 12 months Now married:
22.9% (9)Unmarried:
77.1% (29)
Women who did not give birth in the past 12 months Now married:
35.3% (197)Unmarried:
64.7% (361)
Ancestries in Slidell
3,363 24.0% American1,312 9.4% French920 6.6% Italian829 5.9% English779 5.6% Irish562 4.0% German223 1.6% Ukrainian135 1.0% Belizean80 0.6% Portuguese78 0.6% Welsh76 0.5% Scottish65 0.5% European65 0.5% Swiss60 0.4% Polish59 0.4% Haitian51 0.4% Norwegian50 0.4% French Canadian48 0.3% Scotch-Irish46 0.3% Dutch30 0.2% Eastern European27 0.2% Slovak23 0.2% Lithuanian22 0.2% Lebanese22 0.2% Greek20 0.1% Brazilian20 0.1% Canadian15 0.1% Ghanaian12 0.09% Jordanian12 0.09% Iranian10 0.07% West Indian8 0.06% African7 0.05% British7 0.05% Cajun5 0.04% Danish1 0.01% Jamaican
Geographical mobility in Slidell Same house 1 year ago 15,948 86.1% White (Caucasian)4,531 82.6% Black or African American504 98.3% American Indian / Alaska Native377 62.2% Asian353 96.6% Other race2,795 91.3% Two or more races15,757 86.3% White alone, not Hispanic / Latino1,784 88.6% Hispanic or LatinoMoved within same county 1,104 6.0% White / Caucasian163 3.0% Black or African American67 11.1% Asian3 0.8% Other race182 5.9% Two or more races1,096 6.0% White alone, not Hispanic / Latino112 5.6% Hispanic or LatinoMoved within same state 567 3.1% White / Caucasian274 5.0% Black or African American9 1.7% American Indian / Alaska Native38 6.2% Asian54 1.8% Two or more races566 3.1% White alone, not Hispanic / Latino21 1.1% Hispanic or LatinoMoved from different state 929 5.0% White / Caucasian555 10.1% Black or African American200 33.0% Asian18 0.6% Two or more races855 4.7% White alone, not Hispanic / Latino70 3.5% Hispanic or LatinoMoved from abroad 11 0.1% White9 0.3% Two or more races12 0.1% White alone, not Hispanic / Latino1 0.1% Hispanic or Latino
Children Nativity (place of birth) in Slidell
Children under 6 years - Living with two parents Both parents native 1,062 100.0% NativeBoth parents foreign-born 113 100.0% NativeOne native, one foreign-born parent 58 100.0% NativeChildren under 6 years - Living with one parent Native parent 653 96.3% Native25 3.7% Foreign-bornForeign-born parent 4 100.0% Native
Children 6 to 17 years - Living with two parents Both parents native 1,758 100.0% NativeBoth parents foreign-born 249 100.0% NativeOne native, one foreign-born parent 9 100.0% NativeChildren 6 to 17 years - Living with one parent Native parent 2,548 96.9% Native82 3.1% Foreign-born
Grandparents responsible for own grandchildren in Slidell
Grandparents (30 to 59 years) White / Caucasian 51 64.8% Responsible for grandchildren28 35.2% Not responsible for grandchildrenBlack or African American 14 100.0% Not responsible for grandchildrenAmerican Indian / Alaska Native 16 100.0% Responsible for grandchildrenAsian 25 100.0% Not responsible for grandchildrenOther race 3 100.0% Not responsible for grandchildrenWhite alone, not Hispanic / Latino 56 66.1% Responsible for grandchildren29 33.9% Not responsible for grandchildrenHispanic or Latino 14 32.5% Responsible for grandchildren29 67.5% Not responsible for grandchildrenGrandparents (60 years and over) White / Caucasian 87 44.9% Responsible for grandchildren107 55.1% Not responsible for grandchildrenBlack or African American 37 32.9% Responsible for grandchildren76 67.1% Not responsible for grandchildrenAsian 8 100.0% Not responsible for grandchildrenWhite alone, not Hispanic / Latino 87 45.8% Responsible for grandchildren103 54.2% Not responsible for grandchildren