Races in Selma, Texas (TX) Detailed Stats
Data:
Races - White alone (%)
Races - White alone (% change since 2000)
Races - Black alone (%)
Races - Black alone (% change since 2000)
Races - American Indian alone (%)
Races - American Indian alone (% change since 2000)
Races - Asian alone (%)
Races - Asian alone (% change since 2000)
Races - Hispanic (%)
Races - Hispanic (% change since 2000)
Races - Native Hawaiian and Other Pacific Islander alone (%)
Races - Native Hawaiian and Other Pacific Islander alone (% change since 2000)
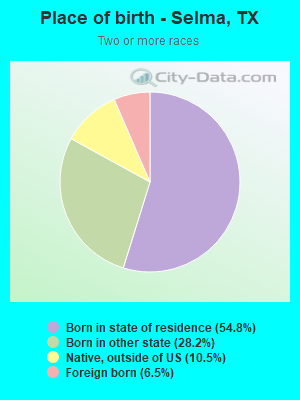
Races - Two or more races(%)
Races - Two or more races(% change since 2000)
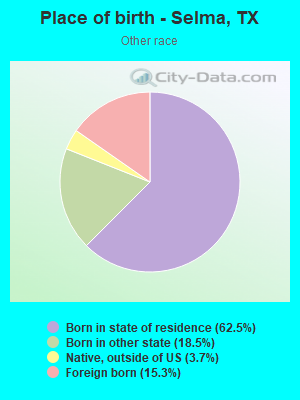
Races - Other race alone (%)
Races - Other race alone (% change since 2000)
Racial diversity
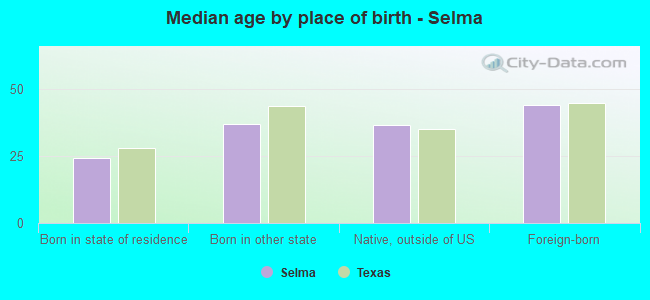
Place of birth - Born in state of residence (%)
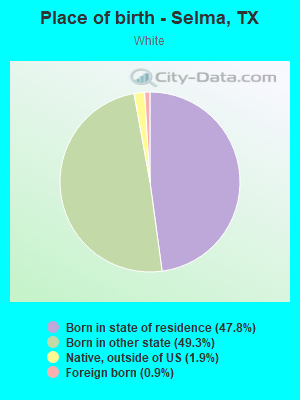
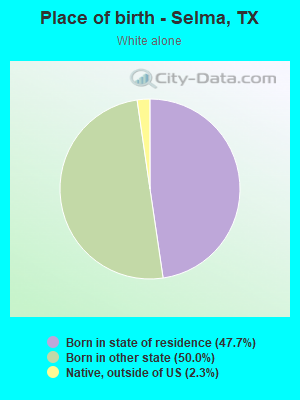
Place of birth - Born in state of residence (%) - White
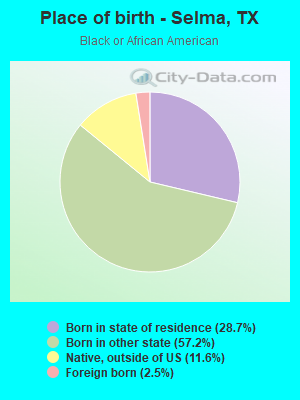
Place of birth - Born in state of residence (%) - Black or African American
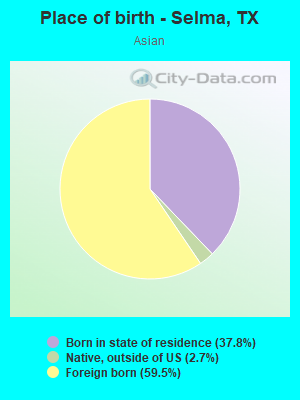
Place of birth - Born in state of residence (%) - Asian
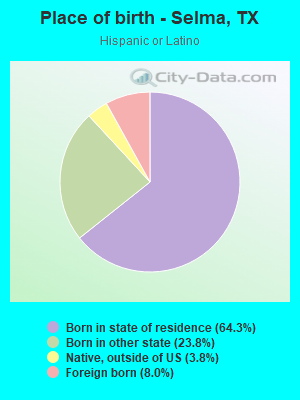
Place of birth - Born in state of residence (%) - Hispanic or Latino
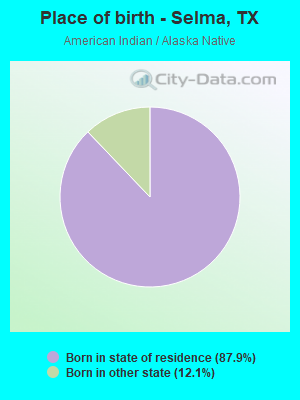
Place of birth - Born in state of residence (%) - American Indian and Alaska Native
Place of birth - Born in state of residence (%) - Multirace
Place of birth - Born in state of residence (%) - Other Race
Place of birth - Born in other state (%)
Place of birth - Born in other state (%) - White
Place of birth - Born in other state (%) - Black or African American
Place of birth - Born in other state (%) - Asian
Place of birth - Born in other state (%) - Hispanic or Latino
Place of birth - Born in other state (%) - American Indian and Alaska Native
Place of birth - Born in other state (%) - Multirace
Place of birth - Born in other state (%) - Other Race
Place of birth - Native, outside of US (%)
Place of birth - Native, outside of US (%) - White
Place of birth - Native, outside of US (%) - Black or African American
Place of birth - Native, outside of US (%) - Asian
Place of birth - Native, outside of US (%) - Hispanic or Latino
Place of birth - Native, outside of US (%) - American Indian and Alaska Native
Place of birth - Native, outside of US (%) - Multirace
Place of birth - Native, outside of US (%) - Other Race
Place of birth - Foreign born (%)
Place of birth - Foreign born (%) - White
Place of birth - Foreign born (%) - Black or African American
Place of birth - Foreign born (%) - Asian
Place of birth - Foreign born (%) - Hispanic or Latino
Place of birth - Foreign born (%) - American Indian and Alaska Native
Place of birth - Foreign born (%) - Multirace
Place of birth - Foreign born (%) - Other Race
Residents speaking English at home (%)
Residents speaking English at home - Born in the United States (%)
Residents speaking English at home - Native, born elsewhere (%)
Residents speaking English at home - Foreign born (%)
Residents speaking Spanish at home (%)
Residents speaking Spanish at home - Born in the United States (%)
Residents speaking Spanish at home - Native, born elsewhere (%)
Residents speaking Spanish at home - Foreign born (%)
Residents speaking other language at home (%)
Residents speaking other language at home - Born in the United States (%)
Residents speaking other language at home - Native, born elsewhere (%)
Residents speaking other language at home - Foreign born (%)
Marital status - Never married (%)
Marital status - Now married (%)
Marital status - Separated (%)
Marital status - Widowed (%)
Marital status - Divorced (%)
Ancestries Reported - Arab (%)
Ancestries Reported - Czech (%)
Ancestries Reported - Danish (%)
Ancestries Reported - Dutch (%)
Ancestries Reported - English (%)
Ancestries Reported - French (%)
Ancestries Reported - French Canadian (%)
Ancestries Reported - German (%)
Ancestries Reported - Greek (%)
Ancestries Reported - Hungarian (%)
Ancestries Reported - Irish (%)
Ancestries Reported - Italian (%)
Ancestries Reported - Lithuanian (%)
Ancestries Reported - Norwegian (%)
Ancestries Reported - Polish (%)
Ancestries Reported - Portuguese (%)
Ancestries Reported - Russian (%)
Ancestries Reported - Scotch-Irish (%)
Ancestries Reported - Scottish (%)
Ancestries Reported - Slovak (%)
Ancestries Reported - Subsaharan African (%)
Ancestries Reported - Swedish (%)
Ancestries Reported - Swiss (%)
Ancestries Reported - Ukrainian (%)
Ancestries Reported - United States (%)
Ancestries Reported - Welsh (%)
Ancestries Reported - West Indian (%)
Ancestries Reported - Other (%)
Geographical mobility - Same house 1 year ago (%)
Geographical mobility - Same house 1 year ago (%) - White
Geographical mobility - Same house 1 year ago (%) - Black or African American
Geographical mobility - Same house 1 year ago (%) - Asian
Geographical mobility - Same house 1 year ago (%) - Hispanic or Latino
Geographical mobility - Same house 1 year ago (%) - American Indian and Alaska Native
Geographical mobility - Same house 1 year ago (%) - Multirace
Geographical mobility - Same house 1 year ago (%) - Other Race
Geographical mobility - Moved within same county (%)
Geographical mobility - Moved within same county (%) - White
Geographical mobility - Moved within same county (%) - Black or African American
Geographical mobility - Moved within same county (%) - Asian
Geographical mobility - Moved within same county (%) - Hispanic or Latino
Geographical mobility - Moved within same county (%) - American Indian and Alaska Native
Geographical mobility - Moved within same county (%) - Multirace
Geographical mobility - Moved within same county (%) - Other Race
Geographical mobility - Moved from different county within same state (%)
Geographical mobility - Moved from different county within same state (%) - White
Geographical mobility - Moved from different county within same state (%) - Black or African American
Geographical mobility - Moved from different county within same state (%) - Asian
Geographical mobility - Moved from different county within same state (%) - Hispanic or Latino
Geographical mobility - Moved from different county within same state (%) - American Indian and Alaska Native
Geographical mobility - Moved from different county within same state (%) - Multirace
Geographical mobility - Moved from different county within same state (%) - Other Race
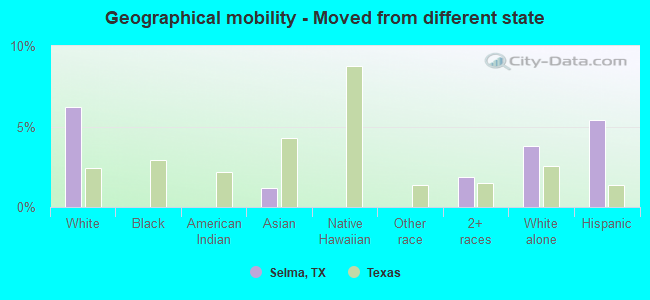
Geographical mobility - Moved from different state (%)
Geographical mobility - Moved from different state (%) - White
Geographical mobility - Moved from different state (%) - Black or African American
Geographical mobility - Moved from different state (%) - Asian
Geographical mobility - Moved from different state (%) - Hispanic or Latino
Geographical mobility - Moved from different state (%) - American Indian and Alaska Native
Geographical mobility - Moved from different state (%) - Multirace
Geographical mobility - Moved from different state (%) - Other Race
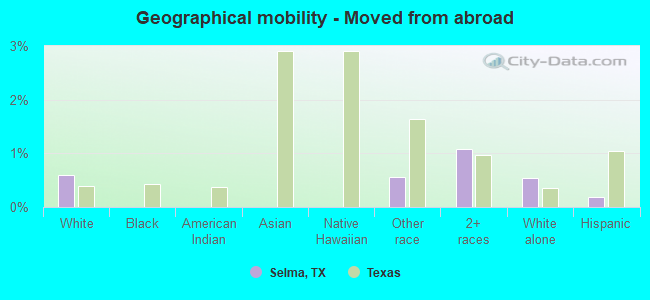
Geographical mobility - Moved from abroad (%)
Geographical mobility - Moved from abroad (%) - White
Geographical mobility - Moved from abroad (%) - Black or African American
Geographical mobility - Moved from abroad (%) - Asian
Geographical mobility - Moved from abroad (%) - Hispanic or Latino
Geographical mobility - Moved from abroad (%) - American Indian and Alaska Native
Geographical mobility - Moved from abroad (%) - Multirace
Geographical mobility - Moved from abroad (%) - Other Race
Place of birth for the foreign-born population - Ireland (%)
Place of birth for the foreign-born population - Denmark (%)
Place of birth for the foreign-born population - Norway (%)
Place of birth for the foreign-born population - Sweden (%)
Place of birth for the foreign-born population - United Kingdom (%)
Place of birth for the foreign-born population - England (%)
Place of birth for the foreign-born population - Scotland (%)
Place of birth for the foreign-born population - Other Northern Europe (%)
Place of birth for the foreign-born population - Austria (%)
Place of birth for the foreign-born population - Belgium (%)
Place of birth for the foreign-born population - France (%)
Place of birth for the foreign-born population - Germany (%)
Place of birth for the foreign-born population - Netherlands (%)
Place of birth for the foreign-born population - Switzerland (%)
Place of birth for the foreign-born population - Other Western Europe (%)
Place of birth for the foreign-born population - Greece (%)
Place of birth for the foreign-born population - Italy (%)
Place of birth for the foreign-born population - Portugal (%)
Place of birth for the foreign-born population - Spain (%)
Place of birth for the foreign-born population - Other Southern Europe (%)
Place of birth for the foreign-born population - Albania (%)
Place of birth for the foreign-born population - Belarus (%)
Place of birth for the foreign-born population - Bosnia and Herzegovina (%)
Place of birth for the foreign-born population - Bulgaria (%)
Place of birth for the foreign-born population - Croatia (%)
Place of birth for the foreign-born population - Czechoslovakia (%)
Place of birth for the foreign-born population - Hungary (%)
Place of birth for the foreign-born population - Latvia (%)
Place of birth for the foreign-born population - Lithuania (%)
Place of birth for the foreign-born population - North Macedonia (Macedonia) (%)
Place of birth for the foreign-born population - Moldova (%)
Place of birth for the foreign-born population - Poland (%)
Place of birth for the foreign-born population - Romania (%)
Place of birth for the foreign-born population - Russia (%)
Place of birth for the foreign-born population - Serbia (%)
Place of birth for the foreign-born population - Ukraine (%)
Place of birth for the foreign-born population - Other Eastern Europe (%)
Place of birth for the foreign-born population - China (%)
Place of birth for the foreign-born population - Hong Kong (%)
Place of birth for the foreign-born population - Taiwan (%)
Place of birth for the foreign-born population - Japan (%)
Place of birth for the foreign-born population - Korea (%)
Place of birth for the foreign-born population - Other Eastern Asia (%)
Place of birth for the foreign-born population - Afghanistan (%)
Place of birth for the foreign-born population - Bangladesh (%)
Place of birth for the foreign-born population - India (%)
Place of birth for the foreign-born population - Iran (%)
Place of birth for the foreign-born population - Kazakhstan (%)
Place of birth for the foreign-born population - Nepal (%)
Place of birth for the foreign-born population - Pakistan (%)
Place of birth for the foreign-born population - Sri Lanka (%)
Place of birth for the foreign-born population - Uzbekistan (%)
Place of birth for the foreign-born population - Other South Central Asia (%)
Place of birth for the foreign-born population - Burma (%)
Place of birth for the foreign-born population - Cambodia (%)
Place of birth for the foreign-born population - Indonesia (%)
Place of birth for the foreign-born population - Laos (%)
Place of birth for the foreign-born population - Malaysia (%)
Place of birth for the foreign-born population - Philippines (%)
Place of birth for the foreign-born population - Singapore (%)
Place of birth for the foreign-born population - Thailand (%)
Place of birth for the foreign-born population - Vietnam (%)
Place of birth for the foreign-born population - Other South Eastern Asia (%)
Place of birth for the foreign-born population - Armenia (%)
Place of birth for the foreign-born population - Iraq (%)
Place of birth for the foreign-born population - Israel (%)
Place of birth for the foreign-born population - Jordan (%)
Place of birth for the foreign-born population - Kuwait (%)
Place of birth for the foreign-born population - Lebanon (%)
Place of birth for the foreign-born population - Saudi Arabia (%)
Place of birth for the foreign-born population - Syria (%)
Place of birth for the foreign-born population - Turkey (%)
Place of birth for the foreign-born population - Yemen (%)
Place of birth for the foreign-born population - Other Western Asia (%)
Place of birth for the foreign-born population - Eritrea (%)
Place of birth for the foreign-born population - Ethiopia (%)
Place of birth for the foreign-born population - Kenya (%)
Place of birth for the foreign-born population - Somalia (%)
Place of birth for the foreign-born population - Uganda (%)
Place of birth for the foreign-born population - Zimbabwe (%)
Place of birth for the foreign-born population - Other Eastern Africa (%)
Place of birth for the foreign-born population - Cameroon (%)
Place of birth for the foreign-born population - Congo (%)
Place of birth for the foreign-born population - Democratic Republic of Congo (Zaire) (%)
Place of birth for the foreign-born population - Other Middle Africa (%)
Place of birth for the foreign-born population - Egypt (%)
Place of birth for the foreign-born population - Morocco (%)
Place of birth for the foreign-born population - Sudan (%)
Place of birth for the foreign-born population - Other Northern Africa (%)
Place of birth for the foreign-born population - South Africa (%)
Place of birth for the foreign-born population - Other Southern Africa (%)
Place of birth for the foreign-born population - Cabo Verde (%)
Place of birth for the foreign-born population - Ghana (%)
Place of birth for the foreign-born population - Liberia (%)
Place of birth for the foreign-born population - Nigeria (%)
Place of birth for the foreign-born population - Senegal (%)
Place of birth for the foreign-born population - Sierra Leone (%)
Place of birth for the foreign-born population - Other Western Africa (%)
Place of birth for the foreign-born population - Australia (%)
Place of birth for the foreign-born population - New Zealand (%)
Place of birth for the foreign-born population - Fiji (%)
Place of birth for the foreign-born population - Micronesia (%)
Place of birth for the foreign-born population - Bahamas (%)
Place of birth for the foreign-born population - Barbados (%)
Place of birth for the foreign-born population - Cuba (%)
Place of birth for the foreign-born population - Dominica (%)
Place of birth for the foreign-born population - Dominican Republic (%)
Place of birth for the foreign-born population - Grenada (%)
Place of birth for the foreign-born population - Haiti (%)
Place of birth for the foreign-born population - Jamaica (%)
Place of birth for the foreign-born population - St. Vincent and the Grenadines (%)
Place of birth for the foreign-born population - Trinidad and Tobago (%)
Place of birth for the foreign-born population - West Indies (%)
Place of birth for the foreign-born population - Other Caribbean (%)
Place of birth for the foreign-born population - Belize (%)
Place of birth for the foreign-born population - Costa Rica (%)
Place of birth for the foreign-born population - El Salvador (%)
Place of birth for the foreign-born population - Guatemala (%)
Place of birth for the foreign-born population - Honduras (%)
Place of birth for the foreign-born population - Mexico (%)
Place of birth for the foreign-born population - Nicaragua (%)
Place of birth for the foreign-born population - Panama (%)
Place of birth for the foreign-born population - Other Central America (%)
Place of birth for the foreign-born population - Argentina (%)
Place of birth for the foreign-born population - Bolivia (%)
Place of birth for the foreign-born population - Brazil (%)
Place of birth for the foreign-born population - Chile (%)
Place of birth for the foreign-born population - Colombia (%)
Place of birth for the foreign-born population - Ecuador (%)
Place of birth for the foreign-born population - Guyana (%)
Place of birth for the foreign-born population - Peru (%)
Place of birth for the foreign-born population - Uruguay (%)
Place of birth for the foreign-born population - Venezuela (%)
Place of birth for the foreign-born population - Other South America (%)
Place of birth for the foreign-born population - Canada (%)
Place of birth for the foreign-born population - Other Northern America (%)
Place of birth for the foreign-born population - Other (%)
Latest news about races in Selma, TX collected exclusively by city-data.com from local newspapers, TV, and radio stations
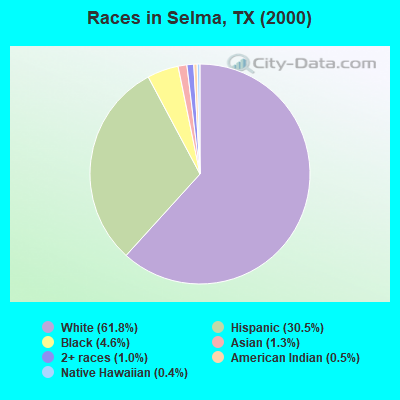
According to 2022 data, the most numerous races in Selma, TX are Hispanic (3,384 residents), White alone (3,516 residents), and Black alone (2,867 residents). 82.2% of Selma residents speak English at home. 6.6% of Selma, TX residents are foreign-born (3.5% born in Asia, 2.7% born in Latin America), which is 156.2% less than the foreign-born rate of 17.0% across the entire state of Texas.
Race distribution in Selma
2000 2022
10,933,313 52.4% White alone 6,669,666 32.0% Hispanic 2,364,255 11.3% Black alone 554,445 2.7% Asian alone 230,567 1.1% Two or more races 68,859 0.3% American Indian alone 19,958 0.10% Other race alone 10,757 0.05% Native Hawaiian and Other
12,070,642 40.2% Hispanic 11,683,430 38.9% White alone 3,508,706 11.7% Black alone 1,608,173 5.4% Asian alone 956,560 3.2% Two or more races 125,763 0.4% Other race alone 47,023 0.2% American Indian alone 29,275 0.10% Native Hawaiian and Other
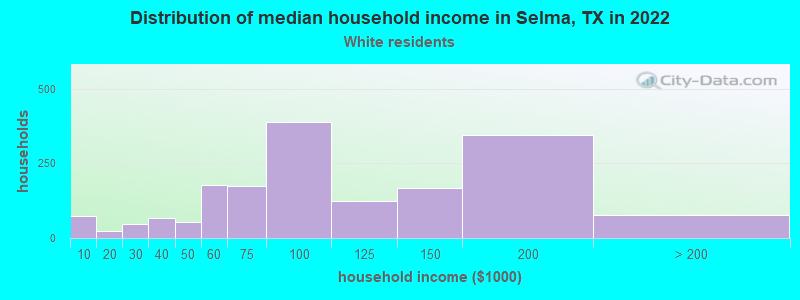
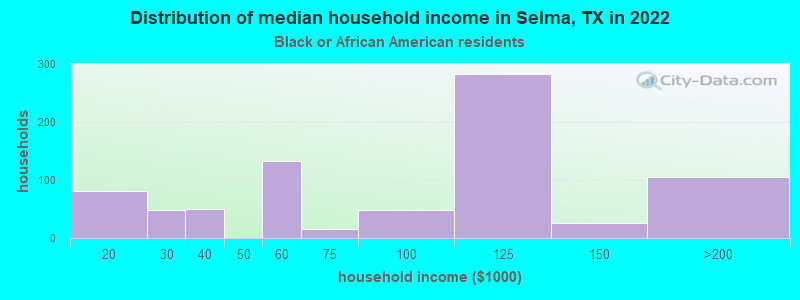
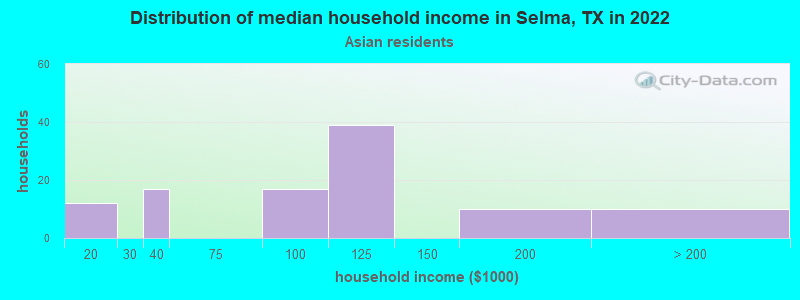
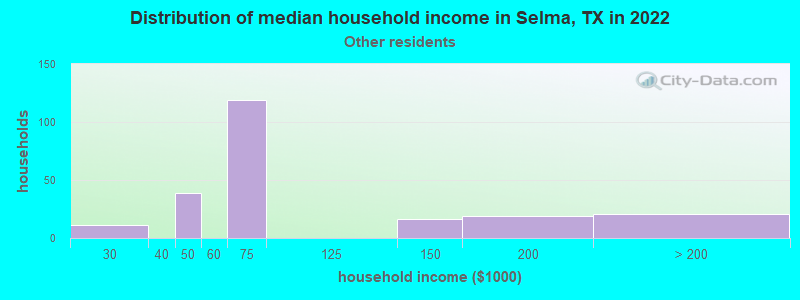
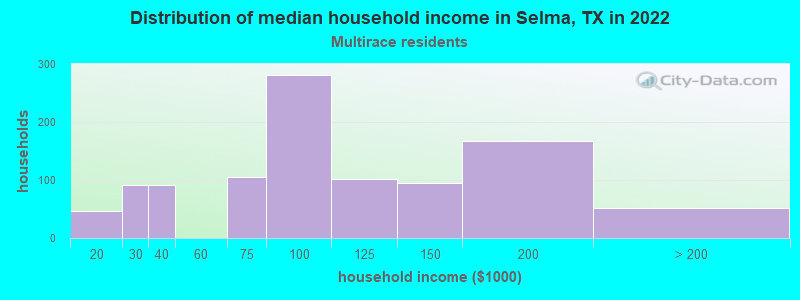
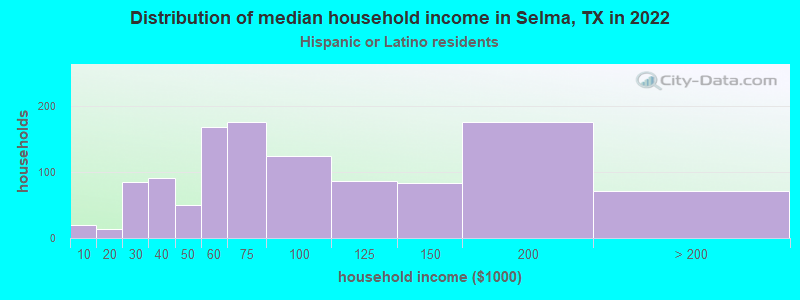
Income and house value in Selma Median household income in 2022 $94,196 White non-Hispanic householders$108,989 Black householders$100,764 Asian householders$73,292 Some other race householders$95,330 Two or more races householders$72,750 Hispanic or Latino race householdersMedian 2022 house value $336,988 White Non-Hispanic householders$434,263 Black or African American householders$173,705 American Indian or Alaska Native householders $127,383 Asian householders$196,866 Some other race householders$434,263 Two or more races householders$199,182 Hispanic or Latino householders
Median age by race in Selma
35.6 Median age for White residents36.5 34.4 32.2 Median age for Black or African American residents26.6 35.4 17.6 Median age for American Indian / Alaska Native residents17.4 17.7 33.5 Median age for Asian residents12.1 36.7 -674,441,204.4 Median age for Native Hawaiian / Pacific Islander residents-596,986,816.7 -748,387,096.0 32.4 Median age for Other race residents28.7 36.1 28.3 Median age for Two or more races residents24.3 37.7 36.0 Median age for White alone residents37.0 33.7 31.6 Median age for Hispanic or Latino residents30.1 32.6
Owner/renter occupied households by race in Selma
House owners and renters - White residents 1,126 65.9% Owner occupied583 34.1% Renter occupiedHouse owners and renters - Black or African American residents 205 24.1% Owner occupied645 75.9% Renter occupiedHouse owners and renters - Asian residents 124 92.1% Owner occupied11 7.9% Renter occupiedHouse owners and renters - Native Hawaiian / Pacific Islander residents 53 100.0% Owner occupiedHouse owners and renters - Other race residents 86 45.5% Owner occupied103 54.5% Renter occupiedHouse owners and renters - Two or more races residents 677 63.7% Owner occupied385 36.3% Renter occupiedHouse owners and renters - White alone residents 976 61.9% Owner occupied600 38.1% Renter occupiedHouse owners and renters - Hispanic or Latino residents 776 67.4% Owner occupied375 32.6% Renter occupied
Language usage in Selma
English speakers - Total 82.2% of residents of Selma speak English at home.
11.8% of residents speak Spanish at home 915 76.4% Speak English very well283 23.6% Speak English less than very well6.8% of residents speak other language at home 547 79.0% Speak English very well145 21.0% Speak English less than very well
English speakers - Born in the United States 91.2% of residents of Selma speak English at home.
7.5% of residents speak Spanish at home 325 97.0% Speak English very well10 3.0% Speak English less than very well2.0% of residents speak other language at home 90 100.0% Speak English very well
English speakers - Native, born elsewhere 91.0% of residents of Selma speak English at home.
5.5% of residents speak Spanish at home 25 73.5% Speak English very well9 26.5% Speak English less than very well
English speakers - Foreign-born 27.0% of residents of Selma speak English at home.
29.9% of residents speak Spanish at home 180 82.6% Speak English very well38 17.4% Speak English less than very well45.5% of residents speak other language at home 184 55.4% Speak English very well148 44.6% Speak English less than very well
White (Caucasian) - Speak another language Native:
7.7% (249)Foreign-born:
90.0% (33)
Black or African American - Speak only English Native:
99.4% (2,702)Foreign-born:
67.8% (50)
Black or African American - Speak another language Native:
1.1% (31)Foreign-born:
25.2% (19)
Asian - Speak only English Native:
31.0% (80)Foreign-born:
26.3% (104)
Asian - Speak another language Native:
62.5% (161)Foreign-born:
74.7% (296)
Other race - Speak only English Native:
82.0% (393)Foreign-born:
58.1% (56)
Other race - Speak another language Native:
16.0% (77)Foreign-born:
30.6% (30)
Two or more races - Speak another language Native:
29.7% (790)Foreign-born:
100.0% (220)
Hispanic or Latino - Speak only English Native:
65.3% (1,697)Foreign-born:
19.6% (54)
Hispanic or Latino - Speak another language Native:
35.2% (916)Foreign-born:
81.3% (223)
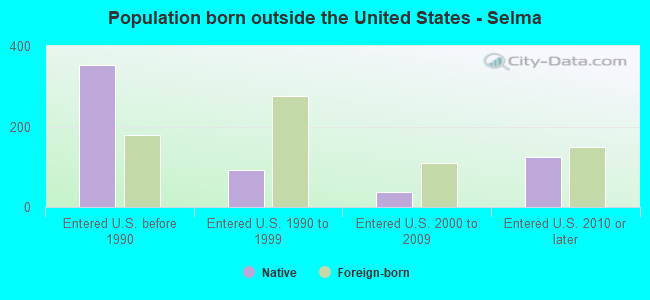
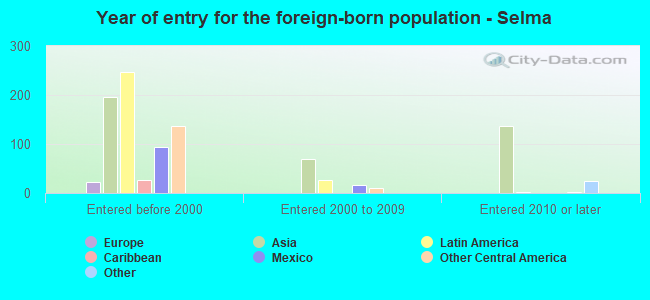
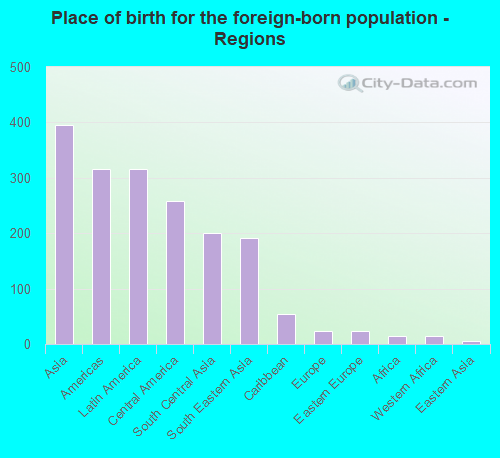
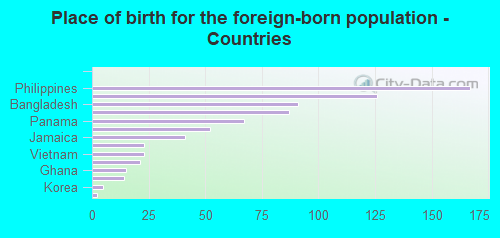
Foreign-born residents in Selma 751 residents are foreign born (3.5% Asia , 2.7% Latin America ).
This city:
6.6%Texas:
17.1%
Marital status for residents in Selma Marital status - White (Caucasian) population 15 years and over
Males 28.8% Never married60.8% Now married2.8% Separated2.1% Widowed5.5% DivorcedFemales 22.0% Never married60.3% Now married5.3% Separated8.2% Widowed4.1% DivorcedWomen who gave birth in the past 12 months Now married:
83.3% (140)Unmarried:
16.7% (28)
Women who did not give birth in the past 12 months Now married:
61.1% (402)Unmarried:
38.9% (256)
Marital status - Black or African American population 15 years and over
Males 55.0% Never married45.0% Now married0.0% Separated0.0% Widowed0.1% DivorcedFemales 37.3% Never married45.8% Now married0.0% Separated3.6% Widowed13.3% DivorcedWomen who gave birth in the past 12 months Now married:
0.0% (0)Unmarried:
100.0% (32)
Women who did not give birth in the past 12 months Now married:
46.0% (368)Unmarried:
54.0% (432)
Marital status - American Indian / Alaska Native population 15 years and over
Males 48.8% Never married0.0% Now married51.2% Separated0.0% Widowed0.0% DivorcedFemales 100.0% Never married0.0% Now married0.0% Separated0.0% Widowed0.0% DivorcedWomen who did not give birth in the past 12 months Now married:
0.0% (0)Unmarried:
100.0% (63)
Marital status - Asian population 15 years and over
Males 18.3% Never married81.7% Now married0.0% Separated0.0% Widowed0.0% DivorcedFemales 3.1% Never married77.3% Now married4.3% Separated0.0% Widowed15.2% DivorcedWomen who did not give birth in the past 12 months Now married:
80.0% (174)Unmarried:
20.0% (43)
Marital status - Other race population 15 years and over
Males 1.9% Never married73.8% Now married0.0% Separated24.3% Widowed0.0% DivorcedFemales 26.1% Never married29.6% Now married23.3% Separated5.5% Widowed15.4% DivorcedWomen who did not give birth in the past 12 months Now married:
52.3% (127)Unmarried:
47.7% (116)
Marital status - Two or more races population 15 years and over
Males 37.1% Never married55.7% Now married0.0% Separated0.0% Widowed7.2% DivorcedFemales 33.7% Never married38.2% Now married9.9% Separated16.8% Widowed1.4% DivorcedWomen who gave birth in the past 12 months Now married:
100.0% (47)Unmarried:
0.0% (0)
Women who did not give birth in the past 12 months Now married:
47.8% (349)Unmarried:
52.2% (382)
Marital status - White alone, not Hispanic / Latino population 15 years and over
Males 28.7% Never married59.7% Now married2.8% Separated2.8% Widowed6.0% DivorcedFemales 23.3% Never married60.1% Now married6.3% Separated8.8% Widowed1.5% DivorcedWomen who gave birth in the past 12 months Now married:
100.0% (84)Unmarried:
0.0% (0)
Women who did not give birth in the past 12 months Now married:
61.7% (437)Unmarried:
38.3% (271)
Marital status - Hispanic or Latino population 15 years and over
Males 28.4% Never married59.7% Now married3.2% Separated2.3% Widowed6.4% DivorcedFemales 22.7% Never married43.6% Now married11.6% Separated13.5% Widowed8.6% DivorcedWomen who gave birth in the past 12 months Now married:
78.1% (143)Unmarried:
21.9% (40)
Women who did not give birth in the past 12 months Now married:
54.8% (367)Unmarried:
45.2% (302)
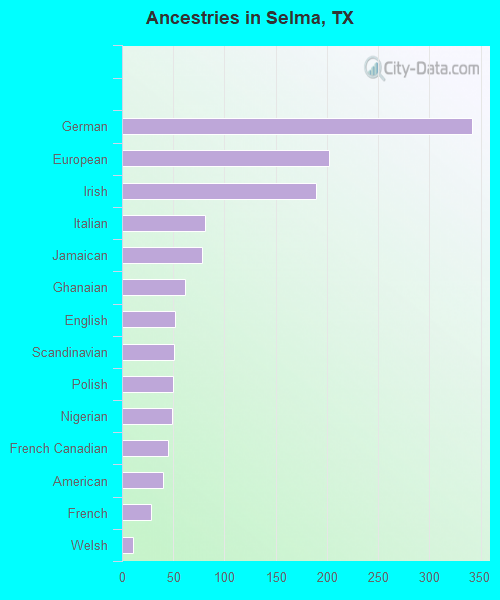
Ancestries in Selma
341 5.4% German202 3.2% European189 3.0% Irish81 1.3% Italian78 1.2% Jamaican61 1.0% Ghanaian52 0.8% English51 0.8% Scandinavian50 0.8% Polish49 0.8% Nigerian45 0.7% French Canadian40 0.6% American28 0.4% French11 0.2% Welsh
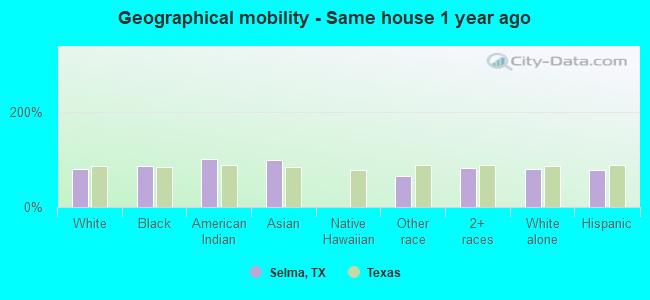
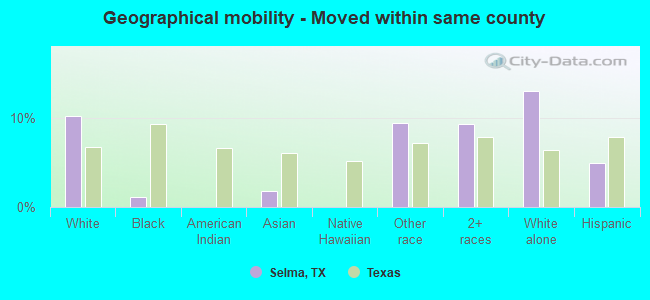
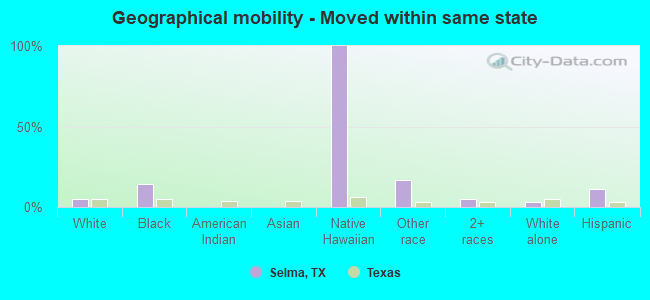
Geographical mobility in Selma Same house 1 year ago 2,806 79.5% White (Caucasian)2,407 84.7% Black or African American159 100.0% American Indian / Alaska Native643 98.4% Asian401 66.1% Other race2,645 81.0% Two or more races2,749 79.5% White alone, not Hispanic / Latino2,475 78.2% Hispanic or LatinoMoved within same county 358 10.1% White / Caucasian31 1.1% Black or African American12 1.8% Asian57 9.4% Other race304 9.3% Two or more races449 13.0% White alone, not Hispanic / Latino155 4.9% Hispanic or LatinoMoved within same state 169 4.8% White / Caucasian390 13.7% Black or African American42 100.0% Native Hawaiian / Pacific Islander101 16.7% Other race163 5.0% Two or more races107 3.1% White alone, not Hispanic / Latino336 10.6% Hispanic or LatinoMoved from different state 219 6.2% White / Caucasian8 1.2% Asian60 1.9% Two or more races132 3.8% White alone, not Hispanic / Latino172 5.4% Hispanic or LatinoMoved from abroad 21 0.6% White3 0.6% Other race36 1.1% Two or more races19 0.5% White alone, not Hispanic / Latino6 0.2% Hispanic or Latino
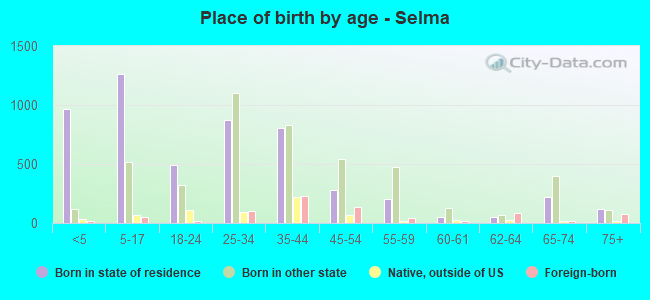
Children Nativity (place of birth) in Selma
Children under 6 years - Living with two parents Both parents native 869 100.0% NativeOne native, one foreign-born parent 94 100.0% NativeChildren under 6 years - Living with one parent Native parent 294 100.0% NativeForeign-born parent 38 100.0% NativeChildren 6 to 17 years - Living with two parents Both parents native 872 100.0% NativeBoth parents foreign-born 116 71.3% Native47 28.7% Foreign-bornOne native, one foreign-born parent 71 100.0% NativeChildren 6 to 17 years - Living with one parent Native parent 409 100.0% NativeForeign-born parent 128 49.9% Native128 50.1% Foreign-born
Grandparents responsible for own grandchildren in Selma
Grandparents (30 to 59 years) Other race 20 100.0% Not responsible for grandchildrenHispanic or Latino 16 100.0% Not responsible for grandchildren
Grandparents (60 years and over) Hispanic or Latino 23 100.0% Not responsible for grandchildren