Races in Saugus, Massachusetts (MA) Detailed Stats
Data:
Races - White alone (%)
Races - White alone (% change since 2000)
Races - Black alone (%)
Races - Black alone (% change since 2000)
Races - American Indian alone (%)
Races - American Indian alone (% change since 2000)
Races - Asian alone (%)
Races - Asian alone (% change since 2000)
Races - Hispanic (%)
Races - Hispanic (% change since 2000)
Races - Native Hawaiian and Other Pacific Islander alone (%)
Races - Native Hawaiian and Other Pacific Islander alone (% change since 2000)
Races - Two or more races(%)
Races - Two or more races(% change since 2000)
Races - Other race alone (%)
Races - Other race alone (% change since 2000)
Racial diversity
Place of birth - Born in state of residence (%)
Place of birth - Born in state of residence (%) - White
Place of birth - Born in state of residence (%) - Black or African American
Place of birth - Born in state of residence (%) - Asian
Place of birth - Born in state of residence (%) - Hispanic or Latino
Place of birth - Born in state of residence (%) - American Indian and Alaska Native
Place of birth - Born in state of residence (%) - Multirace
Place of birth - Born in state of residence (%) - Other Race
Place of birth - Born in other state (%)
Place of birth - Born in other state (%) - White
Place of birth - Born in other state (%) - Black or African American
Place of birth - Born in other state (%) - Asian
Place of birth - Born in other state (%) - Hispanic or Latino
Place of birth - Born in other state (%) - American Indian and Alaska Native
Place of birth - Born in other state (%) - Multirace
Place of birth - Born in other state (%) - Other Race
Place of birth - Native, outside of US (%)
Place of birth - Native, outside of US (%) - White
Place of birth - Native, outside of US (%) - Black or African American
Place of birth - Native, outside of US (%) - Asian
Place of birth - Native, outside of US (%) - Hispanic or Latino
Place of birth - Native, outside of US (%) - American Indian and Alaska Native
Place of birth - Native, outside of US (%) - Multirace
Place of birth - Native, outside of US (%) - Other Race
Place of birth - Foreign born (%)
Place of birth - Foreign born (%) - White
Place of birth - Foreign born (%) - Black or African American
Place of birth - Foreign born (%) - Asian
Place of birth - Foreign born (%) - Hispanic or Latino
Place of birth - Foreign born (%) - American Indian and Alaska Native
Place of birth - Foreign born (%) - Multirace
Place of birth - Foreign born (%) - Other Race
Residents speaking English at home (%)
Residents speaking English at home - Born in the United States (%)
Residents speaking English at home - Native, born elsewhere (%)
Residents speaking English at home - Foreign born (%)
Residents speaking Spanish at home (%)
Residents speaking Spanish at home - Born in the United States (%)
Residents speaking Spanish at home - Native, born elsewhere (%)
Residents speaking Spanish at home - Foreign born (%)
Residents speaking other language at home (%)
Residents speaking other language at home - Born in the United States (%)
Residents speaking other language at home - Native, born elsewhere (%)
Residents speaking other language at home - Foreign born (%)
Marital status - Never married (%)
Marital status - Now married (%)
Marital status - Separated (%)
Marital status - Widowed (%)
Marital status - Divorced (%)
Ancestries Reported - Arab (%)
Ancestries Reported - Czech (%)
Ancestries Reported - Danish (%)
Ancestries Reported - Dutch (%)
Ancestries Reported - English (%)
Ancestries Reported - French (%)
Ancestries Reported - French Canadian (%)
Ancestries Reported - German (%)
Ancestries Reported - Greek (%)
Ancestries Reported - Hungarian (%)
Ancestries Reported - Irish (%)
Ancestries Reported - Italian (%)
Ancestries Reported - Lithuanian (%)
Ancestries Reported - Norwegian (%)
Ancestries Reported - Polish (%)
Ancestries Reported - Portuguese (%)
Ancestries Reported - Russian (%)
Ancestries Reported - Scotch-Irish (%)
Ancestries Reported - Scottish (%)
Ancestries Reported - Slovak (%)
Ancestries Reported - Subsaharan African (%)
Ancestries Reported - Swedish (%)
Ancestries Reported - Swiss (%)
Ancestries Reported - Ukrainian (%)
Ancestries Reported - United States (%)
Ancestries Reported - Welsh (%)
Ancestries Reported - West Indian (%)
Ancestries Reported - Other (%)
Geographical mobility - Same house 1 year ago (%)
Geographical mobility - Same house 1 year ago (%) - White
Geographical mobility - Same house 1 year ago (%) - Black or African American
Geographical mobility - Same house 1 year ago (%) - Asian
Geographical mobility - Same house 1 year ago (%) - Hispanic or Latino
Geographical mobility - Same house 1 year ago (%) - American Indian and Alaska Native
Geographical mobility - Same house 1 year ago (%) - Multirace
Geographical mobility - Same house 1 year ago (%) - Other Race
Geographical mobility - Moved within same county (%)
Geographical mobility - Moved within same county (%) - White
Geographical mobility - Moved within same county (%) - Black or African American
Geographical mobility - Moved within same county (%) - Asian
Geographical mobility - Moved within same county (%) - Hispanic or Latino
Geographical mobility - Moved within same county (%) - American Indian and Alaska Native
Geographical mobility - Moved within same county (%) - Multirace
Geographical mobility - Moved within same county (%) - Other Race
Geographical mobility - Moved from different county within same state (%)
Geographical mobility - Moved from different county within same state (%) - White
Geographical mobility - Moved from different county within same state (%) - Black or African American
Geographical mobility - Moved from different county within same state (%) - Asian
Geographical mobility - Moved from different county within same state (%) - Hispanic or Latino
Geographical mobility - Moved from different county within same state (%) - American Indian and Alaska Native
Geographical mobility - Moved from different county within same state (%) - Multirace
Geographical mobility - Moved from different county within same state (%) - Other Race
Geographical mobility - Moved from different state (%)
Geographical mobility - Moved from different state (%) - White
Geographical mobility - Moved from different state (%) - Black or African American
Geographical mobility - Moved from different state (%) - Asian
Geographical mobility - Moved from different state (%) - Hispanic or Latino
Geographical mobility - Moved from different state (%) - American Indian and Alaska Native
Geographical mobility - Moved from different state (%) - Multirace
Geographical mobility - Moved from different state (%) - Other Race
Geographical mobility - Moved from abroad (%)
Geographical mobility - Moved from abroad (%) - White
Geographical mobility - Moved from abroad (%) - Black or African American
Geographical mobility - Moved from abroad (%) - Asian
Geographical mobility - Moved from abroad (%) - Hispanic or Latino
Geographical mobility - Moved from abroad (%) - American Indian and Alaska Native
Geographical mobility - Moved from abroad (%) - Multirace
Geographical mobility - Moved from abroad (%) - Other Race
Place of birth for the foreign-born population - Ireland (%)
Place of birth for the foreign-born population - Denmark (%)
Place of birth for the foreign-born population - Norway (%)
Place of birth for the foreign-born population - Sweden (%)
Place of birth for the foreign-born population - United Kingdom (%)
Place of birth for the foreign-born population - England (%)
Place of birth for the foreign-born population - Scotland (%)
Place of birth for the foreign-born population - Other Northern Europe (%)
Place of birth for the foreign-born population - Austria (%)
Place of birth for the foreign-born population - Belgium (%)
Place of birth for the foreign-born population - France (%)
Place of birth for the foreign-born population - Germany (%)
Place of birth for the foreign-born population - Netherlands (%)
Place of birth for the foreign-born population - Switzerland (%)
Place of birth for the foreign-born population - Other Western Europe (%)
Place of birth for the foreign-born population - Greece (%)
Place of birth for the foreign-born population - Italy (%)
Place of birth for the foreign-born population - Portugal (%)
Place of birth for the foreign-born population - Spain (%)
Place of birth for the foreign-born population - Other Southern Europe (%)
Place of birth for the foreign-born population - Albania (%)
Place of birth for the foreign-born population - Belarus (%)
Place of birth for the foreign-born population - Bosnia and Herzegovina (%)
Place of birth for the foreign-born population - Bulgaria (%)
Place of birth for the foreign-born population - Croatia (%)
Place of birth for the foreign-born population - Czechoslovakia (%)
Place of birth for the foreign-born population - Hungary (%)
Place of birth for the foreign-born population - Latvia (%)
Place of birth for the foreign-born population - Lithuania (%)
Place of birth for the foreign-born population - North Macedonia (Macedonia) (%)
Place of birth for the foreign-born population - Moldova (%)
Place of birth for the foreign-born population - Poland (%)
Place of birth for the foreign-born population - Romania (%)
Place of birth for the foreign-born population - Russia (%)
Place of birth for the foreign-born population - Serbia (%)
Place of birth for the foreign-born population - Ukraine (%)
Place of birth for the foreign-born population - Other Eastern Europe (%)
Place of birth for the foreign-born population - China (%)
Place of birth for the foreign-born population - Hong Kong (%)
Place of birth for the foreign-born population - Taiwan (%)
Place of birth for the foreign-born population - Japan (%)
Place of birth for the foreign-born population - Korea (%)
Place of birth for the foreign-born population - Other Eastern Asia (%)
Place of birth for the foreign-born population - Afghanistan (%)
Place of birth for the foreign-born population - Bangladesh (%)
Place of birth for the foreign-born population - India (%)
Place of birth for the foreign-born population - Iran (%)
Place of birth for the foreign-born population - Kazakhstan (%)
Place of birth for the foreign-born population - Nepal (%)
Place of birth for the foreign-born population - Pakistan (%)
Place of birth for the foreign-born population - Sri Lanka (%)
Place of birth for the foreign-born population - Uzbekistan (%)
Place of birth for the foreign-born population - Other South Central Asia (%)
Place of birth for the foreign-born population - Burma (%)
Place of birth for the foreign-born population - Cambodia (%)
Place of birth for the foreign-born population - Indonesia (%)
Place of birth for the foreign-born population - Laos (%)
Place of birth for the foreign-born population - Malaysia (%)
Place of birth for the foreign-born population - Philippines (%)
Place of birth for the foreign-born population - Singapore (%)
Place of birth for the foreign-born population - Thailand (%)
Place of birth for the foreign-born population - Vietnam (%)
Place of birth for the foreign-born population - Other South Eastern Asia (%)
Place of birth for the foreign-born population - Armenia (%)
Place of birth for the foreign-born population - Iraq (%)
Place of birth for the foreign-born population - Israel (%)
Place of birth for the foreign-born population - Jordan (%)
Place of birth for the foreign-born population - Kuwait (%)
Place of birth for the foreign-born population - Lebanon (%)
Place of birth for the foreign-born population - Saudi Arabia (%)
Place of birth for the foreign-born population - Syria (%)
Place of birth for the foreign-born population - Turkey (%)
Place of birth for the foreign-born population - Yemen (%)
Place of birth for the foreign-born population - Other Western Asia (%)
Place of birth for the foreign-born population - Eritrea (%)
Place of birth for the foreign-born population - Ethiopia (%)
Place of birth for the foreign-born population - Kenya (%)
Place of birth for the foreign-born population - Somalia (%)
Place of birth for the foreign-born population - Uganda (%)
Place of birth for the foreign-born population - Zimbabwe (%)
Place of birth for the foreign-born population - Other Eastern Africa (%)
Place of birth for the foreign-born population - Cameroon (%)
Place of birth for the foreign-born population - Congo (%)
Place of birth for the foreign-born population - Democratic Republic of Congo (Zaire) (%)
Place of birth for the foreign-born population - Other Middle Africa (%)
Place of birth for the foreign-born population - Egypt (%)
Place of birth for the foreign-born population - Morocco (%)
Place of birth for the foreign-born population - Sudan (%)
Place of birth for the foreign-born population - Other Northern Africa (%)
Place of birth for the foreign-born population - South Africa (%)
Place of birth for the foreign-born population - Other Southern Africa (%)
Place of birth for the foreign-born population - Cabo Verde (%)
Place of birth for the foreign-born population - Ghana (%)
Place of birth for the foreign-born population - Liberia (%)
Place of birth for the foreign-born population - Nigeria (%)
Place of birth for the foreign-born population - Senegal (%)
Place of birth for the foreign-born population - Sierra Leone (%)
Place of birth for the foreign-born population - Other Western Africa (%)
Place of birth for the foreign-born population - Australia (%)
Place of birth for the foreign-born population - New Zealand (%)
Place of birth for the foreign-born population - Fiji (%)
Place of birth for the foreign-born population - Micronesia (%)
Place of birth for the foreign-born population - Bahamas (%)
Place of birth for the foreign-born population - Barbados (%)
Place of birth for the foreign-born population - Cuba (%)
Place of birth for the foreign-born population - Dominica (%)
Place of birth for the foreign-born population - Dominican Republic (%)
Place of birth for the foreign-born population - Grenada (%)
Place of birth for the foreign-born population - Haiti (%)
Place of birth for the foreign-born population - Jamaica (%)
Place of birth for the foreign-born population - St. Vincent and the Grenadines (%)
Place of birth for the foreign-born population - Trinidad and Tobago (%)
Place of birth for the foreign-born population - West Indies (%)
Place of birth for the foreign-born population - Other Caribbean (%)
Place of birth for the foreign-born population - Belize (%)
Place of birth for the foreign-born population - Costa Rica (%)
Place of birth for the foreign-born population - El Salvador (%)
Place of birth for the foreign-born population - Guatemala (%)
Place of birth for the foreign-born population - Honduras (%)
Place of birth for the foreign-born population - Mexico (%)
Place of birth for the foreign-born population - Nicaragua (%)
Place of birth for the foreign-born population - Panama (%)
Place of birth for the foreign-born population - Other Central America (%)
Place of birth for the foreign-born population - Argentina (%)
Place of birth for the foreign-born population - Bolivia (%)
Place of birth for the foreign-born population - Brazil (%)
Place of birth for the foreign-born population - Chile (%)
Place of birth for the foreign-born population - Colombia (%)
Place of birth for the foreign-born population - Ecuador (%)
Place of birth for the foreign-born population - Guyana (%)
Place of birth for the foreign-born population - Peru (%)
Place of birth for the foreign-born population - Uruguay (%)
Place of birth for the foreign-born population - Venezuela (%)
Place of birth for the foreign-born population - Other South America (%)
Place of birth for the foreign-born population - Canada (%)
Place of birth for the foreign-born population - Other Northern America (%)
Place of birth for the foreign-born population - Other (%)
Latest news about races in Saugus, MA collected exclusively by city-data.com from local newspapers, TV, and radio stations
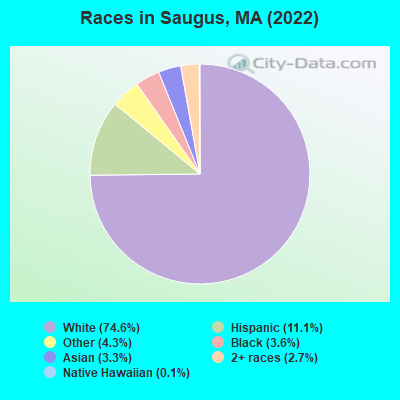
According to 2022 data, the most numerous races in Saugus, MA are White alone (21,314 residents), Hispanic (3,170 residents), and Asian alone (937 residents). 73.4% of Saugus residents speak English at home. 17.4% of Saugus, MA residents are foreign-born (8.7% born in Latin America, 3.3% born in Europe, 2.8% born in Asia), which is 3.6% less than the foreign-born rate of 18.0% across the entire state of Massachusetts.
Race distribution in Saugus
2000 2022
5,198,359 81.9% White alone 428,729 6.8% Hispanic 318,329 5.0% Black alone 236,786 3.7% Asian alone 110,338 1.7% Two or more races 43,586 0.7% Other race alone 11,264 0.2% American Indian alone 1,706 0.03% Native Hawaiian and Other
4,676,627 67.0% White alone 911,038 13.0% Hispanic 501,463 7.2% Asian alone 459,740 6.6% Black alone 341,889 4.9% Two or more races 84,403 1.2% Other race alone 5,838 0.08% American Indian alone 976 0.01% Native Hawaiian and Other
Income and house value in Saugus Median household income in 2022 $91,920 White non-Hispanic householders$107,935 Black householders$107,138 Asian householders$79,895 Some other race householders$138,757 Two or more races householders$123,856 Hispanic or Latino race householdersMedian 2022 house value $598,566 White Non-Hispanic householders$549,614 Black or African American householders$806,101 American Indian or Alaska Native householders $602,084 Asian householders$278,471 Some other race householders$773,564 Two or more races householders$461,383 Hispanic or Latino householders
Median age by race in Saugus
50.5 Median age for White residents47.7 52.6 33.8 Median age for Black or African American residents40.4 33.8 -713,541,666.0 Median age for American Indian / Alaska Native residents-679,156,908.0 -364,551,862.7 35.1 Median age for Asian residents41.6 34.2 -514,227,641.8 Median age for Native Hawaiian / Pacific Islander residents-666,666,666.0 -508,717,948.2 40.5 Median age for Other race residents41.6 29.9 29.2 Median age for Two or more races residents28.7 34.2 50.2 Median age for White alone residents47.1 53.7 32.8 Median age for Hispanic or Latino residents28.9 33.1
Owner/renter occupied households by race in Saugus
House owners and renters - White residents 7,073 80.7% Owner occupied1,694 19.3% Renter occupiedHouse owners and renters - Black or African American residents 128 34.6% Owner occupied242 65.4% Renter occupiedHouse owners and renters - Asian residents 273 87.7% Owner occupied38 12.3% Renter occupiedHouse owners and renters - Other race residents 317 50.9% Owner occupied306 49.1% Renter occupiedHouse owners and renters - Two or more races residents 288 42.1% Owner occupied396 57.9% Renter occupiedHouse owners and renters - White alone residents 6,786 79.6% Owner occupied1,743 20.4% Renter occupiedHouse owners and renters - Hispanic or Latino residents 525 62.1% Owner occupied321 37.9% Renter occupied
Language usage in Saugus
English speakers - Total 73.4% of residents of Saugus speak English at home.
8.3% of residents speak Spanish at home 1,438 62.5% Speak English very well861 37.5% Speak English less than very well18.0% of residents speak other language at home 3,266 65.8% Speak English very well1,694 34.2% Speak English less than very well
English speakers - Born in the United States 83.5% of residents of Saugus speak English at home.
6.7% of residents speak Spanish at home 146 100.0% Speak English very well10.0% of residents speak other language at home 158 72.8% Speak English very well59 27.2% Speak English less than very well
English speakers - Native, born elsewhere 61.2% of residents of Saugus speak English at home.
32.1% of residents speak Spanish at home 106 89.1% Speak English very well13 10.9% Speak English less than very well13.2% of residents speak other language at home 49 100.0% Speak English very well
English speakers - Foreign-born 12.1% of residents of Saugus speak English at home.
23.4% of residents speak Spanish at home 374 31.0% Speak English very well831 69.0% Speak English less than very well63.1% of residents speak other language at home 1,744 53.7% Speak English very well1,504 46.3% Speak English less than very well
White (Caucasian) - Speak only English Native:
93.9% (17,987)Foreign-born:
22.1% (379)
White (Caucasian) - Speak another language Native:
5.9% (1,128)Foreign-born:
77.4% (1,326)
Black or African American - Speak only English Native:
85.1% (437)Foreign-born:
17.4% (65)
Black or African American - Speak another language Native:
16.0% (82)Foreign-born:
79.7% (297)
Asian - Speak only English Native:
29.8% (95)Foreign-born:
7.8% (47)
Asian - Speak another language Native:
64.5% (206)Foreign-born:
93.4% (571)
Other race - Speak another language Native:
57.5% (522)Foreign-born:
99.8% (971)
Two or more races - Speak only English Native:
49.3% (516)Foreign-born:
3.8% (38)
Two or more races - Speak another language Native:
52.1% (545)Foreign-born:
94.5% (938)
White alone - Speak only English Native:
94.5% (17,889)Foreign-born:
17.2% (299)
White alone - Speak another language Native:
5.7% (1,070)Foreign-born:
83.4% (1,448)
Hispanic or Latino - Speak only English Native:
31.2% (451)Foreign-born:
11.6% (173)
Hispanic or Latino - Speak another language Native:
68.9% (998)Foreign-born:
88.9% (1,331)
Foreign-born residents in Saugus 4,967 residents are foreign born (8.7% Latin America , 3.3% Europe , 2.8% Asia ).
This city:
17.4%Massachusetts:
17.6%
Marital status for residents in Saugus Marital status - White (Caucasian) population 15 years and over
Males 30.9% Never married52.7% Now married1.7% Separated3.0% Widowed11.7% DivorcedFemales 27.1% Never married50.2% Now married0.6% Separated9.9% Widowed12.1% DivorcedWomen who gave birth in the past 12 months Now married:
69.6% (119)Unmarried:
30.4% (52)
Women who did not give birth in the past 12 months Now married:
43.0% (1,773)Unmarried:
57.0% (2,348)
Marital status - Black or African American population 15 years and over
Males 53.1% Never married42.6% Now married0.0% Separated0.0% Widowed4.3% DivorcedFemales 45.1% Never married40.7% Now married0.0% Separated13.6% Widowed0.6% DivorcedWomen who did not give birth in the past 12 months Now married:
39.4% (131)Unmarried:
60.6% (201)
Marital status - Asian population 15 years and over
Males 4.7% Never married89.6% Now married0.0% Separated5.7% Widowed0.0% DivorcedFemales 10.7% Never married77.9% Now married0.0% Separated5.3% Widowed6.1% DivorcedWomen who gave birth in the past 12 months Now married:
0.0% (0)Unmarried:
100.0% (21)
Women who did not give birth in the past 12 months Now married:
86.0% (285)Unmarried:
14.0% (46)
Marital status - Other race population 15 years and over
Males 19.2% Never married56.7% Now married8.7% Separated0.0% Widowed15.4% DivorcedFemales 44.9% Never married43.3% Now married0.0% Separated1.2% Widowed10.6% DivorcedWomen who did not give birth in the past 12 months Now married:
30.5% (172)Unmarried:
69.5% (392)
Marital status - Two or more races population 15 years and over
Males 38.5% Never married61.5% Now married0.0% Separated0.0% Widowed0.0% DivorcedFemales 27.3% Never married45.0% Now married0.0% Separated4.1% Widowed23.6% DivorcedWomen who did not give birth in the past 12 months Now married:
44.4% (257)Unmarried:
55.6% (323)
Marital status - White alone, not Hispanic / Latino population 15 years and over
Males 31.1% Never married52.2% Now married1.8% Separated3.1% Widowed11.8% DivorcedFemales 26.5% Never married50.0% Now married0.5% Separated10.7% Widowed12.4% DivorcedWomen who gave birth in the past 12 months Now married:
69.6% (125)Unmarried:
30.4% (55)
Women who did not give birth in the past 12 months Now married:
41.3% (1,563)Unmarried:
58.7% (2,223)
Marital status - Hispanic or Latino population 15 years and over
Males 36.0% Never married58.9% Now married0.0% Separated0.0% Widowed5.1% DivorcedFemales 34.6% Never married48.4% Now married1.2% Separated2.2% Widowed13.6% DivorcedWomen who did not give birth in the past 12 months Now married:
49.5% (571)Unmarried:
50.5% (583)
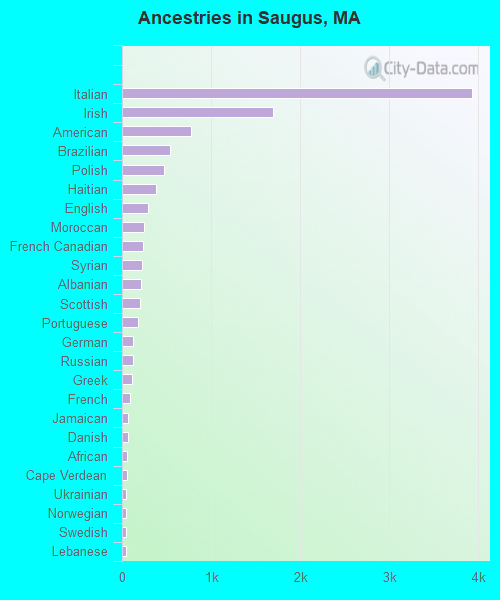
Ancestries in Saugus
3,926 29.4% Italian1,698 12.7% Irish779 5.8% American535 4.0% Brazilian469 3.5% Polish383 2.9% Haitian289 2.2% English248 1.9% Moroccan231 1.7% French Canadian228 1.7% Syrian208 1.6% Albanian202 1.5% Scottish178 1.3% Portuguese129 1.0% German119 0.9% Russian108 0.8% Greek94 0.7% French73 0.5% Jamaican69 0.5% Danish56 0.4% African55 0.4% Cape Verdean47 0.4% Ukrainian46 0.3% Norwegian43 0.3% Swedish42 0.3% Lebanese41 0.3% Armenian19 0.1% Finnish17 0.1% Jordanian15 0.1% Scotch-Irish13 0.10% European12 0.09% Dutch7 0.05% Canadian6 0.05% Celtic6 0.05% Welsh3 0.02% Eastern European2 0.02% Northern European
Geographical mobility in Saugus Same house 1 year ago 19,920 92.6% White (Caucasian)913 99.9% Black or African American19 100.0% American Indian / Alaska Native791 83.6% Asian27 100.0% Native Hawaiian / Pacific Islander2,074 100.0% Other race1,899 87.4% Two or more races19,797 93.5% White alone, not Hispanic / Latino2,828 88.8% Hispanic or LatinoMoved within same county 326 1.5% White / Caucasian4 0.2% Other race94 4.3% Two or more races354 1.7% White alone, not Hispanic / Latino19 0.6% Hispanic or LatinoMoved within same state 843 3.9% White / Caucasian12 1.4% Black or African American227 24.0% Asian169 7.8% Two or more races725 3.4% White alone, not Hispanic / Latino140 4.4% Hispanic or LatinoMoved from different state 220 1.0% White / Caucasian5 0.6% Asian224 1.1% White alone, not Hispanic / LatinoMoved from abroad 424 2.0% White212 1.0% White alone, not Hispanic / Latino310 9.7% Hispanic or Latino
Children Nativity (place of birth) in Saugus
Children under 6 years - Living with two parents Both parents native 617 100.0% NativeBoth parents foreign-born 47 100.0% NativeOne native, one foreign-born parent 408 100.0% NativeChildren under 6 years - Living with one parent Native parent 125 100.0% NativeForeign-born parent 46 100.0% NativeChildren 6 to 17 years - Living with two parents Both parents native 866 99.7% Native3 0.3% Foreign-bornBoth parents foreign-born 969 95.9% Native42 4.1% Foreign-bornOne native, one foreign-born parent 201 100.0% NativeChildren 6 to 17 years - Living with one parent Native parent 730 100.0% NativeForeign-born parent 245 50.4% Native241 49.6% Foreign-born
Grandparents responsible for own grandchildren in Saugus
Grandparents (30 to 59 years) White / Caucasian 108 55.2% Responsible for grandchildren88 44.8% Not responsible for grandchildrenAsian 5 100.0% Responsible for grandchildrenWhite alone, not Hispanic / Latino 75 46.7% Responsible for grandchildren86 53.3% Not responsible for grandchildrenHispanic or Latino 18 100.0% Not responsible for grandchildrenGrandparents (60 years and over) White / Caucasian 119 26.9% Responsible for grandchildren323 73.1% Not responsible for grandchildrenAsian 4 9.2% Responsible for grandchildren36 90.8% Not responsible for grandchildrenWhite alone, not Hispanic / Latino 136 28.7% Responsible for grandchildren336 71.3% Not responsible for grandchildren