Races in Richardson, Texas (TX) Detailed Stats
Data:
Races - White alone (%)
Races - White alone (% change since 2000)
Races - Black alone (%)
Races - Black alone (% change since 2000)
Races - American Indian alone (%)
Races - American Indian alone (% change since 2000)
Races - Asian alone (%)
Races - Asian alone (% change since 2000)
Races - Hispanic (%)
Races - Hispanic (% change since 2000)
Races - Native Hawaiian and Other Pacific Islander alone (%)
Races - Native Hawaiian and Other Pacific Islander alone (% change since 2000)
Races - Two or more races(%)
Races - Two or more races(% change since 2000)
Races - Other race alone (%)
Races - Other race alone (% change since 2000)
Racial diversity
Place of birth - Born in state of residence (%)
Place of birth - Born in state of residence (%) - White
Place of birth - Born in state of residence (%) - Black or African American
Place of birth - Born in state of residence (%) - Asian
Place of birth - Born in state of residence (%) - Hispanic or Latino
Place of birth - Born in state of residence (%) - American Indian and Alaska Native
Place of birth - Born in state of residence (%) - Multirace
Place of birth - Born in state of residence (%) - Other Race
Place of birth - Born in other state (%)
Place of birth - Born in other state (%) - White
Place of birth - Born in other state (%) - Black or African American
Place of birth - Born in other state (%) - Asian
Place of birth - Born in other state (%) - Hispanic or Latino
Place of birth - Born in other state (%) - American Indian and Alaska Native
Place of birth - Born in other state (%) - Multirace
Place of birth - Born in other state (%) - Other Race
Place of birth - Native, outside of US (%)
Place of birth - Native, outside of US (%) - White
Place of birth - Native, outside of US (%) - Black or African American
Place of birth - Native, outside of US (%) - Asian
Place of birth - Native, outside of US (%) - Hispanic or Latino
Place of birth - Native, outside of US (%) - American Indian and Alaska Native
Place of birth - Native, outside of US (%) - Multirace
Place of birth - Native, outside of US (%) - Other Race
Place of birth - Foreign born (%)
Place of birth - Foreign born (%) - White
Place of birth - Foreign born (%) - Black or African American
Place of birth - Foreign born (%) - Asian
Place of birth - Foreign born (%) - Hispanic or Latino
Place of birth - Foreign born (%) - American Indian and Alaska Native
Place of birth - Foreign born (%) - Multirace
Place of birth - Foreign born (%) - Other Race
Residents speaking English at home (%)
Residents speaking English at home - Born in the United States (%)
Residents speaking English at home - Native, born elsewhere (%)
Residents speaking English at home - Foreign born (%)
Residents speaking Spanish at home (%)
Residents speaking Spanish at home - Born in the United States (%)
Residents speaking Spanish at home - Native, born elsewhere (%)
Residents speaking Spanish at home - Foreign born (%)
Residents speaking other language at home (%)
Residents speaking other language at home - Born in the United States (%)
Residents speaking other language at home - Native, born elsewhere (%)
Residents speaking other language at home - Foreign born (%)
Marital status - Never married (%)
Marital status - Now married (%)
Marital status - Separated (%)
Marital status - Widowed (%)
Marital status - Divorced (%)
Ancestries Reported - Arab (%)
Ancestries Reported - Czech (%)
Ancestries Reported - Danish (%)
Ancestries Reported - Dutch (%)
Ancestries Reported - English (%)
Ancestries Reported - French (%)
Ancestries Reported - French Canadian (%)
Ancestries Reported - German (%)
Ancestries Reported - Greek (%)
Ancestries Reported - Hungarian (%)
Ancestries Reported - Irish (%)
Ancestries Reported - Italian (%)
Ancestries Reported - Lithuanian (%)
Ancestries Reported - Norwegian (%)
Ancestries Reported - Polish (%)
Ancestries Reported - Portuguese (%)
Ancestries Reported - Russian (%)
Ancestries Reported - Scotch-Irish (%)
Ancestries Reported - Scottish (%)
Ancestries Reported - Slovak (%)
Ancestries Reported - Subsaharan African (%)
Ancestries Reported - Swedish (%)
Ancestries Reported - Swiss (%)
Ancestries Reported - Ukrainian (%)
Ancestries Reported - United States (%)
Ancestries Reported - Welsh (%)
Ancestries Reported - West Indian (%)
Ancestries Reported - Other (%)
Geographical mobility - Same house 1 year ago (%)
Geographical mobility - Same house 1 year ago (%) - White
Geographical mobility - Same house 1 year ago (%) - Black or African American
Geographical mobility - Same house 1 year ago (%) - Asian
Geographical mobility - Same house 1 year ago (%) - Hispanic or Latino
Geographical mobility - Same house 1 year ago (%) - American Indian and Alaska Native
Geographical mobility - Same house 1 year ago (%) - Multirace
Geographical mobility - Same house 1 year ago (%) - Other Race
Geographical mobility - Moved within same county (%)
Geographical mobility - Moved within same county (%) - White
Geographical mobility - Moved within same county (%) - Black or African American
Geographical mobility - Moved within same county (%) - Asian
Geographical mobility - Moved within same county (%) - Hispanic or Latino
Geographical mobility - Moved within same county (%) - American Indian and Alaska Native
Geographical mobility - Moved within same county (%) - Multirace
Geographical mobility - Moved within same county (%) - Other Race
Geographical mobility - Moved from different county within same state (%)
Geographical mobility - Moved from different county within same state (%) - White
Geographical mobility - Moved from different county within same state (%) - Black or African American
Geographical mobility - Moved from different county within same state (%) - Asian
Geographical mobility - Moved from different county within same state (%) - Hispanic or Latino
Geographical mobility - Moved from different county within same state (%) - American Indian and Alaska Native
Geographical mobility - Moved from different county within same state (%) - Multirace
Geographical mobility - Moved from different county within same state (%) - Other Race
Geographical mobility - Moved from different state (%)
Geographical mobility - Moved from different state (%) - White
Geographical mobility - Moved from different state (%) - Black or African American
Geographical mobility - Moved from different state (%) - Asian
Geographical mobility - Moved from different state (%) - Hispanic or Latino
Geographical mobility - Moved from different state (%) - American Indian and Alaska Native
Geographical mobility - Moved from different state (%) - Multirace
Geographical mobility - Moved from different state (%) - Other Race
Geographical mobility - Moved from abroad (%)
Geographical mobility - Moved from abroad (%) - White
Geographical mobility - Moved from abroad (%) - Black or African American
Geographical mobility - Moved from abroad (%) - Asian
Geographical mobility - Moved from abroad (%) - Hispanic or Latino
Geographical mobility - Moved from abroad (%) - American Indian and Alaska Native
Geographical mobility - Moved from abroad (%) - Multirace
Geographical mobility - Moved from abroad (%) - Other Race
Place of birth for the foreign-born population - Ireland (%)
Place of birth for the foreign-born population - Denmark (%)
Place of birth for the foreign-born population - Norway (%)
Place of birth for the foreign-born population - Sweden (%)
Place of birth for the foreign-born population - United Kingdom (%)
Place of birth for the foreign-born population - England (%)
Place of birth for the foreign-born population - Scotland (%)
Place of birth for the foreign-born population - Other Northern Europe (%)
Place of birth for the foreign-born population - Austria (%)
Place of birth for the foreign-born population - Belgium (%)
Place of birth for the foreign-born population - France (%)
Place of birth for the foreign-born population - Germany (%)
Place of birth for the foreign-born population - Netherlands (%)
Place of birth for the foreign-born population - Switzerland (%)
Place of birth for the foreign-born population - Other Western Europe (%)
Place of birth for the foreign-born population - Greece (%)
Place of birth for the foreign-born population - Italy (%)
Place of birth for the foreign-born population - Portugal (%)
Place of birth for the foreign-born population - Spain (%)
Place of birth for the foreign-born population - Other Southern Europe (%)
Place of birth for the foreign-born population - Albania (%)
Place of birth for the foreign-born population - Belarus (%)
Place of birth for the foreign-born population - Bosnia and Herzegovina (%)
Place of birth for the foreign-born population - Bulgaria (%)
Place of birth for the foreign-born population - Croatia (%)
Place of birth for the foreign-born population - Czechoslovakia (%)
Place of birth for the foreign-born population - Hungary (%)
Place of birth for the foreign-born population - Latvia (%)
Place of birth for the foreign-born population - Lithuania (%)
Place of birth for the foreign-born population - North Macedonia (Macedonia) (%)
Place of birth for the foreign-born population - Moldova (%)
Place of birth for the foreign-born population - Poland (%)
Place of birth for the foreign-born population - Romania (%)
Place of birth for the foreign-born population - Russia (%)
Place of birth for the foreign-born population - Serbia (%)
Place of birth for the foreign-born population - Ukraine (%)
Place of birth for the foreign-born population - Other Eastern Europe (%)
Place of birth for the foreign-born population - China (%)
Place of birth for the foreign-born population - Hong Kong (%)
Place of birth for the foreign-born population - Taiwan (%)
Place of birth for the foreign-born population - Japan (%)
Place of birth for the foreign-born population - Korea (%)
Place of birth for the foreign-born population - Other Eastern Asia (%)
Place of birth for the foreign-born population - Afghanistan (%)
Place of birth for the foreign-born population - Bangladesh (%)
Place of birth for the foreign-born population - India (%)
Place of birth for the foreign-born population - Iran (%)
Place of birth for the foreign-born population - Kazakhstan (%)
Place of birth for the foreign-born population - Nepal (%)
Place of birth for the foreign-born population - Pakistan (%)
Place of birth for the foreign-born population - Sri Lanka (%)
Place of birth for the foreign-born population - Uzbekistan (%)
Place of birth for the foreign-born population - Other South Central Asia (%)
Place of birth for the foreign-born population - Burma (%)
Place of birth for the foreign-born population - Cambodia (%)
Place of birth for the foreign-born population - Indonesia (%)
Place of birth for the foreign-born population - Laos (%)
Place of birth for the foreign-born population - Malaysia (%)
Place of birth for the foreign-born population - Philippines (%)
Place of birth for the foreign-born population - Singapore (%)
Place of birth for the foreign-born population - Thailand (%)
Place of birth for the foreign-born population - Vietnam (%)
Place of birth for the foreign-born population - Other South Eastern Asia (%)
Place of birth for the foreign-born population - Armenia (%)
Place of birth for the foreign-born population - Iraq (%)
Place of birth for the foreign-born population - Israel (%)
Place of birth for the foreign-born population - Jordan (%)
Place of birth for the foreign-born population - Kuwait (%)
Place of birth for the foreign-born population - Lebanon (%)
Place of birth for the foreign-born population - Saudi Arabia (%)
Place of birth for the foreign-born population - Syria (%)
Place of birth for the foreign-born population - Turkey (%)
Place of birth for the foreign-born population - Yemen (%)
Place of birth for the foreign-born population - Other Western Asia (%)
Place of birth for the foreign-born population - Eritrea (%)
Place of birth for the foreign-born population - Ethiopia (%)
Place of birth for the foreign-born population - Kenya (%)
Place of birth for the foreign-born population - Somalia (%)
Place of birth for the foreign-born population - Uganda (%)
Place of birth for the foreign-born population - Zimbabwe (%)
Place of birth for the foreign-born population - Other Eastern Africa (%)
Place of birth for the foreign-born population - Cameroon (%)
Place of birth for the foreign-born population - Congo (%)
Place of birth for the foreign-born population - Democratic Republic of Congo (Zaire) (%)
Place of birth for the foreign-born population - Other Middle Africa (%)
Place of birth for the foreign-born population - Egypt (%)
Place of birth for the foreign-born population - Morocco (%)
Place of birth for the foreign-born population - Sudan (%)
Place of birth for the foreign-born population - Other Northern Africa (%)
Place of birth for the foreign-born population - South Africa (%)
Place of birth for the foreign-born population - Other Southern Africa (%)
Place of birth for the foreign-born population - Cabo Verde (%)
Place of birth for the foreign-born population - Ghana (%)
Place of birth for the foreign-born population - Liberia (%)
Place of birth for the foreign-born population - Nigeria (%)
Place of birth for the foreign-born population - Senegal (%)
Place of birth for the foreign-born population - Sierra Leone (%)
Place of birth for the foreign-born population - Other Western Africa (%)
Place of birth for the foreign-born population - Australia (%)
Place of birth for the foreign-born population - New Zealand (%)
Place of birth for the foreign-born population - Fiji (%)
Place of birth for the foreign-born population - Micronesia (%)
Place of birth for the foreign-born population - Bahamas (%)
Place of birth for the foreign-born population - Barbados (%)
Place of birth for the foreign-born population - Cuba (%)
Place of birth for the foreign-born population - Dominica (%)
Place of birth for the foreign-born population - Dominican Republic (%)
Place of birth for the foreign-born population - Grenada (%)
Place of birth for the foreign-born population - Haiti (%)
Place of birth for the foreign-born population - Jamaica (%)
Place of birth for the foreign-born population - St. Vincent and the Grenadines (%)
Place of birth for the foreign-born population - Trinidad and Tobago (%)
Place of birth for the foreign-born population - West Indies (%)
Place of birth for the foreign-born population - Other Caribbean (%)
Place of birth for the foreign-born population - Belize (%)
Place of birth for the foreign-born population - Costa Rica (%)
Place of birth for the foreign-born population - El Salvador (%)
Place of birth for the foreign-born population - Guatemala (%)
Place of birth for the foreign-born population - Honduras (%)
Place of birth for the foreign-born population - Mexico (%)
Place of birth for the foreign-born population - Nicaragua (%)
Place of birth for the foreign-born population - Panama (%)
Place of birth for the foreign-born population - Other Central America (%)
Place of birth for the foreign-born population - Argentina (%)
Place of birth for the foreign-born population - Bolivia (%)
Place of birth for the foreign-born population - Brazil (%)
Place of birth for the foreign-born population - Chile (%)
Place of birth for the foreign-born population - Colombia (%)
Place of birth for the foreign-born population - Ecuador (%)
Place of birth for the foreign-born population - Guyana (%)
Place of birth for the foreign-born population - Peru (%)
Place of birth for the foreign-born population - Uruguay (%)
Place of birth for the foreign-born population - Venezuela (%)
Place of birth for the foreign-born population - Other South America (%)
Place of birth for the foreign-born population - Canada (%)
Place of birth for the foreign-born population - Other Northern America (%)
Place of birth for the foreign-born population - Other (%)
Latest news about races in Richardson, TX collected exclusively by city-data.com from local newspapers, TV, and radio stations
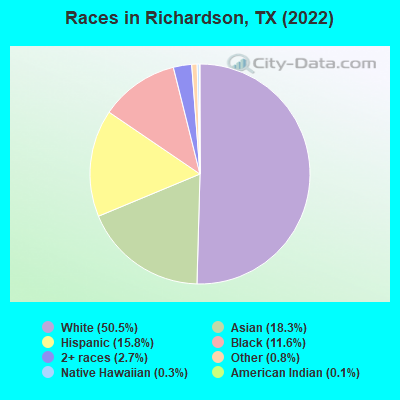
According to 2022 data, the most numerous races in Richardson, TX are Hispanic (18,726 residents), White alone (59,969 residents), and Black alone (13,746 residents). 67.6% of Richardson residents speak English at home. 23.9% of Richardson, TX residents are foreign-born (12.4% born in Asia, 5.9% born in Latin America, 3.0% born in Africa), which is 29.0% greater than the foreign-born rate of 17.0% across the entire state of Texas.
Race distribution in Richardson
2000 2022
63,850 69.6% White alone 10,666 11.6% Asian alone 9,420 10.3% Hispanic 5,586 6.1% Black alone 1,808 2.0% Two or more races 311 0.3% American Indian alone 120 0.1% Other race alone 41 0.04% Native Hawaiian and Other
59,969 50.5% White alone 21,750 18.3% Asian alone 18,726 15.8% Hispanic 13,746 11.6% Black alone 3,200 2.7% Two or more races 960 0.8% Other race alone 310 0.3% Native Hawaiian and Other 169 0.1% American Indian alone
2000 2022
10,933,313 52.4% White alone 6,669,666 32.0% Hispanic 2,364,255 11.3% Black alone 554,445 2.7% Asian alone 230,567 1.1% Two or more races 68,859 0.3% American Indian alone 19,958 0.10% Other race alone 10,757 0.05% Native Hawaiian and Other
12,070,642 40.2% Hispanic 11,683,430 38.9% White alone 3,508,706 11.7% Black alone 1,608,173 5.4% Asian alone 956,560 3.2% Two or more races 125,763 0.4% Other race alone 47,023 0.2% American Indian alone 29,275 0.10% Native Hawaiian and Other
Income and house value in Richardson Median household income in 2022 $92,161 White non-Hispanic householders$72,729 Black householders$102,181 Asian householders$102,519 Some other race householders$70,806 Two or more races householders$77,799 Hispanic or Latino race householdersMedian 2022 house value $417,603 White Non-Hispanic householders$392,389 Black or African American householders$304,771 American Indian or Alaska Native householders $438,720 Asian householders$512,155 Native Hawaiian and other Pacific Islander householders$285,861 Some other race householders$416,657 Two or more races householders$318,008 Hispanic or Latino householders
Median age by race in Richardson
40.0 Median age for White residents37.6 43.9 33.9 Median age for Black or African American residents27.9 35.7 54.3 Median age for American Indian / Alaska Native residents-666,666,666.0 54.3 30.1 Median age for Asian residents30.9 28.2 -666,666,666.0 Median age for Native Hawaiian / Pacific Islander residents-666,666,666.0 -666,666,666.0 31.2 Median age for Other race residents31.8 24.0 29.3 Median age for Two or more races residents30.9 26.9 41.7 Median age for White alone residents38.6 44.7 29.5 Median age for Hispanic or Latino residents30.6 27.8
Owner/renter occupied households by race in Richardson
House owners and renters - White residents 17,387 61.0% Owner occupied11,116 39.0% Renter occupiedHouse owners and renters - Black or African American residents 935 14.0% Owner occupied5,741 86.0% Renter occupiedHouse owners and renters - American Indian / Alaska Native residents 200 70.4% Owner occupied84 29.6% Renter occupiedHouse owners and renters - Asian residents 3,441 48.5% Owner occupied3,658 51.5% Renter occupiedHouse owners and renters - Native Hawaiian / Pacific Islander residents 20 100.0% Renter occupiedHouse owners and renters - Other race residents 560 26.9% Owner occupied1,520 73.1% Renter occupiedHouse owners and renters - Two or more races residents 1,418 39.7% Owner occupied2,151 60.3% Renter occupiedHouse owners and renters - White alone residents 16,777 61.7% Owner occupied10,418 38.3% Renter occupiedHouse owners and renters - Hispanic or Latino residents 2,294 39.7% Owner occupied3,489 60.3% Renter occupied
Language usage in Richardson
English speakers - Total 67.6% of residents of Richardson speak English at home.
11.4% of residents speak Spanish at home 7,791 60.7% Speak English very well5,038 39.3% Speak English less than very well21.0% of residents speak other language at home 16,812 71.0% Speak English very well6,861 29.0% Speak English less than very well
English speakers - Born in the United States 85.8% of residents of Richardson speak English at home.
4.9% of residents speak Spanish at home 1,677 94.6% Speak English very well96 5.4% Speak English less than very well9.3% of residents speak other language at home 2,959 88.5% Speak English very well386 11.5% Speak English less than very well
English speakers - Native, born elsewhere 84.9% of residents of Richardson speak English at home.
3.1% of residents speak Spanish at home 55 100.0% Speak English less than very well11.9% of residents speak other language at home 29 13.9% Speak English very well180 86.1% Speak English less than very well
English speakers - Foreign-born 16.3% of residents of Richardson speak English at home.
18.1% of residents speak Spanish at home 1,694 35.7% Speak English very well3,052 64.3% Speak English less than very well65.6% of residents speak other language at home 11,386 66.4% Speak English very well5,760 33.6% Speak English less than very well
White (Caucasian) - Speak only English Native:
94.7% (52,511)Foreign-born:
16.9% (828)
White (Caucasian) - Speak another language Native:
5.3% (2,951)Foreign-born:
83.1% (4,082)
Black or African American - Speak only English Native:
96.3% (9,171)Foreign-born:
20.5% (741)
Black or African American - Speak another language Native:
3.7% (351)Foreign-born:
79.5% (2,871)
American Indian / Alaska Native - Speak another language Native:
41.5% (233)Foreign-born:
100.0% (64)
Asian - Speak only English Native:
43.6% (3,502)Foreign-born:
14.6% (1,866)
Asian - Speak another language Native:
56.4% (4,528)Foreign-born:
85.4% (10,883)
Other race - Speak only English Native:
21.2% (920)Foreign-born:
25.0% (617)
Other race - Speak another language Native:
78.8% (3,411)Foreign-born:
75.0% (1,855)
Two or more races - Speak only English Native:
62.7% (5,250)Foreign-born:
8.8% (213)
Two or more races - Speak another language Native:
37.3% (3,120)Foreign-born:
91.2% (2,201)
White alone - Speak only English Native:
96.2% (51,211)Foreign-born:
19.6% (828)
White alone - Speak another language Native:
3.8% (2,032)Foreign-born:
80.4% (3,387)
Hispanic or Latino - Speak only English Native:
40.0% (4,905)Foreign-born:
7.7% (399)
Hispanic or Latino - Speak another language Native:
60.0% (7,357)Foreign-born:
92.3% (4,797)
Foreign-born residents in Richardson 28,223 residents are foreign born (12.4% Asia , 5.9% Latin America , 3.0% Africa ).
This city:
23.9%Texas:
17.1%
Marital status for residents in Richardson Marital status - White (Caucasian) population 15 years and over
Males 37.6% Never married52.0% Now married0.7% Separated2.6% Widowed7.1% DivorcedFemales 28.4% Never married50.6% Now married0.8% Separated6.8% Widowed13.4% DivorcedWomen who gave birth in the past 12 months Now married:
87.0% (576)Unmarried:
13.0% (86)
Women who did not give birth in the past 12 months Now married:
42.3% (6,045)Unmarried:
57.7% (8,260)
Marital status - Black or African American population 15 years and over
Males 52.8% Never married28.6% Now married8.2% Separated0.8% Widowed9.5% DivorcedFemales 54.1% Never married22.1% Now married0.7% Separated1.6% Widowed21.6% DivorcedWomen who gave birth in the past 12 months Now married:
100.0% (60)Unmarried:
0.0% (0)
Women who did not give birth in the past 12 months Now married:
29.5% (1,370)Unmarried:
70.5% (3,272)
Marital status - American Indian / Alaska Native population 15 years and over
Males 30.3% Never married60.6% Now married0.0% Separated0.0% Widowed9.1% DivorcedFemales 29.3% Never married45.3% Now married0.0% Separated3.3% Widowed22.1% DivorcedWomen who did not give birth in the past 12 months Now married:
42.9% (40)Unmarried:
57.1% (54)
Marital status - Asian population 15 years and over
Males 45.8% Never married50.5% Now married0.0% Separated2.4% Widowed1.3% DivorcedFemales 42.8% Never married47.9% Now married0.0% Separated6.6% Widowed2.8% DivorcedWomen who gave birth in the past 12 months Now married:
100.0% (344)Unmarried:
0.0% (0)
Women who did not give birth in the past 12 months Now married:
39.3% (2,638)Unmarried:
60.7% (4,069)
Marital status - Other race population 15 years and over
Males 63.2% Never married31.9% Now married1.2% Separated0.0% Widowed3.8% DivorcedFemales 48.0% Never married34.3% Now married0.9% Separated2.7% Widowed14.1% DivorcedWomen who gave birth in the past 12 months Now married:
36.6% (22)Unmarried:
63.4% (38)
Women who did not give birth in the past 12 months Now married:
32.5% (932)Unmarried:
67.5% (1,934)
Marital status - Two or more races population 15 years and over
Males 34.3% Never married47.5% Now married7.7% Separated0.8% Widowed9.6% DivorcedFemales 46.7% Never married44.8% Now married2.0% Separated2.1% Widowed4.4% DivorcedWomen who gave birth in the past 12 months Now married:
63.0% (125)Unmarried:
37.0% (74)
Women who did not give birth in the past 12 months Now married:
29.3% (1,314)Unmarried:
70.7% (3,166)
Marital status - White alone, not Hispanic / Latino population 15 years and over
Males 37.8% Never married51.4% Now married0.7% Separated2.7% Widowed7.4% DivorcedFemales 27.4% Never married50.9% Now married0.8% Separated7.2% Widowed13.7% DivorcedWomen who gave birth in the past 12 months Now married:
87.0% (576)Unmarried:
13.0% (86)
Women who did not give birth in the past 12 months Now married:
42.6% (5,558)Unmarried:
57.4% (7,502)
Marital status - Hispanic or Latino population 15 years and over
Males 33.1% Never married54.0% Now married6.0% Separated0.0% Widowed6.9% DivorcedFemales 48.2% Never married46.8% Now married1.1% Separated0.8% Widowed3.1% DivorcedWomen who gave birth in the past 12 months Now married:
71.5% (229)Unmarried:
28.5% (91)
Women who did not give birth in the past 12 months Now married:
36.5% (2,111)Unmarried:
63.5% (3,676)
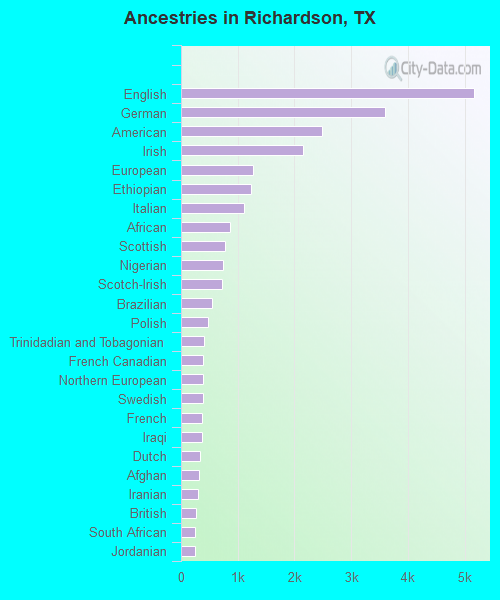
Ancestries in Richardson
5,169 7.7% English3,586 5.3% German2,493 3.7% American2,157 3.2% Irish1,272 1.9% European1,225 1.8% Ethiopian1,117 1.7% Italian868 1.3% African776 1.2% Scottish736 1.1% Nigerian726 1.1% Scotch-Irish545 0.8% Brazilian480 0.7% Polish404 0.6% Trinidadian and Tobagonian394 0.6% French Canadian393 0.6% Northern European380 0.6% Swedish375 0.6% French366 0.5% Iraqi338 0.5% Dutch315 0.5% Afghan302 0.4% Iranian265 0.4% British249 0.4% South African242 0.4% Jordanian227 0.3% Norwegian223 0.3% Russian210 0.3% Canadian209 0.3% Greek204 0.3% Bulgarian199 0.3% Welsh198 0.3% Egyptian196 0.3% Ghanaian186 0.3% Czech163 0.2% Assyrian163 0.2% Jamaican153 0.2% Arab126 0.2% Palestinian125 0.2% Kenyan113 0.2% Hungarian112 0.2% Armenian111 0.2% Lithuanian103 0.2% Sudanese103 0.2% Finnish97 0.1% Portuguese94 0.1% Turkish71 0.1% Lebanese70 0.1% Austrian67 0.10% Scandinavian66 0.10% Syrian66 0.10% Eastern European66 0.10% Ukrainian63 0.09% Barbadian53 0.08% Romanian51 0.08% Moroccan42 0.06% Slavic36 0.05% Cape Verdean35 0.05% Czechoslovakian33 0.05% Belgian27 0.04% Danish21 0.03% Yugoslavian16 0.02% Haitian14 0.02% Celtic12 0.02% Bahamian9 0.01% Pennsylvania German8 0.01% Maltese8 0.01% Swiss7 0.01% Slovak6 0.01% Alsatian
Geographical mobility in Richardson Same house 1 year ago 52,999 84.7% White (Caucasian)9,893 72.4% Black or African American404 67.1% American Indian / Alaska Native15,440 70.3% Asian74 98.2% Native Hawaiian / Pacific Islander4,485 65.2% Other race10,741 76.5% Two or more races49,744 84.2% White alone, not Hispanic / Latino13,171 70.8% Hispanic or LatinoMoved within same county 3,340 5.3% White / Caucasian2,412 17.6% Black or African American42 6.9% American Indian / Alaska Native1,748 8.0% Asian1,308 19.0% Other race2,089 14.9% Two or more races3,233 5.5% White alone, not Hispanic / Latino3,734 20.1% Hispanic or LatinoMoved within same state 4,397 7.0% White / Caucasian1,363 10.0% Black or African American75 12.5% American Indian / Alaska Native2,748 12.5% Asian1,087 15.8% Other race869 6.2% Two or more races4,339 7.3% White alone, not Hispanic / Latino1,598 8.6% Hispanic or LatinoMoved from different state 1,470 2.3% White / Caucasian17 2.9% American Indian / Alaska Native1,209 5.5% Asian88 0.6% Two or more races1,425 2.4% White alone, not Hispanic / Latino45 0.2% Hispanic or LatinoMoved from abroad 354 0.6% White47 7.8% American Indian / Alaska Native807 3.7% Asian165 1.2% Two or more races306 0.5% White alone, not Hispanic / Latino48 0.3% Hispanic or Latino
Children Nativity (place of birth) in Richardson
Children under 6 years - Living with two parents Both parents native 3,000 100.0% NativeBoth parents foreign-born 1,153 85.3% Native199 14.7% Foreign-bornOne native, one foreign-born parent 1,945 100.0% NativeChildren under 6 years - Living with one parent Native parent 163 100.0% NativeForeign-born parent 302 100.0% NativeChildren 6 to 17 years - Living with two parents Both parents native 5,394 100.0% NativeBoth parents foreign-born 2,576 74.3% Native892 25.7% Foreign-bornOne native, one foreign-born parent 1,592 100.0% NativeChildren 6 to 17 years - Living with one parent Native parent 4,410 100.0% NativeForeign-born parent 1,339 52.0% Native1,237 48.0% Foreign-born
Place of birth for residents in Richardson 15,181 Asia7,802 Americas7,277 Latin America5,554 Central America5,388 South Central Asia4,204 Eastern Asia3,658 Africa3,449 China3,434 South Eastern Asia2,008 Western Asia1,581 Europe1,148 Eastern Africa1,064 South America1,019 Western Africa921 Middle Africa766 Eastern Europe658 Caribbean525 Northern America330 Northern Europe302 Southern Africa273 Western Europe266 Northern Africa210 Southern Europe4,276 Mexico3,177 India2,582 China1,730 Vietnam1,178 Iraq1,101 Pakistan890 Ethiopia805 Cameroon720 Philippines678 Taiwan646 Korea635 Nigeria525 Canada471 El Salvador438 Honduras423 Brazil376 Burma (Myanmar)347 Iran302 South Africa294 Bulgaria287 Trinidad and Tobago268 Guatemala257 Saudi Arabia244 Bangladesh240 Colombia224 Germany218 Venezuela197 Russia197 Ivory Coast196 Cambodia188 Hong Kong183 Kenya157 Malaysia153 Egypt141 Kuwait139 Jordan139 Jamaica130 Afghanistan111 Ghana109 Greece107 Turkey107 United Kingdom107 Japan105 Argentina100 Nepal98 Thailand90 Morocco86 Democratic Republic of Congo (Zaire)77 England74 Eritrea73 Indonesia73 Poland71 Romania70 Israel67 Cuba64 Sri Lanka60 Sweden60 Laos51 Bosnia and Herzegovina45 Barbados44 Syria42 Portugal39 Hungary37 Costa Rica36 Panama29 Italy29 Spain27 Chile25 Nicaragua24 Lebanon22 St. Vincent and the Grenadines22 United Arab Emirates21 Ukraine20 Singapore20 Ecuador19 Uzbekistan17 Switzerland15 Haiti14 Sudan14 Netherlands14 Azerbaijan10 Belgium10 Guyana9 Scotland9 Dominican Republic8 Ireland8 Algeria8 Uruguay7 Czechoslovakia6 Armenia6 France6 Bahamas3 Latvia
Grandparents responsible for own grandchildren in Richardson
Grandparents (30 to 59 years) White / Caucasian 96 25.4% Responsible for grandchildren284 74.6% Not responsible for grandchildrenBlack or African American 51 100.0% Not responsible for grandchildrenAsian 4 100.0% Responsible for grandchildrenOther race 62 100.0% Responsible for grandchildrenTwo or more races 15 100.0% Not responsible for grandchildrenWhite alone, not Hispanic / Latino 73 40.5% Responsible for grandchildren106 59.5% Not responsible for grandchildrenHispanic or Latino 168 34.3% Responsible for grandchildren321 65.7% Not responsible for grandchildrenGrandparents (60 years and over) White / Caucasian 176 49.4% Responsible for grandchildren180 50.6% Not responsible for grandchildrenBlack or African American 96 77.3% Responsible for grandchildren28 22.7% Not responsible for grandchildrenAsian 125 59.0% Responsible for grandchildren87 41.0% Not responsible for grandchildrenOther race 174 100.0% Not responsible for grandchildrenTwo or more races 60 100.0% Not responsible for grandchildrenWhite alone, not Hispanic / Latino 224 41.8% Responsible for grandchildren312 58.2% Not responsible for grandchildrenHispanic or Latino 204 100.0% Not responsible for grandchildren