Races in Ramsey, New Jersey (NJ) Detailed Stats
Data:
Races - White alone (%)
Races - White alone (% change since 2000)
Races - Black alone (%)
Races - Black alone (% change since 2000)
Races - American Indian alone (%)
Races - American Indian alone (% change since 2000)
Races - Asian alone (%)
Races - Asian alone (% change since 2000)
Races - Hispanic (%)
Races - Hispanic (% change since 2000)
Races - Native Hawaiian and Other Pacific Islander alone (%)
Races - Native Hawaiian and Other Pacific Islander alone (% change since 2000)
Races - Two or more races(%)
Races - Two or more races(% change since 2000)
Races - Other race alone (%)
Races - Other race alone (% change since 2000)
Racial diversity
Place of birth - Born in state of residence (%)
Place of birth - Born in state of residence (%) - White
Place of birth - Born in state of residence (%) - Black or African American
Place of birth - Born in state of residence (%) - Asian
Place of birth - Born in state of residence (%) - Hispanic or Latino
Place of birth - Born in state of residence (%) - American Indian and Alaska Native
Place of birth - Born in state of residence (%) - Multirace
Place of birth - Born in state of residence (%) - Other Race
Place of birth - Born in other state (%)
Place of birth - Born in other state (%) - White
Place of birth - Born in other state (%) - Black or African American
Place of birth - Born in other state (%) - Asian
Place of birth - Born in other state (%) - Hispanic or Latino
Place of birth - Born in other state (%) - American Indian and Alaska Native
Place of birth - Born in other state (%) - Multirace
Place of birth - Born in other state (%) - Other Race
Place of birth - Native, outside of US (%)
Place of birth - Native, outside of US (%) - White
Place of birth - Native, outside of US (%) - Black or African American
Place of birth - Native, outside of US (%) - Asian
Place of birth - Native, outside of US (%) - Hispanic or Latino
Place of birth - Native, outside of US (%) - American Indian and Alaska Native
Place of birth - Native, outside of US (%) - Multirace
Place of birth - Native, outside of US (%) - Other Race
Place of birth - Foreign born (%)
Place of birth - Foreign born (%) - White
Place of birth - Foreign born (%) - Black or African American
Place of birth - Foreign born (%) - Asian
Place of birth - Foreign born (%) - Hispanic or Latino
Place of birth - Foreign born (%) - American Indian and Alaska Native
Place of birth - Foreign born (%) - Multirace
Place of birth - Foreign born (%) - Other Race
Residents speaking English at home (%)
Residents speaking English at home - Born in the United States (%)
Residents speaking English at home - Native, born elsewhere (%)
Residents speaking English at home - Foreign born (%)
Residents speaking Spanish at home (%)
Residents speaking Spanish at home - Born in the United States (%)
Residents speaking Spanish at home - Native, born elsewhere (%)
Residents speaking Spanish at home - Foreign born (%)
Residents speaking other language at home (%)
Residents speaking other language at home - Born in the United States (%)
Residents speaking other language at home - Native, born elsewhere (%)
Residents speaking other language at home - Foreign born (%)
Marital status - Never married (%)
Marital status - Now married (%)
Marital status - Separated (%)
Marital status - Widowed (%)
Marital status - Divorced (%)
Ancestries Reported - Arab (%)
Ancestries Reported - Czech (%)
Ancestries Reported - Danish (%)
Ancestries Reported - Dutch (%)
Ancestries Reported - English (%)
Ancestries Reported - French (%)
Ancestries Reported - French Canadian (%)
Ancestries Reported - German (%)
Ancestries Reported - Greek (%)
Ancestries Reported - Hungarian (%)
Ancestries Reported - Irish (%)
Ancestries Reported - Italian (%)
Ancestries Reported - Lithuanian (%)
Ancestries Reported - Norwegian (%)
Ancestries Reported - Polish (%)
Ancestries Reported - Portuguese (%)
Ancestries Reported - Russian (%)
Ancestries Reported - Scotch-Irish (%)
Ancestries Reported - Scottish (%)
Ancestries Reported - Slovak (%)
Ancestries Reported - Subsaharan African (%)
Ancestries Reported - Swedish (%)
Ancestries Reported - Swiss (%)
Ancestries Reported - Ukrainian (%)
Ancestries Reported - United States (%)
Ancestries Reported - Welsh (%)
Ancestries Reported - West Indian (%)
Ancestries Reported - Other (%)
Geographical mobility - Same house 1 year ago (%)
Geographical mobility - Same house 1 year ago (%) - White
Geographical mobility - Same house 1 year ago (%) - Black or African American
Geographical mobility - Same house 1 year ago (%) - Asian
Geographical mobility - Same house 1 year ago (%) - Hispanic or Latino
Geographical mobility - Same house 1 year ago (%) - American Indian and Alaska Native
Geographical mobility - Same house 1 year ago (%) - Multirace
Geographical mobility - Same house 1 year ago (%) - Other Race
Geographical mobility - Moved within same county (%)
Geographical mobility - Moved within same county (%) - White
Geographical mobility - Moved within same county (%) - Black or African American
Geographical mobility - Moved within same county (%) - Asian
Geographical mobility - Moved within same county (%) - Hispanic or Latino
Geographical mobility - Moved within same county (%) - American Indian and Alaska Native
Geographical mobility - Moved within same county (%) - Multirace
Geographical mobility - Moved within same county (%) - Other Race
Geographical mobility - Moved from different county within same state (%)
Geographical mobility - Moved from different county within same state (%) - White
Geographical mobility - Moved from different county within same state (%) - Black or African American
Geographical mobility - Moved from different county within same state (%) - Asian
Geographical mobility - Moved from different county within same state (%) - Hispanic or Latino
Geographical mobility - Moved from different county within same state (%) - American Indian and Alaska Native
Geographical mobility - Moved from different county within same state (%) - Multirace
Geographical mobility - Moved from different county within same state (%) - Other Race
Geographical mobility - Moved from different state (%)
Geographical mobility - Moved from different state (%) - White
Geographical mobility - Moved from different state (%) - Black or African American
Geographical mobility - Moved from different state (%) - Asian
Geographical mobility - Moved from different state (%) - Hispanic or Latino
Geographical mobility - Moved from different state (%) - American Indian and Alaska Native
Geographical mobility - Moved from different state (%) - Multirace
Geographical mobility - Moved from different state (%) - Other Race
Geographical mobility - Moved from abroad (%)
Geographical mobility - Moved from abroad (%) - White
Geographical mobility - Moved from abroad (%) - Black or African American
Geographical mobility - Moved from abroad (%) - Asian
Geographical mobility - Moved from abroad (%) - Hispanic or Latino
Geographical mobility - Moved from abroad (%) - American Indian and Alaska Native
Geographical mobility - Moved from abroad (%) - Multirace
Geographical mobility - Moved from abroad (%) - Other Race
Place of birth for the foreign-born population - Ireland (%)
Place of birth for the foreign-born population - Denmark (%)
Place of birth for the foreign-born population - Norway (%)
Place of birth for the foreign-born population - Sweden (%)
Place of birth for the foreign-born population - United Kingdom (%)
Place of birth for the foreign-born population - England (%)
Place of birth for the foreign-born population - Scotland (%)
Place of birth for the foreign-born population - Other Northern Europe (%)
Place of birth for the foreign-born population - Austria (%)
Place of birth for the foreign-born population - Belgium (%)
Place of birth for the foreign-born population - France (%)
Place of birth for the foreign-born population - Germany (%)
Place of birth for the foreign-born population - Netherlands (%)
Place of birth for the foreign-born population - Switzerland (%)
Place of birth for the foreign-born population - Other Western Europe (%)
Place of birth for the foreign-born population - Greece (%)
Place of birth for the foreign-born population - Italy (%)
Place of birth for the foreign-born population - Portugal (%)
Place of birth for the foreign-born population - Spain (%)
Place of birth for the foreign-born population - Other Southern Europe (%)
Place of birth for the foreign-born population - Albania (%)
Place of birth for the foreign-born population - Belarus (%)
Place of birth for the foreign-born population - Bosnia and Herzegovina (%)
Place of birth for the foreign-born population - Bulgaria (%)
Place of birth for the foreign-born population - Croatia (%)
Place of birth for the foreign-born population - Czechoslovakia (%)
Place of birth for the foreign-born population - Hungary (%)
Place of birth for the foreign-born population - Latvia (%)
Place of birth for the foreign-born population - Lithuania (%)
Place of birth for the foreign-born population - North Macedonia (Macedonia) (%)
Place of birth for the foreign-born population - Moldova (%)
Place of birth for the foreign-born population - Poland (%)
Place of birth for the foreign-born population - Romania (%)
Place of birth for the foreign-born population - Russia (%)
Place of birth for the foreign-born population - Serbia (%)
Place of birth for the foreign-born population - Ukraine (%)
Place of birth for the foreign-born population - Other Eastern Europe (%)
Place of birth for the foreign-born population - China (%)
Place of birth for the foreign-born population - Hong Kong (%)
Place of birth for the foreign-born population - Taiwan (%)
Place of birth for the foreign-born population - Japan (%)
Place of birth for the foreign-born population - Korea (%)
Place of birth for the foreign-born population - Other Eastern Asia (%)
Place of birth for the foreign-born population - Afghanistan (%)
Place of birth for the foreign-born population - Bangladesh (%)
Place of birth for the foreign-born population - India (%)
Place of birth for the foreign-born population - Iran (%)
Place of birth for the foreign-born population - Kazakhstan (%)
Place of birth for the foreign-born population - Nepal (%)
Place of birth for the foreign-born population - Pakistan (%)
Place of birth for the foreign-born population - Sri Lanka (%)
Place of birth for the foreign-born population - Uzbekistan (%)
Place of birth for the foreign-born population - Other South Central Asia (%)
Place of birth for the foreign-born population - Burma (%)
Place of birth for the foreign-born population - Cambodia (%)
Place of birth for the foreign-born population - Indonesia (%)
Place of birth for the foreign-born population - Laos (%)
Place of birth for the foreign-born population - Malaysia (%)
Place of birth for the foreign-born population - Philippines (%)
Place of birth for the foreign-born population - Singapore (%)
Place of birth for the foreign-born population - Thailand (%)
Place of birth for the foreign-born population - Vietnam (%)
Place of birth for the foreign-born population - Other South Eastern Asia (%)
Place of birth for the foreign-born population - Armenia (%)
Place of birth for the foreign-born population - Iraq (%)
Place of birth for the foreign-born population - Israel (%)
Place of birth for the foreign-born population - Jordan (%)
Place of birth for the foreign-born population - Kuwait (%)
Place of birth for the foreign-born population - Lebanon (%)
Place of birth for the foreign-born population - Saudi Arabia (%)
Place of birth for the foreign-born population - Syria (%)
Place of birth for the foreign-born population - Turkey (%)
Place of birth for the foreign-born population - Yemen (%)
Place of birth for the foreign-born population - Other Western Asia (%)
Place of birth for the foreign-born population - Eritrea (%)
Place of birth for the foreign-born population - Ethiopia (%)
Place of birth for the foreign-born population - Kenya (%)
Place of birth for the foreign-born population - Somalia (%)
Place of birth for the foreign-born population - Uganda (%)
Place of birth for the foreign-born population - Zimbabwe (%)
Place of birth for the foreign-born population - Other Eastern Africa (%)
Place of birth for the foreign-born population - Cameroon (%)
Place of birth for the foreign-born population - Congo (%)
Place of birth for the foreign-born population - Democratic Republic of Congo (Zaire) (%)
Place of birth for the foreign-born population - Other Middle Africa (%)
Place of birth for the foreign-born population - Egypt (%)
Place of birth for the foreign-born population - Morocco (%)
Place of birth for the foreign-born population - Sudan (%)
Place of birth for the foreign-born population - Other Northern Africa (%)
Place of birth for the foreign-born population - South Africa (%)
Place of birth for the foreign-born population - Other Southern Africa (%)
Place of birth for the foreign-born population - Cabo Verde (%)
Place of birth for the foreign-born population - Ghana (%)
Place of birth for the foreign-born population - Liberia (%)
Place of birth for the foreign-born population - Nigeria (%)
Place of birth for the foreign-born population - Senegal (%)
Place of birth for the foreign-born population - Sierra Leone (%)
Place of birth for the foreign-born population - Other Western Africa (%)
Place of birth for the foreign-born population - Australia (%)
Place of birth for the foreign-born population - New Zealand (%)
Place of birth for the foreign-born population - Fiji (%)
Place of birth for the foreign-born population - Micronesia (%)
Place of birth for the foreign-born population - Bahamas (%)
Place of birth for the foreign-born population - Barbados (%)
Place of birth for the foreign-born population - Cuba (%)
Place of birth for the foreign-born population - Dominica (%)
Place of birth for the foreign-born population - Dominican Republic (%)
Place of birth for the foreign-born population - Grenada (%)
Place of birth for the foreign-born population - Haiti (%)
Place of birth for the foreign-born population - Jamaica (%)
Place of birth for the foreign-born population - St. Vincent and the Grenadines (%)
Place of birth for the foreign-born population - Trinidad and Tobago (%)
Place of birth for the foreign-born population - West Indies (%)
Place of birth for the foreign-born population - Other Caribbean (%)
Place of birth for the foreign-born population - Belize (%)
Place of birth for the foreign-born population - Costa Rica (%)
Place of birth for the foreign-born population - El Salvador (%)
Place of birth for the foreign-born population - Guatemala (%)
Place of birth for the foreign-born population - Honduras (%)
Place of birth for the foreign-born population - Mexico (%)
Place of birth for the foreign-born population - Nicaragua (%)
Place of birth for the foreign-born population - Panama (%)
Place of birth for the foreign-born population - Other Central America (%)
Place of birth for the foreign-born population - Argentina (%)
Place of birth for the foreign-born population - Bolivia (%)
Place of birth for the foreign-born population - Brazil (%)
Place of birth for the foreign-born population - Chile (%)
Place of birth for the foreign-born population - Colombia (%)
Place of birth for the foreign-born population - Ecuador (%)
Place of birth for the foreign-born population - Guyana (%)
Place of birth for the foreign-born population - Peru (%)
Place of birth for the foreign-born population - Uruguay (%)
Place of birth for the foreign-born population - Venezuela (%)
Place of birth for the foreign-born population - Other South America (%)
Place of birth for the foreign-born population - Canada (%)
Place of birth for the foreign-born population - Other Northern America (%)
Place of birth for the foreign-born population - Other (%)
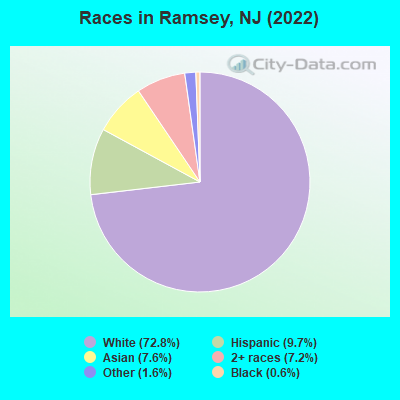
According to 2022 data, the most numerous races in Ramsey, NJ are White alone (10,734 residents), Hispanic (1,436 residents), and Black alone (91 residents). 80.6% of Ramsey residents speak English at home. 16.2% of Ramsey, NJ residents are foreign-born (6.2% born in Asia, 4.9% born in Europe, 4.1% born in Latin America), which is 42.0% less than the foreign-born rate of 23.0% across the entire state of New Jersey.
Race distribution in Ramsey
2000 2022
5,557,209 66.0% White alone 1,117,191 13.3% Hispanic 1,096,171 13.0% Black alone 477,012 5.7% Asian alone 133,689 1.6% Two or more races 19,565 0.2% Other race alone 11,338 0.1% American Indian alone 2,175 0.03% Native Hawaiian and Other
4,766,476 51.5% White alone 2,028,470 21.9% Hispanic 1,111,632 12.0% Black alone 923,546 10.0% Asian alone 332,237 3.6% Two or more races 89,847 1.0% Other race alone 8,557 0.09% American Indian alone 934 0.01% Native Hawaiian and Other
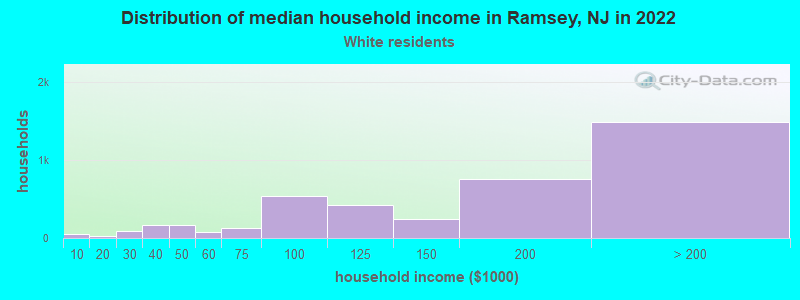
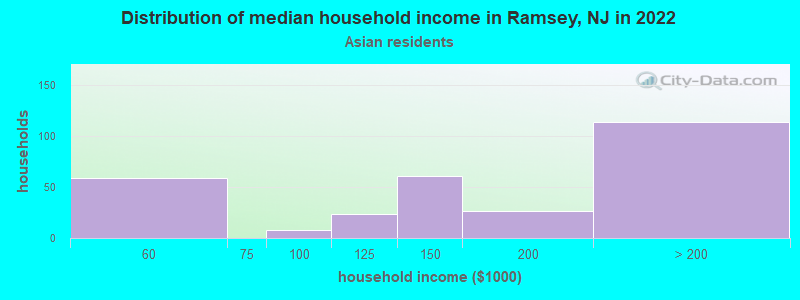
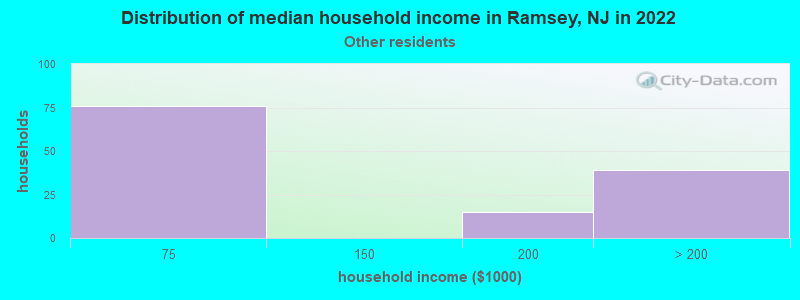
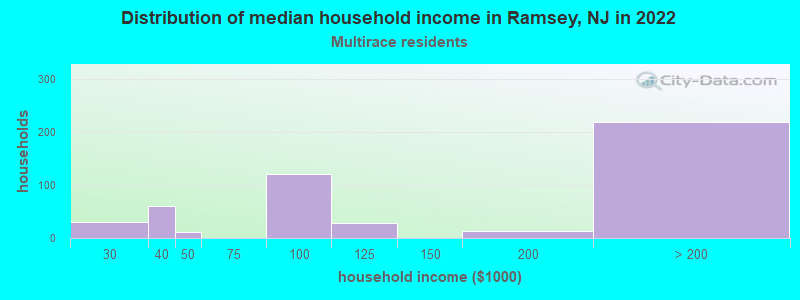
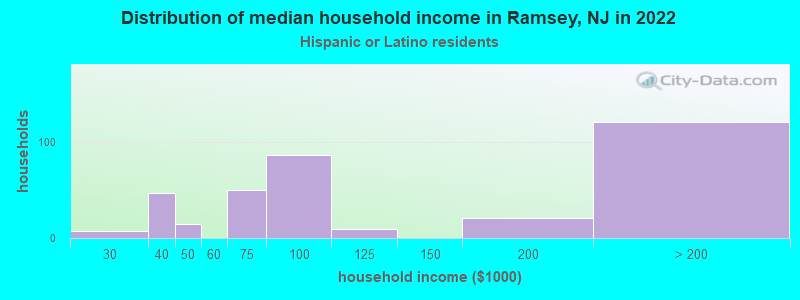
Income and house value in Ramsey Median household income in 2022 $155,939 White non-Hispanic householders$124,665 Asian householdersMedian 2022 house value $727,518 White Non-Hispanic householders$427,150 Black or African American householders $704,227 Asian householders$817,826 Two or more races householders$589,090 Hispanic or Latino householders
Median age by race in Ramsey
46.4 Median age for White residents45.1 48.0 58.8 Median age for Black or African American residents37.2 74.7 -766,197,182.3 Median age for American Indian / Alaska Native residents-686,322,685.6 -753,722,794.2 39.0 Median age for Asian residents32.8 39.4 -510,460,250.5 Median age for Native Hawaiian / Pacific Islander residents-514,767,932.0 -713,070,378.3 19.0 Median age for Other race residents15.6 19.8 35.5 Median age for Two or more races residents26.9 35.1 44.8 Median age for White alone residents43.6 46.8 37.1 Median age for Hispanic or Latino residents27.1 42.9
Owner/renter occupied households by race in Ramsey
House owners and renters - White residents 3,672 87.1% Owner occupied544 12.9% Renter occupiedHouse owners and renters - Black or African American residents 15 100.0% Renter occupiedHouse owners and renters - Asian residents 241 79.7% Owner occupied61 20.3% Renter occupiedHouse owners and renters - Other race residents 60 48.8% Owner occupied63 51.2% Renter occupiedHouse owners and renters - Two or more races residents 390 82.9% Owner occupied80 17.1% Renter occupiedHouse owners and renters - White alone residents 3,717 86.3% Owner occupied593 13.7% Renter occupiedHouse owners and renters - Hispanic or Latino residents 243 68.1% Owner occupied114 31.9% Renter occupied
Language usage in Ramsey
English speakers - Total 80.6% of residents of Ramsey speak English at home.
6.5% of residents speak Spanish at home 574 61.8% Speak English very well355 38.2% Speak English less than very well11.6% of residents speak other language at home 1,264 76.7% Speak English very well385 23.3% Speak English less than very well
English speakers - Born in the United States 90.6% of residents of Ramsey speak English at home.
3.1% of residents speak Spanish at home 140 100.0% Speak English very well4.3% of residents speak other language at home 198 100.0% Speak English very well
English speakers - Native, born elsewhere 76.7% of residents of Ramsey speak English at home.
12.4% of residents speak other language at home 16 100.0% Speak English very well
English speakers - Foreign-born 25.4% of residents of Ramsey speak English at home.
22.1% of residents speak Spanish at home 250 47.8% Speak English very well273 52.2% Speak English less than very well51.4% of residents speak other language at home 832 68.4% Speak English very well384 31.6% Speak English less than very well
White (Caucasian) - Speak only English Native:
98.5% (9,109)Foreign-born:
44.8% (320)
White (Caucasian) - Speak another language Native:
3.6% (328)Foreign-born:
60.6% (432)
Black or African American - Speak only English Native:
99.9% (53)Foreign-born:
100.0% (35)
Asian - Speak only English Native:
49.6% (117)Foreign-born:
18.5% (161)
Asian - Speak another language Native:
50.6% (119)Foreign-born:
81.3% (708)
Other race - Speak only English Native:
52.2% (291)Foreign-born:
11.9% (26)
Other race - Speak another language Native:
37.8% (211)Foreign-born:
83.6% (182)
Two or more races - Speak only English Native:
86.3% (1,350)Foreign-born:
9.2% (45)
Two or more races - Speak another language Native:
10.0% (157)Foreign-born:
91.3% (453)
White alone - Speak only English Native:
96.6% (9,267)Foreign-born:
36.2% (267)
White alone - Speak another language Native:
3.7% (356)Foreign-born:
63.3% (466)
Hispanic or Latino - Speak only English Native:
56.6% (468)Foreign-born:
13.8% (82)
Hispanic or Latino - Speak another language Native:
39.6% (327)Foreign-born:
87.0% (518)
Foreign-born residents in Ramsey 2,387 residents are foreign born (6.2% Asia , 4.9% Europe , 4.1% Latin America ).
This city:
16.2%New Jersey:
23.2%
Marital status for residents in Ramsey Marital status - White (Caucasian) population 15 years and over
Males 33.7% Never married56.2% Now married0.4% Separated0.9% Widowed8.9% DivorcedFemales 27.8% Never married54.7% Now married0.3% Separated8.0% Widowed9.2% DivorcedWomen who gave birth in the past 12 months Now married:
67.8% (49)Unmarried:
32.2% (23)
Women who did not give birth in the past 12 months Now married:
45.8% (800)Unmarried:
54.2% (945)
Marital status - Black or African American population 15 years and over
Males 25.0% Never married42.9% Now married0.0% Separated0.0% Widowed32.1% DivorcedFemales 25.0% Never married0.0% Now married0.0% Separated75.0% Widowed0.0% DivorcedWomen who did not give birth in the past 12 months Now married:
0.0% (0)Unmarried:
100.0% (9)
Marital status - Asian population 15 years and over
Males 32.4% Never married67.6% Now married0.0% Separated0.0% Widowed0.0% DivorcedFemales 33.5% Never married59.8% Now married0.0% Separated6.7% Widowed0.0% DivorcedWomen who gave birth in the past 12 months Now married:
100.0% (10)Unmarried:
0.0% (0)
Women who did not give birth in the past 12 months Now married:
62.1% (298)Unmarried:
37.9% (182)
Marital status - Other race population 15 years and over
Males 46.2% Never married35.7% Now married0.0% Separated0.0% Widowed18.1% DivorcedFemales 63.8% Never married36.2% Now married0.0% Separated0.0% Widowed0.0% DivorcedWomen who did not give birth in the past 12 months Now married:
38.3% (95)Unmarried:
61.7% (154)
Marital status - Two or more races population 15 years and over
Males 33.8% Never married64.6% Now married1.6% Separated0.0% Widowed0.0% DivorcedFemales 27.6% Never married61.8% Now married0.0% Separated0.0% Widowed10.6% DivorcedWomen who gave birth in the past 12 months Now married:
0.0% (0)Unmarried:
100.0% (29)
Women who did not give birth in the past 12 months Now married:
65.2% (420)Unmarried:
34.8% (225)
Marital status - White alone, not Hispanic / Latino population 15 years and over
Males 33.0% Never married56.5% Now married0.4% Separated0.9% Widowed9.2% DivorcedFemales 27.2% Never married54.8% Now married0.3% Separated8.2% Widowed9.4% DivorcedWomen who gave birth in the past 12 months Now married:
67.8% (56)Unmarried:
32.2% (27)
Women who did not give birth in the past 12 months Now married:
46.6% (895)Unmarried:
53.4% (1,024)
Marital status - Hispanic or Latino population 15 years and over
Males 48.5% Never married42.3% Now married1.4% Separated0.0% Widowed7.8% DivorcedFemales 45.8% Never married43.4% Now married0.0% Separated0.0% Widowed10.9% DivorcedWomen who gave birth in the past 12 months Now married:
0.0% (0)Unmarried:
100.0% (21)
Women who did not give birth in the past 12 months Now married:
41.7% (202)Unmarried:
58.3% (282)
Ancestries in Ramsey
1,245 21.2% Italian616 10.5% Irish558 9.5% American380 6.5% German233 4.0% English201 3.4% Greek175 3.0% Polish122 2.1% European103 1.8% Turkish101 1.7% Hungarian82 1.4% Dutch82 1.4% Eastern European72 1.2% Ukrainian58 1.0% West Indian58 1.0% Russian49 0.8% Czech47 0.8% Armenian47 0.8% Australian43 0.7% Scottish32 0.5% Swedish26 0.4% South African25 0.4% Afghan25 0.4% British22 0.4% Portuguese22 0.4% Romanian18 0.3% Jamaican15 0.3% Belgian14 0.2% Norwegian12 0.2% Scotch-Irish11 0.2% Lebanese11 0.2% Guyanese10 0.2% Austrian10 0.2% Swiss10 0.2% Croatian9 0.2% Brazilian8 0.1% Scandinavian7 0.1% Syrian6 0.1% French
Geographical mobility in Ramsey Same house 1 year ago 9,455 94.3% White (Caucasian)90 98.6% Black or African American1,023 92.1% Asian793 100.0% Other race2,077 95.5% Two or more races10,028 94.0% White alone, not Hispanic / Latino1,343 93.0% Hispanic or LatinoMoved within same county 534 5.3% White / Caucasian1 1.4% Black or African American51 100.0% American Indian / Alaska Native37 3.3% Asian1 0.1% Two or more races575 5.4% White alone, not Hispanic / Latino31 2.2% Hispanic or LatinoMoved within same state 25 0.2% White / Caucasian29 0.3% White alone, not Hispanic / LatinoMoved from different state 10 0.1% White / Caucasian26 2.4% Asian65 3.0% Two or more races11 0.1% White alone, not Hispanic / Latino43 2.9% Hispanic or LatinoMoved from abroad 28 0.3% White15 1.4% Asian41 0.4% White alone, not Hispanic / Latino
Children Nativity (place of birth) in Ramsey
Children under 6 years - Living with two parents Both parents native 593 100.0% NativeBoth parents foreign-born 17 100.0% Foreign-bornOne native, one foreign-born parent 105 100.0% NativeChildren under 6 years - Living with one parent Native parent 49 100.0% NativeChildren 6 to 17 years - Living with two parents Both parents native 1,705 99.1% Native15 0.9% Foreign-bornBoth parents foreign-born 268 58.1% Native193 41.9% Foreign-bornOne native, one foreign-born parent 263 100.0% NativeChildren 6 to 17 years - Living with one parent Native parent 402 100.0% NativeForeign-born parent 207 49.5% Native212 50.5% Foreign-born
Grandparents responsible for own grandchildren in Ramsey
Grandparents (30 to 59 years) White / Caucasian 8 100.0% Not responsible for grandchildrenAsian 12 100.0% Not responsible for grandchildrenWhite alone, not Hispanic / Latino 9 100.0% Not responsible for grandchildren
Grandparents (60 years and over) White / Caucasian 63 100.0% Not responsible for grandchildrenAsian 8 100.0% Not responsible for grandchildrenWhite alone, not Hispanic / Latino 73 100.0% Not responsible for grandchildren