Races in Portsmouth, Virginia (VA) Detailed Stats
Data:
Races - White alone (%)
Races - White alone (% change since 2000)
Races - Black alone (%)
Races - Black alone (% change since 2000)
Races - American Indian alone (%)
Races - American Indian alone (% change since 2000)
Races - Asian alone (%)
Races - Asian alone (% change since 2000)
Races - Hispanic (%)
Races - Hispanic (% change since 2000)
Races - Native Hawaiian and Other Pacific Islander alone (%)
Races - Native Hawaiian and Other Pacific Islander alone (% change since 2000)
Races - Two or more races(%)
Races - Two or more races(% change since 2000)
Races - Other race alone (%)
Races - Other race alone (% change since 2000)
Racial diversity
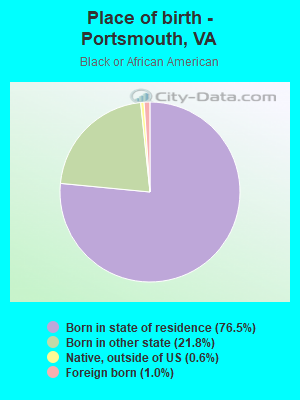
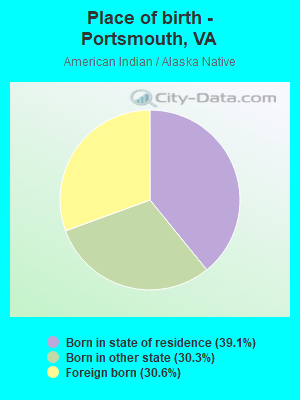
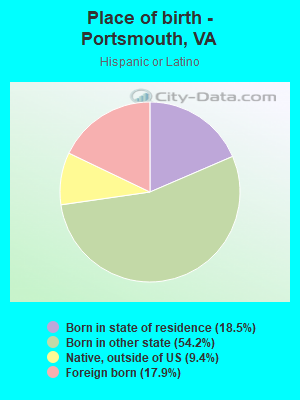
Place of birth - Born in state of residence (%)
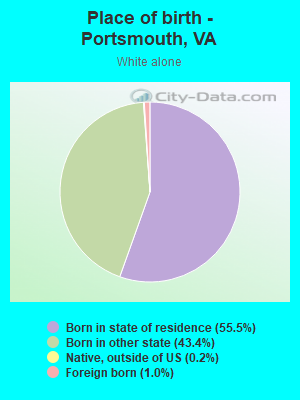
Place of birth - Born in state of residence (%) - White
Place of birth - Born in state of residence (%) - Black or African American
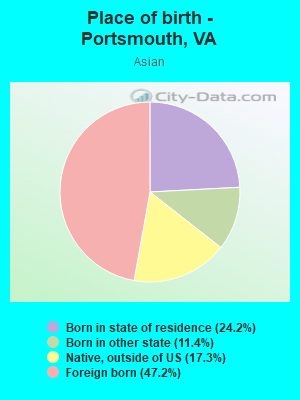
Place of birth - Born in state of residence (%) - Asian
Place of birth - Born in state of residence (%) - Hispanic or Latino
Place of birth - Born in state of residence (%) - American Indian and Alaska Native
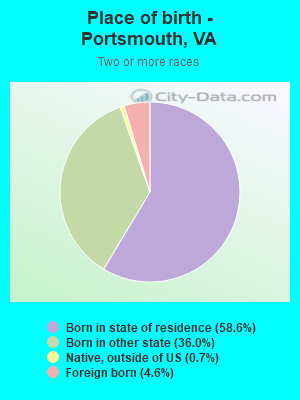
Place of birth - Born in state of residence (%) - Multirace
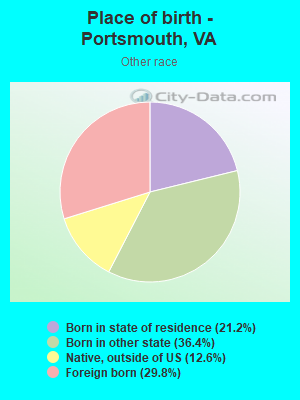
Place of birth - Born in state of residence (%) - Other Race
Place of birth - Born in other state (%)
Place of birth - Born in other state (%) - White
Place of birth - Born in other state (%) - Black or African American
Place of birth - Born in other state (%) - Asian
Place of birth - Born in other state (%) - Hispanic or Latino
Place of birth - Born in other state (%) - American Indian and Alaska Native
Place of birth - Born in other state (%) - Multirace
Place of birth - Born in other state (%) - Other Race
Place of birth - Native, outside of US (%)
Place of birth - Native, outside of US (%) - White
Place of birth - Native, outside of US (%) - Black or African American
Place of birth - Native, outside of US (%) - Asian
Place of birth - Native, outside of US (%) - Hispanic or Latino
Place of birth - Native, outside of US (%) - American Indian and Alaska Native
Place of birth - Native, outside of US (%) - Multirace
Place of birth - Native, outside of US (%) - Other Race
Place of birth - Foreign born (%)
Place of birth - Foreign born (%) - White
Place of birth - Foreign born (%) - Black or African American
Place of birth - Foreign born (%) - Asian
Place of birth - Foreign born (%) - Hispanic or Latino
Place of birth - Foreign born (%) - American Indian and Alaska Native
Place of birth - Foreign born (%) - Multirace
Place of birth - Foreign born (%) - Other Race
Residents speaking English at home (%)
Residents speaking English at home - Born in the United States (%)
Residents speaking English at home - Native, born elsewhere (%)
Residents speaking English at home - Foreign born (%)
Residents speaking Spanish at home (%)
Residents speaking Spanish at home - Born in the United States (%)
Residents speaking Spanish at home - Native, born elsewhere (%)
Residents speaking Spanish at home - Foreign born (%)
Residents speaking other language at home (%)
Residents speaking other language at home - Born in the United States (%)
Residents speaking other language at home - Native, born elsewhere (%)
Residents speaking other language at home - Foreign born (%)
Marital status - Never married (%)
Marital status - Now married (%)
Marital status - Separated (%)
Marital status - Widowed (%)
Marital status - Divorced (%)
Ancestries Reported - Arab (%)
Ancestries Reported - Czech (%)
Ancestries Reported - Danish (%)
Ancestries Reported - Dutch (%)
Ancestries Reported - English (%)
Ancestries Reported - French (%)
Ancestries Reported - French Canadian (%)
Ancestries Reported - German (%)
Ancestries Reported - Greek (%)
Ancestries Reported - Hungarian (%)
Ancestries Reported - Irish (%)
Ancestries Reported - Italian (%)
Ancestries Reported - Lithuanian (%)
Ancestries Reported - Norwegian (%)
Ancestries Reported - Polish (%)
Ancestries Reported - Portuguese (%)
Ancestries Reported - Russian (%)
Ancestries Reported - Scotch-Irish (%)
Ancestries Reported - Scottish (%)
Ancestries Reported - Slovak (%)
Ancestries Reported - Subsaharan African (%)
Ancestries Reported - Swedish (%)
Ancestries Reported - Swiss (%)
Ancestries Reported - Ukrainian (%)
Ancestries Reported - United States (%)
Ancestries Reported - Welsh (%)
Ancestries Reported - West Indian (%)
Ancestries Reported - Other (%)
Geographical mobility - Same house 1 year ago (%)
Geographical mobility - Same house 1 year ago (%) - White
Geographical mobility - Same house 1 year ago (%) - Black or African American
Geographical mobility - Same house 1 year ago (%) - Asian
Geographical mobility - Same house 1 year ago (%) - Hispanic or Latino
Geographical mobility - Same house 1 year ago (%) - American Indian and Alaska Native
Geographical mobility - Same house 1 year ago (%) - Multirace
Geographical mobility - Same house 1 year ago (%) - Other Race
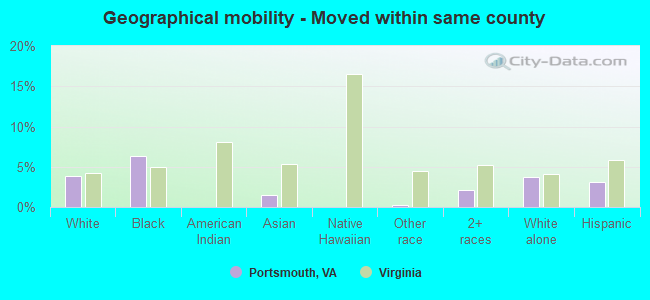
Geographical mobility - Moved within same county (%)
Geographical mobility - Moved within same county (%) - White
Geographical mobility - Moved within same county (%) - Black or African American
Geographical mobility - Moved within same county (%) - Asian
Geographical mobility - Moved within same county (%) - Hispanic or Latino
Geographical mobility - Moved within same county (%) - American Indian and Alaska Native
Geographical mobility - Moved within same county (%) - Multirace
Geographical mobility - Moved within same county (%) - Other Race
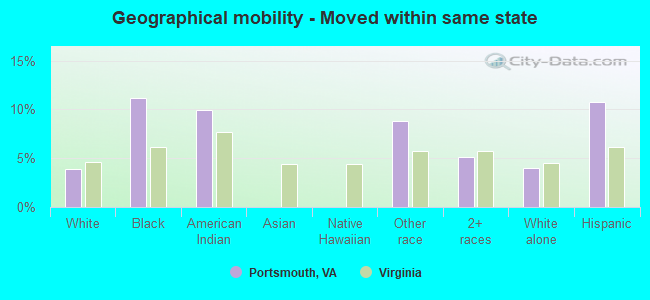
Geographical mobility - Moved from different county within same state (%)
Geographical mobility - Moved from different county within same state (%) - White
Geographical mobility - Moved from different county within same state (%) - Black or African American
Geographical mobility - Moved from different county within same state (%) - Asian
Geographical mobility - Moved from different county within same state (%) - Hispanic or Latino
Geographical mobility - Moved from different county within same state (%) - American Indian and Alaska Native
Geographical mobility - Moved from different county within same state (%) - Multirace
Geographical mobility - Moved from different county within same state (%) - Other Race
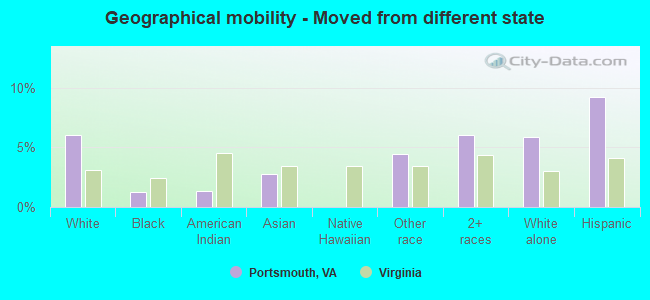
Geographical mobility - Moved from different state (%)
Geographical mobility - Moved from different state (%) - White
Geographical mobility - Moved from different state (%) - Black or African American
Geographical mobility - Moved from different state (%) - Asian
Geographical mobility - Moved from different state (%) - Hispanic or Latino
Geographical mobility - Moved from different state (%) - American Indian and Alaska Native
Geographical mobility - Moved from different state (%) - Multirace
Geographical mobility - Moved from different state (%) - Other Race
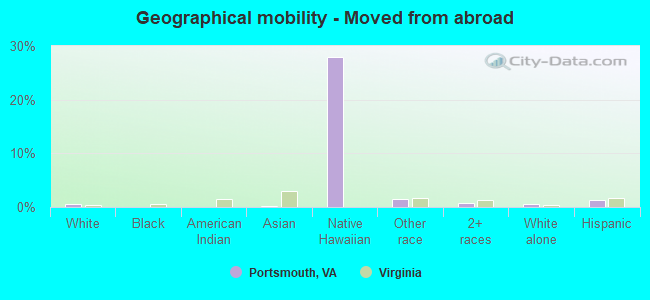
Geographical mobility - Moved from abroad (%)
Geographical mobility - Moved from abroad (%) - White
Geographical mobility - Moved from abroad (%) - Black or African American
Geographical mobility - Moved from abroad (%) - Asian
Geographical mobility - Moved from abroad (%) - Hispanic or Latino
Geographical mobility - Moved from abroad (%) - American Indian and Alaska Native
Geographical mobility - Moved from abroad (%) - Multirace
Geographical mobility - Moved from abroad (%) - Other Race
Place of birth for the foreign-born population - Ireland (%)
Place of birth for the foreign-born population - Denmark (%)
Place of birth for the foreign-born population - Norway (%)
Place of birth for the foreign-born population - Sweden (%)
Place of birth for the foreign-born population - United Kingdom (%)
Place of birth for the foreign-born population - England (%)
Place of birth for the foreign-born population - Scotland (%)
Place of birth for the foreign-born population - Other Northern Europe (%)
Place of birth for the foreign-born population - Austria (%)
Place of birth for the foreign-born population - Belgium (%)
Place of birth for the foreign-born population - France (%)
Place of birth for the foreign-born population - Germany (%)
Place of birth for the foreign-born population - Netherlands (%)
Place of birth for the foreign-born population - Switzerland (%)
Place of birth for the foreign-born population - Other Western Europe (%)
Place of birth for the foreign-born population - Greece (%)
Place of birth for the foreign-born population - Italy (%)
Place of birth for the foreign-born population - Portugal (%)
Place of birth for the foreign-born population - Spain (%)
Place of birth for the foreign-born population - Other Southern Europe (%)
Place of birth for the foreign-born population - Albania (%)
Place of birth for the foreign-born population - Belarus (%)
Place of birth for the foreign-born population - Bosnia and Herzegovina (%)
Place of birth for the foreign-born population - Bulgaria (%)
Place of birth for the foreign-born population - Croatia (%)
Place of birth for the foreign-born population - Czechoslovakia (%)
Place of birth for the foreign-born population - Hungary (%)
Place of birth for the foreign-born population - Latvia (%)
Place of birth for the foreign-born population - Lithuania (%)
Place of birth for the foreign-born population - North Macedonia (Macedonia) (%)
Place of birth for the foreign-born population - Moldova (%)
Place of birth for the foreign-born population - Poland (%)
Place of birth for the foreign-born population - Romania (%)
Place of birth for the foreign-born population - Russia (%)
Place of birth for the foreign-born population - Serbia (%)
Place of birth for the foreign-born population - Ukraine (%)
Place of birth for the foreign-born population - Other Eastern Europe (%)
Place of birth for the foreign-born population - China (%)
Place of birth for the foreign-born population - Hong Kong (%)
Place of birth for the foreign-born population - Taiwan (%)
Place of birth for the foreign-born population - Japan (%)
Place of birth for the foreign-born population - Korea (%)
Place of birth for the foreign-born population - Other Eastern Asia (%)
Place of birth for the foreign-born population - Afghanistan (%)
Place of birth for the foreign-born population - Bangladesh (%)
Place of birth for the foreign-born population - India (%)
Place of birth for the foreign-born population - Iran (%)
Place of birth for the foreign-born population - Kazakhstan (%)
Place of birth for the foreign-born population - Nepal (%)
Place of birth for the foreign-born population - Pakistan (%)
Place of birth for the foreign-born population - Sri Lanka (%)
Place of birth for the foreign-born population - Uzbekistan (%)
Place of birth for the foreign-born population - Other South Central Asia (%)
Place of birth for the foreign-born population - Burma (%)
Place of birth for the foreign-born population - Cambodia (%)
Place of birth for the foreign-born population - Indonesia (%)
Place of birth for the foreign-born population - Laos (%)
Place of birth for the foreign-born population - Malaysia (%)
Place of birth for the foreign-born population - Philippines (%)
Place of birth for the foreign-born population - Singapore (%)
Place of birth for the foreign-born population - Thailand (%)
Place of birth for the foreign-born population - Vietnam (%)
Place of birth for the foreign-born population - Other South Eastern Asia (%)
Place of birth for the foreign-born population - Armenia (%)
Place of birth for the foreign-born population - Iraq (%)
Place of birth for the foreign-born population - Israel (%)
Place of birth for the foreign-born population - Jordan (%)
Place of birth for the foreign-born population - Kuwait (%)
Place of birth for the foreign-born population - Lebanon (%)
Place of birth for the foreign-born population - Saudi Arabia (%)
Place of birth for the foreign-born population - Syria (%)
Place of birth for the foreign-born population - Turkey (%)
Place of birth for the foreign-born population - Yemen (%)
Place of birth for the foreign-born population - Other Western Asia (%)
Place of birth for the foreign-born population - Eritrea (%)
Place of birth for the foreign-born population - Ethiopia (%)
Place of birth for the foreign-born population - Kenya (%)
Place of birth for the foreign-born population - Somalia (%)
Place of birth for the foreign-born population - Uganda (%)
Place of birth for the foreign-born population - Zimbabwe (%)
Place of birth for the foreign-born population - Other Eastern Africa (%)
Place of birth for the foreign-born population - Cameroon (%)
Place of birth for the foreign-born population - Congo (%)
Place of birth for the foreign-born population - Democratic Republic of Congo (Zaire) (%)
Place of birth for the foreign-born population - Other Middle Africa (%)
Place of birth for the foreign-born population - Egypt (%)
Place of birth for the foreign-born population - Morocco (%)
Place of birth for the foreign-born population - Sudan (%)
Place of birth for the foreign-born population - Other Northern Africa (%)
Place of birth for the foreign-born population - South Africa (%)
Place of birth for the foreign-born population - Other Southern Africa (%)
Place of birth for the foreign-born population - Cabo Verde (%)
Place of birth for the foreign-born population - Ghana (%)
Place of birth for the foreign-born population - Liberia (%)
Place of birth for the foreign-born population - Nigeria (%)
Place of birth for the foreign-born population - Senegal (%)
Place of birth for the foreign-born population - Sierra Leone (%)
Place of birth for the foreign-born population - Other Western Africa (%)
Place of birth for the foreign-born population - Australia (%)
Place of birth for the foreign-born population - New Zealand (%)
Place of birth for the foreign-born population - Fiji (%)
Place of birth for the foreign-born population - Micronesia (%)
Place of birth for the foreign-born population - Bahamas (%)
Place of birth for the foreign-born population - Barbados (%)
Place of birth for the foreign-born population - Cuba (%)
Place of birth for the foreign-born population - Dominica (%)
Place of birth for the foreign-born population - Dominican Republic (%)
Place of birth for the foreign-born population - Grenada (%)
Place of birth for the foreign-born population - Haiti (%)
Place of birth for the foreign-born population - Jamaica (%)
Place of birth for the foreign-born population - St. Vincent and the Grenadines (%)
Place of birth for the foreign-born population - Trinidad and Tobago (%)
Place of birth for the foreign-born population - West Indies (%)
Place of birth for the foreign-born population - Other Caribbean (%)
Place of birth for the foreign-born population - Belize (%)
Place of birth for the foreign-born population - Costa Rica (%)
Place of birth for the foreign-born population - El Salvador (%)
Place of birth for the foreign-born population - Guatemala (%)
Place of birth for the foreign-born population - Honduras (%)
Place of birth for the foreign-born population - Mexico (%)
Place of birth for the foreign-born population - Nicaragua (%)
Place of birth for the foreign-born population - Panama (%)
Place of birth for the foreign-born population - Other Central America (%)
Place of birth for the foreign-born population - Argentina (%)
Place of birth for the foreign-born population - Bolivia (%)
Place of birth for the foreign-born population - Brazil (%)
Place of birth for the foreign-born population - Chile (%)
Place of birth for the foreign-born population - Colombia (%)
Place of birth for the foreign-born population - Ecuador (%)
Place of birth for the foreign-born population - Guyana (%)
Place of birth for the foreign-born population - Peru (%)
Place of birth for the foreign-born population - Uruguay (%)
Place of birth for the foreign-born population - Venezuela (%)
Place of birth for the foreign-born population - Other South America (%)
Place of birth for the foreign-born population - Canada (%)
Place of birth for the foreign-born population - Other Northern America (%)
Place of birth for the foreign-born population - Other (%)
Latest news about races in Portsmouth, VA collected exclusively by city-data.com from local newspapers, TV, and radio stations
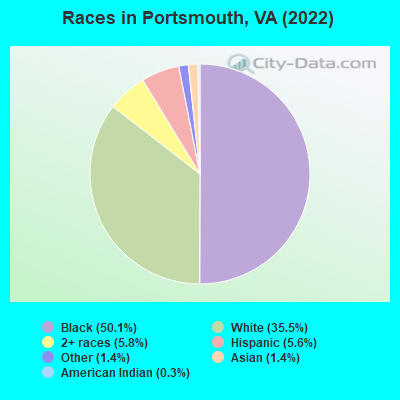
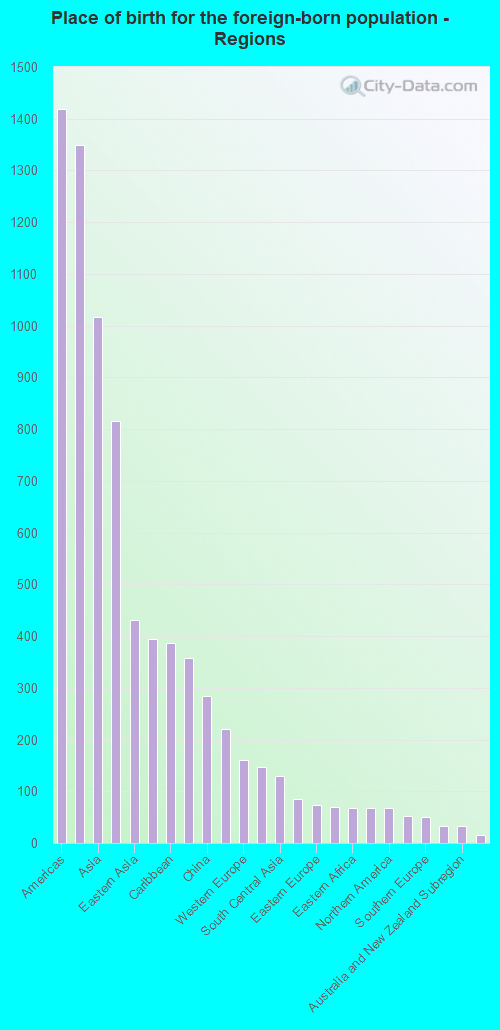
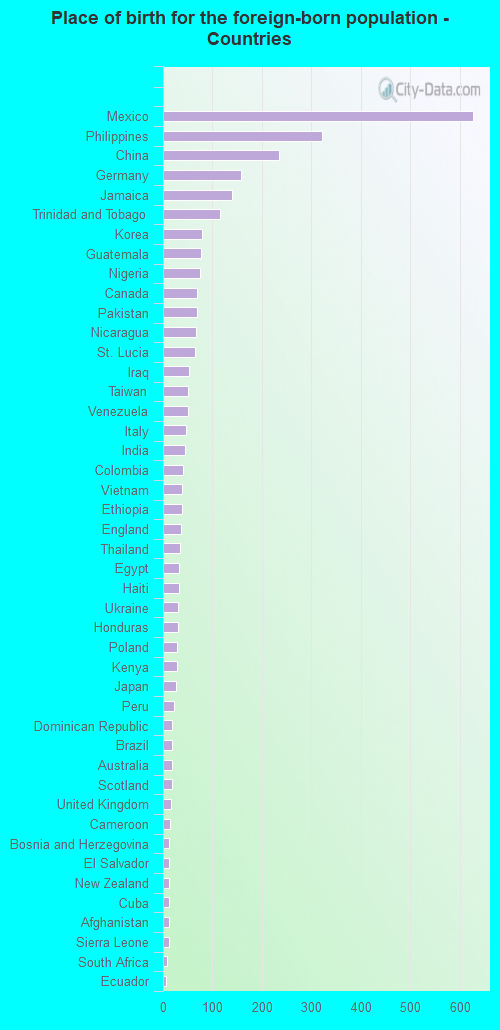
According to 2022 data, the most numerous races in Portsmouth, VA are White alone (34,413 residents), Black alone (48,618 residents), and Hispanic (5,388 residents). 95.6% of Portsmouth residents speak English at home. 3.2% of Portsmouth, VA residents are foreign-born (1.4% born in Latin America, 1.0% born in Asia, 0.4% born in Europe), which is 277.8% less than the foreign-born rate of 12.0% across the entire state of Virginia.
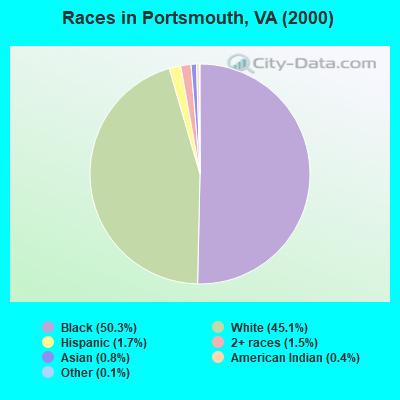
Race distribution in Portsmouth
2000 2022
50,569 50.3% Black alone 45,403 45.1% White alone 1,748 1.7% Hispanic 1,461 1.5% Two or more races 762 0.8% Asian alone 449 0.4% American Indian alone 113 0.1% Other race alone 60 0.06% Native Hawaiian and Other
48,618 50.1% Black alone 34,413 35.5% White alone 5,635 5.8% Two or more races 5,388 5.6% Hispanic 1,340 1.4% Asian alone 1,348 1.4% Other race alone 287 0.3% American Indian alone
2000 2022
4,965,637 70.2% White alone 1,376,378 19.4% Black alone 329,540 4.7% Hispanic 259,277 3.7% Asian alone 114,022 1.6% Two or more races 18,596 0.3% American Indian alone 11,685 0.2% Other race alone 3,380 0.05% Native Hawaiian and Other
5,095,130 58.7% White alone 1,594,785 18.4% Black alone 905,750 10.4% Hispanic 602,881 6.9% Asian alone 406,047 4.7% Two or more races 60,419 0.7% Other race alone 11,738 0.1% American Indian alone 6,869 0.08% Native Hawaiian and Other
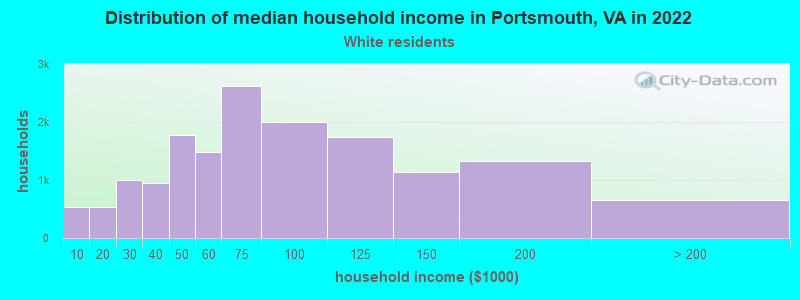
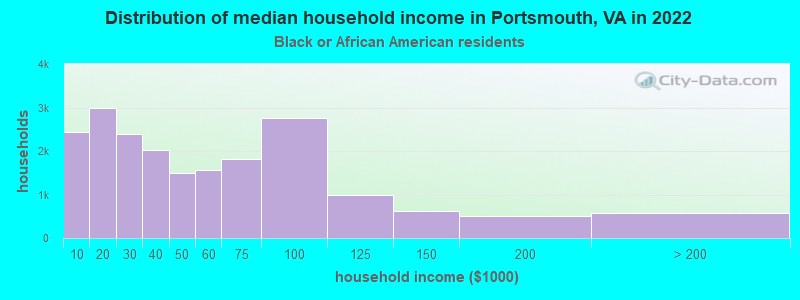
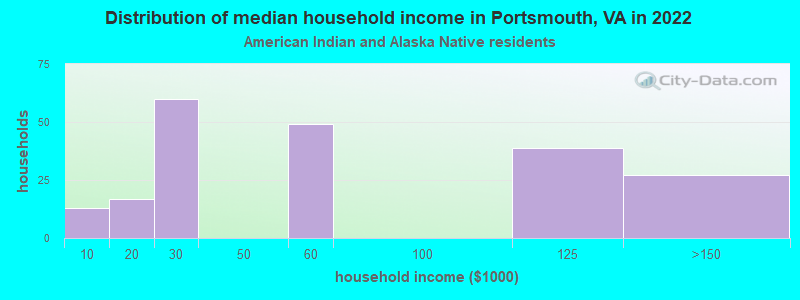
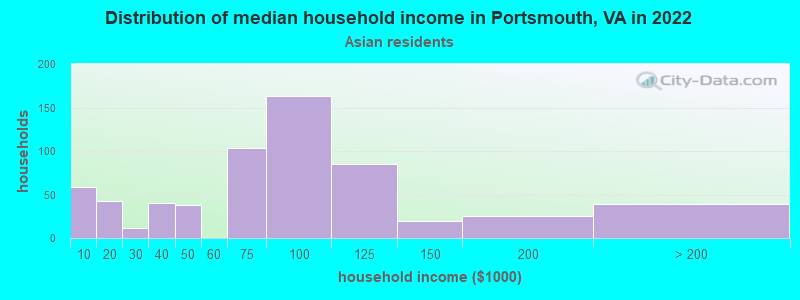
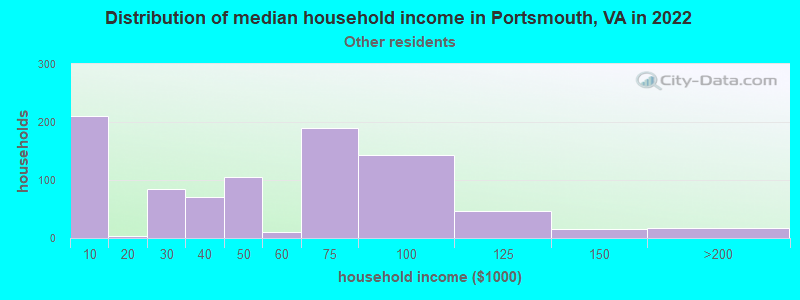
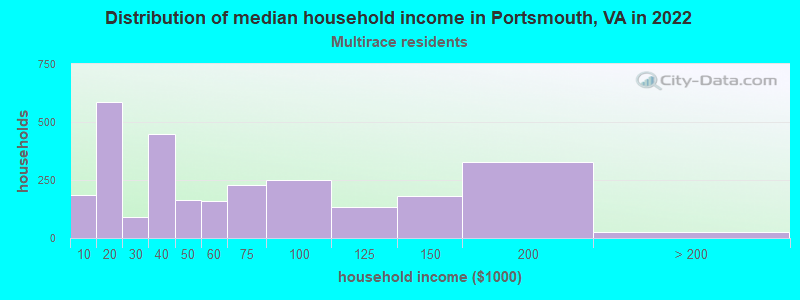
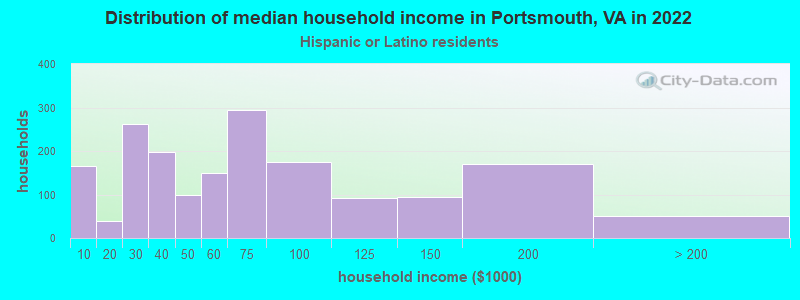
Income and house value in Portsmouth Median household income in 2022 $69,893 White non-Hispanic householders$40,672 Black householders$49,620 American Indian and Alaska Native householders$116,607 Asian householders$42,689 Some other race householders$48,811 Two or more races householders$57,732 Hispanic or Latino race householdersMedian 2022 house value $248,004 White Non-Hispanic householders$204,525 Black or African American householders$259,160 American Indian or Alaska Native householders $253,725 Asian householders$260,018 Native Hawaiian and other Pacific Islander householders$243,141 Some other race householders$228,839 Two or more races householders$252,009 Hispanic or Latino householders
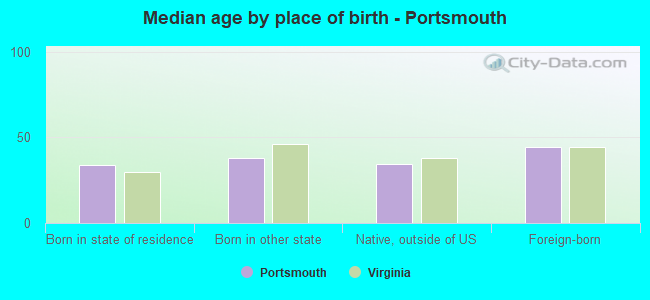
Median age by race in Portsmouth
38.7 Median age for White residents36.9 40.7 36.4 Median age for Black or African American residents31.8 40.4 24.3 Median age for American Indian / Alaska Native residents24.6 22.4 40.3 Median age for Asian residents37.2 43.7 -666,666,666.0 Median age for Native Hawaiian / Pacific Islander residents-666,666,666.0 -666,666,666.0 37.6 Median age for Other race residents56.0 30.9 18.3 Median age for Two or more races residents22.2 16.6 39.2 Median age for White alone residents37.7 40.8 24.4 Median age for Hispanic or Latino residents24.6 22.8
Owner/renter occupied households by race in Portsmouth
House owners and renters - White residents 11,630 73.8% Owner occupied4,134 26.2% Renter occupiedHouse owners and renters - Black or African American residents 9,797 48.6% Owner occupied10,354 51.4% Renter occupiedHouse owners and renters - American Indian / Alaska Native residents 130 64.4% Owner occupied72 35.6% Renter occupiedHouse owners and renters - Asian residents 500 79.2% Owner occupied132 20.8% Renter occupiedHouse owners and renters - Other race residents 383 23.8% Owner occupied1,227 76.2% Renter occupiedHouse owners and renters - Two or more races residents 1,177 67.7% Owner occupied562 32.3% Renter occupiedHouse owners and renters - White alone residents 11,117 72.9% Owner occupied4,134 27.1% Renter occupiedHouse owners and renters - Hispanic or Latino residents 1,362 67.0% Owner occupied670 33.0% Renter occupied
Language usage in Portsmouth
English speakers - Total 95.6% of residents of Portsmouth speak English at home.
1.8% of residents speak Spanish at home 1,288 78.1% Speak English very well361 21.9% Speak English less than very well2.6% of residents speak other language at home 1,908 82.5% Speak English very well405 17.5% Speak English less than very well
English speakers - Born in the United States 96.0% of residents of Portsmouth speak English at home.
1.5% of residents speak Spanish at home 432 100.0% Speak English very well2.6% of residents speak other language at home 720 94.9% Speak English very well39 5.1% Speak English less than very well
English speakers - Native, born elsewhere 47.9% of residents of Portsmouth speak English at home.
46.3% of residents speak Spanish at home 422 94.0% Speak English very well27 6.0% Speak English less than very well5.8% of residents speak other language at home 56 100.0% Speak English very well
English speakers - Foreign-born 26.7% of residents of Portsmouth speak English at home.
26.0% of residents speak Spanish at home 363 52.1% Speak English very well334 47.9% Speak English less than very well47.3% of residents speak other language at home 965 76.0% Speak English very well305 24.0% Speak English less than very well
White (Caucasian) - Speak only English Native:
98.5% (32,793)Foreign-born:
72.5% (224)
White (Caucasian) - Speak another language Native:
1.8% (610)Foreign-born:
37.6% (116)
Black or African American - Speak only English Native:
98.7% (44,962)Foreign-born:
60.2% (358)
Black or African American - Speak another language Native:
1.2% (550)Foreign-born:
33.8% (201)
American Indian / Alaska Native - Speak another language Native:
8.1% (22)Foreign-born:
100.0% (135)
Asian - Speak only English Native:
40.5% (362)Foreign-born:
23.1% (184)
Asian - Speak another language Native:
59.5% (532)Foreign-born:
76.9% (614)
Other race - Speak only English Native:
72.3% (1,201)Foreign-born:
4.0% (31)
Other race - Speak another language Native:
31.6% (525)Foreign-born:
95.2% (741)
Two or more races - Speak only English Native:
89.9% (6,299)Foreign-born:
33.8% (203)
Two or more races - Speak another language Native:
8.4% (589)Foreign-born:
64.8% (389)
White alone - Speak only English Native:
98.7% (32,286)Foreign-born:
68.1% (239)
White alone - Speak another language Native:
1.3% (423)Foreign-born:
28.5% (100)
Hispanic or Latino - Speak only English Native:
73.4% (2,270)Foreign-born:
20.5% (197)
Hispanic or Latino - Speak another language Native:
26.6% (824)Foreign-born:
79.5% (766)
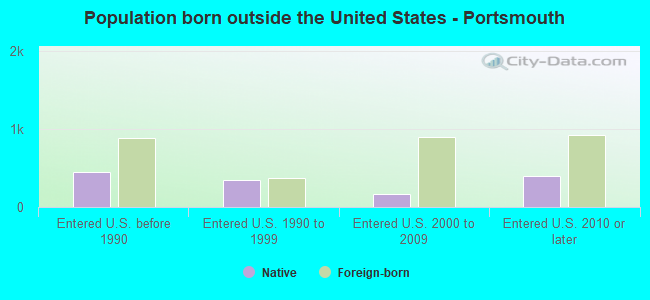
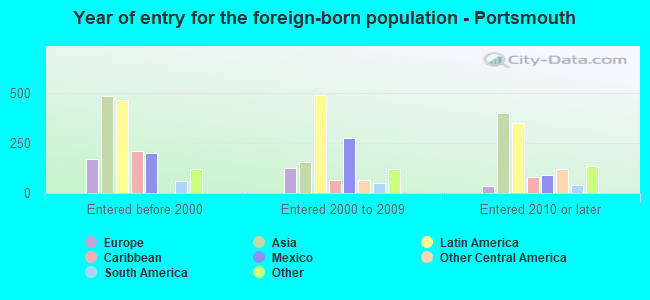
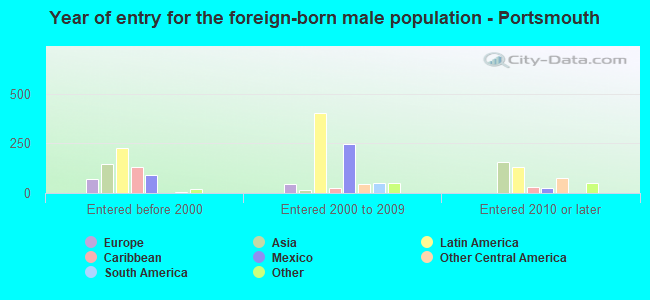
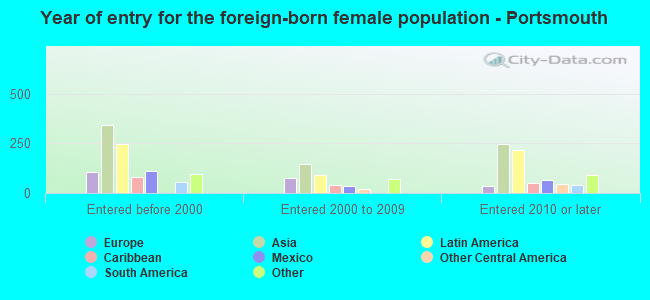
Foreign-born residents in Portsmouth 3,082 residents are foreign born (1.4% Latin America , 1.0% Asia , 0.4% Europe ).
This city:
3.2%Virginia:
12.6%
Marital status for residents in Portsmouth Marital status - White (Caucasian) population 15 years and over
Males 34.7% Never married51.0% Now married1.0% Separated1.5% Widowed11.8% DivorcedFemales 17.0% Never married53.0% Now married1.2% Separated13.3% Widowed15.6% DivorcedWomen who gave birth in the past 12 months Now married:
100.0% (485)Unmarried:
0.0% (0)
Women who did not give birth in the past 12 months Now married:
63.9% (4,393)Unmarried:
36.1% (2,479)
Marital status - Black or African American population 15 years and over
Males 51.9% Never married27.7% Now married3.5% Separated4.0% Widowed12.9% DivorcedFemales 49.8% Never married22.2% Now married3.8% Separated8.1% Widowed16.1% DivorcedWomen who gave birth in the past 12 months Now married:
23.9% (102)Unmarried:
76.1% (323)
Women who did not give birth in the past 12 months Now married:
23.9% (2,721)Unmarried:
76.1% (8,685)
Marital status - American Indian / Alaska Native population 15 years and over
Males 12.8% Never married71.8% Now married0.0% Separated0.0% Widowed15.4% DivorcedFemales 35.2% Never married52.1% Now married0.0% Separated12.7% Widowed0.0% DivorcedWomen who gave birth in the past 12 months Now married:
100.0% (47)Unmarried:
0.0% (0)
Women who did not give birth in the past 12 months Now married:
27.5% (20)Unmarried:
72.5% (53)
Marital status - Asian population 15 years and over
Males 29.5% Never married60.6% Now married0.0% Separated0.0% Widowed9.9% DivorcedFemales 36.1% Never married43.9% Now married0.8% Separated2.1% Widowed17.1% DivorcedWomen who gave birth in the past 12 months Now married:
0.0% (0)Unmarried:
100.0% (6)
Women who did not give birth in the past 12 months Now married:
37.0% (154)Unmarried:
63.0% (263)
Marital status - Other race population 15 years and over
Males 29.4% Never married56.3% Now married11.7% Separated2.6% Widowed0.0% DivorcedFemales 24.2% Never married66.0% Now married4.3% Separated3.8% Widowed1.8% DivorcedWomen who gave birth in the past 12 months Now married:
100.0% (17)Unmarried:
0.0% (0)
Women who did not give birth in the past 12 months Now married:
72.9% (516)Unmarried:
27.1% (192)
Marital status - Two or more races population 15 years and over
Males 55.1% Never married37.7% Now married2.3% Separated1.3% Widowed3.6% DivorcedFemales 28.3% Never married44.4% Now married2.8% Separated10.3% Widowed14.2% DivorcedWomen who gave birth in the past 12 months Now married:
100.0% (953)Unmarried:
0.0% (0)
Women who did not give birth in the past 12 months Now married:
48.5% (458)Unmarried:
51.5% (486)
Marital status - White alone, not Hispanic / Latino population 15 years and over
Males 35.3% Never married49.9% Now married1.1% Separated1.5% Widowed12.3% DivorcedFemales 17.0% Never married52.8% Now married1.2% Separated13.4% Widowed15.6% DivorcedWomen who gave birth in the past 12 months Now married:
100.0% (485)Unmarried:
0.0% (0)
Women who did not give birth in the past 12 months Now married:
63.5% (4,314)Unmarried:
36.5% (2,479)
Marital status - Hispanic or Latino population 15 years and over
Males 34.4% Never married49.2% Now married5.5% Separated1.7% Widowed9.2% DivorcedFemales 21.0% Never married62.1% Now married2.4% Separated4.7% Widowed9.9% DivorcedWomen who gave birth in the past 12 months Now married:
100.0% (209)Unmarried:
0.0% (0)
Women who did not give birth in the past 12 months Now married:
67.9% (750)Unmarried:
32.1% (356)
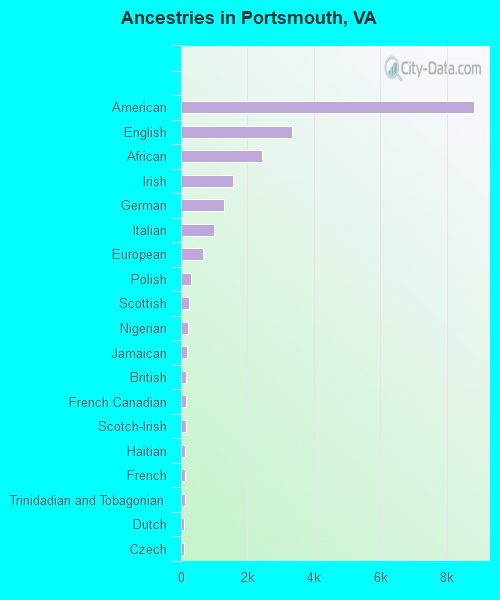
Ancestries in Portsmouth
8,837 15.0% American3,342 5.7% English2,440 4.2% African1,573 2.7% Irish1,283 2.2% German995 1.7% Italian671 1.1% European290 0.5% Polish237 0.4% Scottish201 0.3% Nigerian167 0.3% Jamaican153 0.3% British150 0.3% French Canadian141 0.2% Scotch-Irish122 0.2% Haitian113 0.2% French109 0.2% Trinidadian and Tobagonian92 0.2% Dutch82 0.1% Czech76 0.1% Iraqi57 0.10% Romanian56 0.10% Ukrainian50 0.09% Portuguese49 0.08% Greek48 0.08% Welsh45 0.08% Hungarian41 0.07% British West Indian37 0.06% Swedish34 0.06% Canadian32 0.05% Norwegian31 0.05% U.S. Virgin Islander30 0.05% Eastern European29 0.05% Russian26 0.04% Egyptian22 0.04% Austrian19 0.03% Slovak18 0.03% Armenian14 0.02% Afghan13 0.02% New Zealander13 0.02% Danish13 0.02% Scandinavian11 0.02% Swiss11 0.02% West Indian10 0.02% Finnish10 0.02% Palestinian7 0.01% Brazilian6 0.01% Croatian6 0.01% Cajun6 0.01% Australian5 0.01% Northern European4 0.01% Slavic4 0.01% Moroccan3 0.01% Ugandan
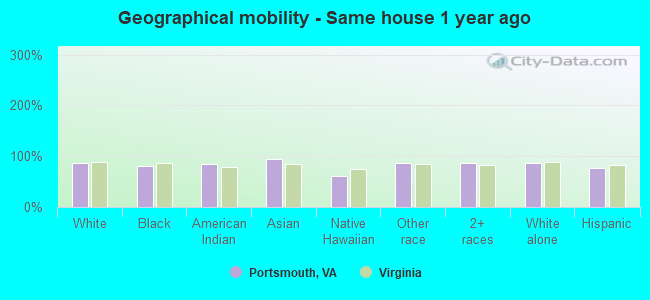
Geographical mobility in Portsmouth Same house 1 year ago 29,728 85.7% White (Caucasian)40,158 81.3% Black or African American368 84.5% American Indian / Alaska Native1,308 94.5% Asian48 61.5% Native Hawaiian / Pacific Islander2,173 86.8% Other race7,685 85.9% Two or more races29,233 85.9% White alone, not Hispanic / Latino3,781 76.2% Hispanic or LatinoMoved within same county 1,336 3.9% White / Caucasian3,105 6.3% Black or African American20 1.5% Asian7 0.3% Other race194 2.2% Two or more races1,281 3.8% White alone, not Hispanic / Latino151 3.0% Hispanic or LatinoMoved within same state 1,344 3.9% White / Caucasian5,494 11.1% Black or African American43 10.0% American Indian / Alaska Native220 8.8% Other race461 5.2% Two or more races1,344 4.0% White alone, not Hispanic / Latino535 10.8% Hispanic or LatinoMoved from different state 2,088 6.0% White / Caucasian639 1.3% Black or African American6 1.4% American Indian / Alaska Native39 2.8% Asian110 4.4% Other race539 6.0% Two or more races1,983 5.8% White alone, not Hispanic / Latino456 9.2% Hispanic or LatinoMoved from abroad 184 0.5% White1 0.1% Asian22 28.0% Native Hawaiian / Pacific Islander35 1.4% Other race72 0.8% Two or more races184 0.5% White alone, not Hispanic / Latino61 1.2% Hispanic or Latino
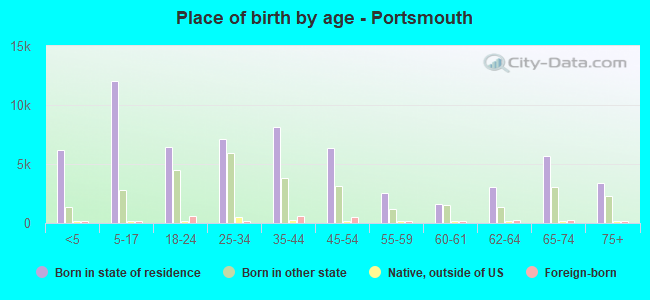
Children Nativity (place of birth) in Portsmouth
Children under 6 years - Living with two parents Both parents native 3,329 100.0% Native1 0.0% Foreign-bornBoth parents foreign-born 161 100.0% NativeOne native, one foreign-born parent 146 96.1% Native6 3.9% Foreign-bornChildren under 6 years - Living with one parent Native parent 3,664 99.7% Native9 0.3% Foreign-bornForeign-born parent 67 91.8% Native6 8.2% Foreign-bornChildren 6 to 17 years - Living with two parents Both parents native 4,752 99.9% Native3 0.1% Foreign-bornBoth parents foreign-born 102 77.2% Native30 22.8% Foreign-bornOne native, one foreign-born parent 186 89.3% Native22 10.7% Foreign-bornChildren 6 to 17 years - Living with one parent Native parent 6,903 100.0% NativeForeign-born parent 330 49.9% Native331 50.1% Foreign-born
Grandparents responsible for own grandchildren in Portsmouth
Grandparents (30 to 59 years) White / Caucasian 64 43.9% Responsible for grandchildren82 56.1% Not responsible for grandchildrenBlack or African American 390 75.1% Responsible for grandchildren129 24.9% Not responsible for grandchildrenTwo or more races 11 100.0% Not responsible for grandchildrenWhite alone, not Hispanic / Latino 65 41.7% Responsible for grandchildren91 58.3% Not responsible for grandchildrenHispanic or Latino 8 100.0% Not responsible for grandchildrenGrandparents (60 years and over) White / Caucasian 152 66.9% Responsible for grandchildren75 33.1% Not responsible for grandchildrenBlack or African American 528 53.4% Responsible for grandchildren461 46.6% Not responsible for grandchildrenWhite alone, not Hispanic / Latino 155 66.0% Responsible for grandchildren80 34.0% Not responsible for grandchildrenHispanic or Latino 12 100.0% Responsible for grandchildren