Races in Portland, Tennessee (TN) Detailed Stats
Ancestries, Foreign-born residents, place of birth
Settings
X


Recent posts about races in Portland, Tennessee on our local forum with over 2,400,000 registered users:
 | A Portland hippie to Murfreesboro? (52 replies) |
| Best place to live in Tennessee (17 replies) |
| Murfreesboro vs Hendersonville for retirement (15 replies) |
| Looking to Move Northern (country) Nashville (5 replies) |
| Is Tennessee extreme conservative and/or racist? (59 replies) |
| Can I Be Accepted In Nashville? How Far Out Of Metro Do you Need To Go For Affordability? (70 replies) |
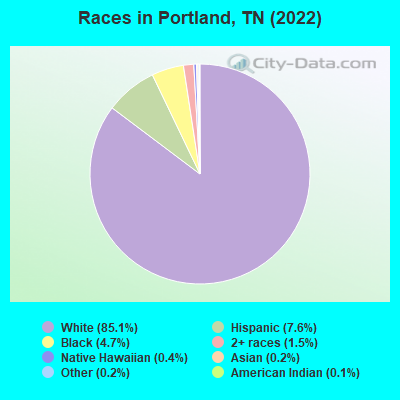
According to 2022 data, the most numerous races in Portland, TN are White alone (11,615 residents), Black alone (646 residents), and Hispanic (1,039 residents). 93.2% of Portland residents speak English at home. 3.5% of Portland, TN residents are foreign-born (2.9% born in Latin America, 0.4% born in Asia), which is 44.9% less than the foreign-born rate of 5.0% across the entire state of Tennessee.
Race distribution in Portland
2000
2022

- 7,92993.7%White alone
- 2232.6%Black alone
- 1942.3%Hispanic
- 630.7%Two or more races
- 240.3%American Indian alone
- 160.2%Asian alone
- 90.1%Other race alone

-
- 11,61585.1%White alone
- 1,0397.6%Hispanic
- 6464.7%Black alone
- 2001.5%Two or more races
- 550.4%Native Hawaiian and Other
Pacific Islander alone - 340.2%Asian alone
- 230.2%Other race alone
- 140.1%American Indian alone
2000
2022
-
- 4,505,93079.2%White alone
- 928,20416.3%Black alone
- 123,8382.2%Hispanic
- 54,8241.0%Two or more races
- 56,0771.0%Asian alone
- 13,8200.2%American Indian alone
- 4,7800.08%Other race alone
- 1,8100.03%Native Hawaiian and Other
Pacific Islander alone

-
- 5,070,02671.9%White alone
- 1,089,73815.5%Black alone
- 442,6296.3%Hispanic
- 279,3814.0%Two or more races
- 131,8171.9%Asian alone
- 26,9720.4%Other race alone
- 6,3870.09%American Indian alone
- 4,3890.06%Native Hawaiian and Other
Pacific Islander alone

Income and house value in Portland
- Median household income in 2022
- $77,545White non-Hispanic householders
- $95,301Black householders
- $44,751American Indian and Alaska Native householders
- $46,586Some other race householders
- $70,429Two or more races householders
- $57,037Hispanic or Latino race householders
- Median 2022 house value
- $271,018White Non-Hispanic householders
- $214,212Black or African American householders
- $269,749Some other race householders
- $174,543Two or more races householders
- $228,493Hispanic or Latino householders
Household income for White non-Hispanic householders

Household income for Black householders

Household income for American Indian and Alaska Native householders

Household income for Asian householders

Household income for Some other race householders

Household income for Two or more races householders

Household income for Hispanic or Latino race householders

Median age by race in Portland
- 34.6Median age for White residents
- 33.6Males
- 37.0Females
- 38.6Median age for Black or African American residents
- 33.3Males
- 40.2Females
- 57.8Median age for American Indian / Alaska Native residents
- -633,911,367.4Males
- 88.2Females
- 45.0Median age for Asian residents
- -623,229,461.1Males
- 49.6Females
- -885,813,147.9Median age for Native Hawaiian / Pacific Islander residents
- -951,707,890.7Males
- -735,930,735.2Females
- 23.9Median age for Other race residents
- 21.3Males
- 37.9Females
- 34.9Median age for Two or more races residents
- 48.1Males
- 29.5Females
- 34.7Median age for White alone residents
- 33.4Males
- 36.9Females
- 26.1Median age for Hispanic or Latino residents
- 25.1Males
- 44.9Females
Owner/renter occupied households by race in Portland
- House owners and renters - White residents
- 3,03165.4%Owner occupied
- 1,60634.6%Renter occupied
- House owners and renters - Black or African American residents
- 6930.2%Owner occupied
- 16069.8%Renter occupied
- House owners and renters - American Indian / Alaska Native residents
- 414.3%Owner occupied
- 2585.7%Renter occupied
- House owners and renters - Asian residents
- 18100.0%Renter occupied
- House owners and renters - Native Hawaiian / Pacific Islander residents
- 57100.0%Owner occupied
- House owners and renters - Other race residents
- 6421.4%Owner occupied
- 23578.6%Renter occupied
- House owners and renters - Two or more races residents
- 11775.3%Owner occupied
- 3824.7%Renter occupied
- House owners and renters - White alone residents
- 3,03166.1%Owner occupied
- 1,55133.9%Renter occupied
- House owners and renters - Hispanic or Latino residents
- 12731.5%Owner occupied
- 27768.5%Renter occupied
Language usage in Portland
- English speakers - Total
- 93.2% of residents of Portland speak English at home.
- 7.0% of residents speak Spanish at home
- 62370.7%Speak English very well
- 25829.3%Speak English less than very well
- 0.6% of residents speak other language at home
- 5168.9%Speak English very well
- 2331.1%Speak English less than very well
- English speakers - Born in the United States
- 96.3% of residents of Portland speak English at home.
- 4.2% of residents speak Spanish at home
- 209100.0%Speak English very well
- English speakers - Native, born elsewhere
- 47.3% of residents of Portland speak English at home.
- 74.2% of residents speak Spanish at home
- 190100.0%Speak English less than very well
- English speakers - Foreign-born
- 9.4% of residents of Portland speak English at home.
- 71.2% of residents speak Spanish at home
- 17556.3%Speak English very well
- 13643.7%Speak English less than very well
- 16.2% of residents speak other language at home
- 5476.1%Speak English very well
- 1723.9%Speak English less than very well
White (Caucasian) - Speak only English
| Native: | 97.9% (10,731) |
| Foreign-born: | 38.9% (34) |
White (Caucasian) - Speak another language
| Native: | 2.2% (240) |
| Foreign-born: | 54.0% (47) |
Other race - Speak another language
| Native: | 55.4% (265) |
| Foreign-born: | 100.0% (156) |
White alone - Speak only English
| Native: | 98.8% (10,676) |
| Foreign-born: | 58.0% (13) |
White alone - Speak another language
| Native: | 1.1% (124) |
| Foreign-born: | 42.8% (9) |
Hispanic or Latino - Speak only English
| Native: | 44.3% (307) |
| Foreign-born: | 7.4% (23) |
Hispanic or Latino - Speak another language
| Native: | 57.5% (398) |
| Foreign-born: | 99.1% (312) |
Foreign-born residents in Portland
471 residents are foreign born (2.9% Latin America, 0.4% Asia).
| This city: | 3.5% |
| Tennessee: | 5.4% |


Marital status for residents in Portland
Marital status - White (Caucasian) population 15 years and over
- Males
- 35.2%Never married
- 47.9%Now married
- 2.3%Separated
- 2.8%Widowed
- 11.7%Divorced
- Females
- 25.9%Never married
- 48.3%Now married
- 3.8%Separated
- 6.6%Widowed
- 15.4%Divorced
Women who gave birth in the past 12 months
| Now married: | 75.8% (100) |
| Unmarried: | 24.2% (32) |
Women who did not give birth in the past 12 months
| Now married: | 50.8% (1,494) |
| Unmarried: | 49.2% (1,446) |
Marital status - Black or African American population 15 years and over
- Males
- 19.4%Never married
- 64.4%Now married
- 11.2%Separated
- 0.0%Widowed
- 5.0%Divorced
- Females
- 21.4%Never married
- 39.5%Now married
- 0.0%Separated
- 11.1%Widowed
- 28.0%Divorced
Women who did not give birth in the past 12 months
| Now married: | 44.9% (104) |
| Unmarried: | 55.1% (128) |
Marital status - Asian population 15 years and over
- Males
- 0.0%Never married
- 100.0%Now married
- 0.0%Separated
- 0.0%Widowed
- 0.0%Divorced
- Females
- 0.0%Never married
- 60.0%Now married
- 0.0%Separated
- 0.0%Widowed
- 40.0%Divorced
Women who did not give birth in the past 12 months
| Now married: | 100.0% (18) |
| Unmarried: | 0.0% (0) |
Marital status - Other race population 15 years and over
- Males
- 77.6%Never married
- 22.4%Now married
- 0.0%Separated
- 0.0%Widowed
- 0.0%Divorced
- Females
- 37.6%Never married
- 62.4%Now married
- 0.0%Separated
- 0.0%Widowed
- 0.0%Divorced
Women who did not give birth in the past 12 months
| Now married: | 43.8% (63) |
| Unmarried: | 56.2% (81) |
Marital status - Two or more races population 15 years and over
- Males
- 24.8%Never married
- 56.2%Now married
- 0.0%Separated
- 7.6%Widowed
- 11.4%Divorced
- Females
- 52.9%Never married
- 6.7%Now married
- 0.0%Separated
- 23.1%Widowed
- 17.3%Divorced
Women who gave birth in the past 12 months
| Now married: | 0.0% (0) |
| Unmarried: | 100.0% (15) |
Women who did not give birth in the past 12 months
| Now married: | 4.7% (4) |
| Unmarried: | 95.3% (83) |
Marital status - White alone, not Hispanic / Latino population 15 years and over
- Males
- 35.5%Never married
- 48.1%Now married
- 1.6%Separated
- 2.8%Widowed
- 12.1%Divorced
- Females
- 26.1%Never married
- 47.9%Now married
- 3.9%Separated
- 6.6%Widowed
- 15.5%Divorced
Women who gave birth in the past 12 months
| Now married: | 75.8% (101) |
| Unmarried: | 24.2% (32) |
Women who did not give birth in the past 12 months
| Now married: | 50.1% (1,470) |
| Unmarried: | 49.9% (1,462) |
Marital status - Hispanic or Latino population 15 years and over
- Males
- 56.2%Never married
- 36.0%Now married
- 7.8%Separated
- 0.0%Widowed
- 0.0%Divorced
- Females
- 30.8%Never married
- 69.2%Now married
- 0.0%Separated
- 0.0%Widowed
- 0.0%Divorced
Women who did not give birth in the past 12 months
| Now married: | 57.8% (107) |
| Unmarried: | 42.2% (78) |
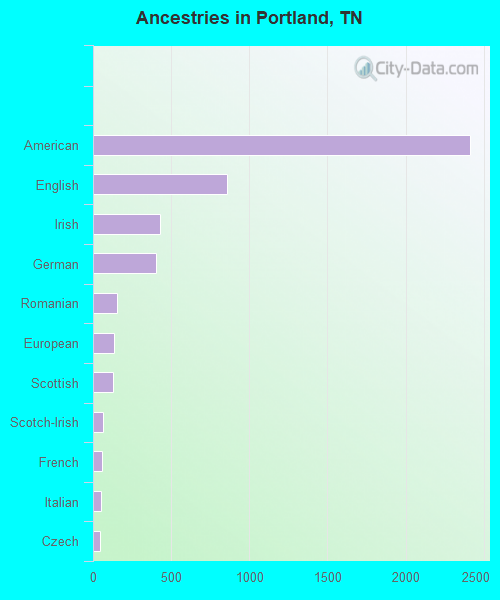
Ancestries in Portland

- 2,41335.5%American
- 85512.6%English
- 4276.3%Irish
- 4045.9%German
- 1532.2%Romanian
- 1352.0%European
- 1271.9%Scottish
- 661.0%Scotch-Irish
- 580.9%French
- 490.7%Italian
- 420.6%Czech
- 190.3%Polish
- 160.2%French Canadian
- 150.2%Norwegian
- 150.2%Welsh
- 120.2%Austrian
- 100.1%British
- 100.1%Danish
- 40.06%Ukrainian
- 30.04%Eastern European
- 30.04%Iranian
Geographical mobility in Portland

- Same house 1 year ago
- 10,15787.0%White (Caucasian)
- 54181.1%Black or African American
- 31100.0%American Indian / Alaska Native
- 3997.3%Asian
- 35100.0%Native Hawaiian / Pacific Islander
- 20932.2%Other race
- 26890.3%Two or more races
- 9,94386.8%White alone, not Hispanic / Latino
- 63463.4%Hispanic or Latino

-
- Moved within same county
- 9708.3%White / Caucasian
- 7210.8%Black or African American
- 26.1%American Indian / Alaska Native
- 25238.7%Other race
- 3110.6%Two or more races
- 9828.6%White alone, not Hispanic / Latino
- 14014.0%Hispanic or Latino

-
- Moved within same state
- 3613.1%White / Caucasian
- 142.0%Black or African American
- 10916.8%Other race
- 31.0%Two or more races
- 3613.2%White alone, not Hispanic / Latino
- 10110.1%Hispanic or Latino

-
- Moved from different state
- 2221.9%White / Caucasian
- 538.0%Black or African American
- 193.0%Other race
- 2111.8%White alone, not Hispanic / Latino
- 131.3%Hispanic or Latino

-
- Moved from abroad
- 240.2%White
- 220.2%White alone, not Hispanic / Latino

Children Nativity (place of birth) in Portland
Place of birth for residents in Portland
![Place of birth for the foreign-born population - Regions]()
- 402Americas
- 402Latin America
- 402Central America
- 54Asia
- 39Eastern Asia
- 14Europe
- 14Northern Europe
- 10South Eastern Asia
- 4South Central Asia

![Place of birth for the foreign-born population - Countries]()
- 233Guatemala
- 106Mexico
- 61Honduras
- 27Japan
- 14England
- 12Korea
- 10Philippines
- 4Iran

Grandparents responsible for own grandchildren in Portland
Zip codes: 37148.