Races in Port Lavaca, Texas (TX) Detailed Stats
Data:
Races - White alone (%)
Races - White alone (% change since 2000)
Races - Black alone (%)
Races - Black alone (% change since 2000)
Races - American Indian alone (%)
Races - American Indian alone (% change since 2000)
Races - Asian alone (%)
Races - Asian alone (% change since 2000)
Races - Hispanic (%)
Races - Hispanic (% change since 2000)
Races - Native Hawaiian and Other Pacific Islander alone (%)
Races - Native Hawaiian and Other Pacific Islander alone (% change since 2000)
Races - Two or more races(%)
Races - Two or more races(% change since 2000)
Races - Other race alone (%)
Races - Other race alone (% change since 2000)
Racial diversity
Place of birth - Born in state of residence (%)
Place of birth - Born in state of residence (%) - White
Place of birth - Born in state of residence (%) - Black or African American
Place of birth - Born in state of residence (%) - Asian
Place of birth - Born in state of residence (%) - Hispanic or Latino
Place of birth - Born in state of residence (%) - American Indian and Alaska Native
Place of birth - Born in state of residence (%) - Multirace
Place of birth - Born in state of residence (%) - Other Race
Place of birth - Born in other state (%)
Place of birth - Born in other state (%) - White
Place of birth - Born in other state (%) - Black or African American
Place of birth - Born in other state (%) - Asian
Place of birth - Born in other state (%) - Hispanic or Latino
Place of birth - Born in other state (%) - American Indian and Alaska Native
Place of birth - Born in other state (%) - Multirace
Place of birth - Born in other state (%) - Other Race
Place of birth - Native, outside of US (%)
Place of birth - Native, outside of US (%) - White
Place of birth - Native, outside of US (%) - Black or African American
Place of birth - Native, outside of US (%) - Asian
Place of birth - Native, outside of US (%) - Hispanic or Latino
Place of birth - Native, outside of US (%) - American Indian and Alaska Native
Place of birth - Native, outside of US (%) - Multirace
Place of birth - Native, outside of US (%) - Other Race
Place of birth - Foreign born (%)
Place of birth - Foreign born (%) - White
Place of birth - Foreign born (%) - Black or African American
Place of birth - Foreign born (%) - Asian
Place of birth - Foreign born (%) - Hispanic or Latino
Place of birth - Foreign born (%) - American Indian and Alaska Native
Place of birth - Foreign born (%) - Multirace
Place of birth - Foreign born (%) - Other Race
Residents speaking English at home (%)
Residents speaking English at home - Born in the United States (%)
Residents speaking English at home - Native, born elsewhere (%)
Residents speaking English at home - Foreign born (%)
Residents speaking Spanish at home (%)
Residents speaking Spanish at home - Born in the United States (%)
Residents speaking Spanish at home - Native, born elsewhere (%)
Residents speaking Spanish at home - Foreign born (%)
Residents speaking other language at home (%)
Residents speaking other language at home - Born in the United States (%)
Residents speaking other language at home - Native, born elsewhere (%)
Residents speaking other language at home - Foreign born (%)
Marital status - Never married (%)
Marital status - Now married (%)
Marital status - Separated (%)
Marital status - Widowed (%)
Marital status - Divorced (%)
Ancestries Reported - Arab (%)
Ancestries Reported - Czech (%)
Ancestries Reported - Danish (%)
Ancestries Reported - Dutch (%)
Ancestries Reported - English (%)
Ancestries Reported - French (%)
Ancestries Reported - French Canadian (%)
Ancestries Reported - German (%)
Ancestries Reported - Greek (%)
Ancestries Reported - Hungarian (%)
Ancestries Reported - Irish (%)
Ancestries Reported - Italian (%)
Ancestries Reported - Lithuanian (%)
Ancestries Reported - Norwegian (%)
Ancestries Reported - Polish (%)
Ancestries Reported - Portuguese (%)
Ancestries Reported - Russian (%)
Ancestries Reported - Scotch-Irish (%)
Ancestries Reported - Scottish (%)
Ancestries Reported - Slovak (%)
Ancestries Reported - Subsaharan African (%)
Ancestries Reported - Swedish (%)
Ancestries Reported - Swiss (%)
Ancestries Reported - Ukrainian (%)
Ancestries Reported - United States (%)
Ancestries Reported - Welsh (%)
Ancestries Reported - West Indian (%)
Ancestries Reported - Other (%)
Geographical mobility - Same house 1 year ago (%)
Geographical mobility - Same house 1 year ago (%) - White
Geographical mobility - Same house 1 year ago (%) - Black or African American
Geographical mobility - Same house 1 year ago (%) - Asian
Geographical mobility - Same house 1 year ago (%) - Hispanic or Latino
Geographical mobility - Same house 1 year ago (%) - American Indian and Alaska Native
Geographical mobility - Same house 1 year ago (%) - Multirace
Geographical mobility - Same house 1 year ago (%) - Other Race
Geographical mobility - Moved within same county (%)
Geographical mobility - Moved within same county (%) - White
Geographical mobility - Moved within same county (%) - Black or African American
Geographical mobility - Moved within same county (%) - Asian
Geographical mobility - Moved within same county (%) - Hispanic or Latino
Geographical mobility - Moved within same county (%) - American Indian and Alaska Native
Geographical mobility - Moved within same county (%) - Multirace
Geographical mobility - Moved within same county (%) - Other Race
Geographical mobility - Moved from different county within same state (%)
Geographical mobility - Moved from different county within same state (%) - White
Geographical mobility - Moved from different county within same state (%) - Black or African American
Geographical mobility - Moved from different county within same state (%) - Asian
Geographical mobility - Moved from different county within same state (%) - Hispanic or Latino
Geographical mobility - Moved from different county within same state (%) - American Indian and Alaska Native
Geographical mobility - Moved from different county within same state (%) - Multirace
Geographical mobility - Moved from different county within same state (%) - Other Race
Geographical mobility - Moved from different state (%)
Geographical mobility - Moved from different state (%) - White
Geographical mobility - Moved from different state (%) - Black or African American
Geographical mobility - Moved from different state (%) - Asian
Geographical mobility - Moved from different state (%) - Hispanic or Latino
Geographical mobility - Moved from different state (%) - American Indian and Alaska Native
Geographical mobility - Moved from different state (%) - Multirace
Geographical mobility - Moved from different state (%) - Other Race
Geographical mobility - Moved from abroad (%)
Geographical mobility - Moved from abroad (%) - White
Geographical mobility - Moved from abroad (%) - Black or African American
Geographical mobility - Moved from abroad (%) - Asian
Geographical mobility - Moved from abroad (%) - Hispanic or Latino
Geographical mobility - Moved from abroad (%) - American Indian and Alaska Native
Geographical mobility - Moved from abroad (%) - Multirace
Geographical mobility - Moved from abroad (%) - Other Race
Place of birth for the foreign-born population - Ireland (%)
Place of birth for the foreign-born population - Denmark (%)
Place of birth for the foreign-born population - Norway (%)
Place of birth for the foreign-born population - Sweden (%)
Place of birth for the foreign-born population - United Kingdom (%)
Place of birth for the foreign-born population - England (%)
Place of birth for the foreign-born population - Scotland (%)
Place of birth for the foreign-born population - Other Northern Europe (%)
Place of birth for the foreign-born population - Austria (%)
Place of birth for the foreign-born population - Belgium (%)
Place of birth for the foreign-born population - France (%)
Place of birth for the foreign-born population - Germany (%)
Place of birth for the foreign-born population - Netherlands (%)
Place of birth for the foreign-born population - Switzerland (%)
Place of birth for the foreign-born population - Other Western Europe (%)
Place of birth for the foreign-born population - Greece (%)
Place of birth for the foreign-born population - Italy (%)
Place of birth for the foreign-born population - Portugal (%)
Place of birth for the foreign-born population - Spain (%)
Place of birth for the foreign-born population - Other Southern Europe (%)
Place of birth for the foreign-born population - Albania (%)
Place of birth for the foreign-born population - Belarus (%)
Place of birth for the foreign-born population - Bosnia and Herzegovina (%)
Place of birth for the foreign-born population - Bulgaria (%)
Place of birth for the foreign-born population - Croatia (%)
Place of birth for the foreign-born population - Czechoslovakia (%)
Place of birth for the foreign-born population - Hungary (%)
Place of birth for the foreign-born population - Latvia (%)
Place of birth for the foreign-born population - Lithuania (%)
Place of birth for the foreign-born population - North Macedonia (Macedonia) (%)
Place of birth for the foreign-born population - Moldova (%)
Place of birth for the foreign-born population - Poland (%)
Place of birth for the foreign-born population - Romania (%)
Place of birth for the foreign-born population - Russia (%)
Place of birth for the foreign-born population - Serbia (%)
Place of birth for the foreign-born population - Ukraine (%)
Place of birth for the foreign-born population - Other Eastern Europe (%)
Place of birth for the foreign-born population - China (%)
Place of birth for the foreign-born population - Hong Kong (%)
Place of birth for the foreign-born population - Taiwan (%)
Place of birth for the foreign-born population - Japan (%)
Place of birth for the foreign-born population - Korea (%)
Place of birth for the foreign-born population - Other Eastern Asia (%)
Place of birth for the foreign-born population - Afghanistan (%)
Place of birth for the foreign-born population - Bangladesh (%)
Place of birth for the foreign-born population - India (%)
Place of birth for the foreign-born population - Iran (%)
Place of birth for the foreign-born population - Kazakhstan (%)
Place of birth for the foreign-born population - Nepal (%)
Place of birth for the foreign-born population - Pakistan (%)
Place of birth for the foreign-born population - Sri Lanka (%)
Place of birth for the foreign-born population - Uzbekistan (%)
Place of birth for the foreign-born population - Other South Central Asia (%)
Place of birth for the foreign-born population - Burma (%)
Place of birth for the foreign-born population - Cambodia (%)
Place of birth for the foreign-born population - Indonesia (%)
Place of birth for the foreign-born population - Laos (%)
Place of birth for the foreign-born population - Malaysia (%)
Place of birth for the foreign-born population - Philippines (%)
Place of birth for the foreign-born population - Singapore (%)
Place of birth for the foreign-born population - Thailand (%)
Place of birth for the foreign-born population - Vietnam (%)
Place of birth for the foreign-born population - Other South Eastern Asia (%)
Place of birth for the foreign-born population - Armenia (%)
Place of birth for the foreign-born population - Iraq (%)
Place of birth for the foreign-born population - Israel (%)
Place of birth for the foreign-born population - Jordan (%)
Place of birth for the foreign-born population - Kuwait (%)
Place of birth for the foreign-born population - Lebanon (%)
Place of birth for the foreign-born population - Saudi Arabia (%)
Place of birth for the foreign-born population - Syria (%)
Place of birth for the foreign-born population - Turkey (%)
Place of birth for the foreign-born population - Yemen (%)
Place of birth for the foreign-born population - Other Western Asia (%)
Place of birth for the foreign-born population - Eritrea (%)
Place of birth for the foreign-born population - Ethiopia (%)
Place of birth for the foreign-born population - Kenya (%)
Place of birth for the foreign-born population - Somalia (%)
Place of birth for the foreign-born population - Uganda (%)
Place of birth for the foreign-born population - Zimbabwe (%)
Place of birth for the foreign-born population - Other Eastern Africa (%)
Place of birth for the foreign-born population - Cameroon (%)
Place of birth for the foreign-born population - Congo (%)
Place of birth for the foreign-born population - Democratic Republic of Congo (Zaire) (%)
Place of birth for the foreign-born population - Other Middle Africa (%)
Place of birth for the foreign-born population - Egypt (%)
Place of birth for the foreign-born population - Morocco (%)
Place of birth for the foreign-born population - Sudan (%)
Place of birth for the foreign-born population - Other Northern Africa (%)
Place of birth for the foreign-born population - South Africa (%)
Place of birth for the foreign-born population - Other Southern Africa (%)
Place of birth for the foreign-born population - Cabo Verde (%)
Place of birth for the foreign-born population - Ghana (%)
Place of birth for the foreign-born population - Liberia (%)
Place of birth for the foreign-born population - Nigeria (%)
Place of birth for the foreign-born population - Senegal (%)
Place of birth for the foreign-born population - Sierra Leone (%)
Place of birth for the foreign-born population - Other Western Africa (%)
Place of birth for the foreign-born population - Australia (%)
Place of birth for the foreign-born population - New Zealand (%)
Place of birth for the foreign-born population - Fiji (%)
Place of birth for the foreign-born population - Micronesia (%)
Place of birth for the foreign-born population - Bahamas (%)
Place of birth for the foreign-born population - Barbados (%)
Place of birth for the foreign-born population - Cuba (%)
Place of birth for the foreign-born population - Dominica (%)
Place of birth for the foreign-born population - Dominican Republic (%)
Place of birth for the foreign-born population - Grenada (%)
Place of birth for the foreign-born population - Haiti (%)
Place of birth for the foreign-born population - Jamaica (%)
Place of birth for the foreign-born population - St. Vincent and the Grenadines (%)
Place of birth for the foreign-born population - Trinidad and Tobago (%)
Place of birth for the foreign-born population - West Indies (%)
Place of birth for the foreign-born population - Other Caribbean (%)
Place of birth for the foreign-born population - Belize (%)
Place of birth for the foreign-born population - Costa Rica (%)
Place of birth for the foreign-born population - El Salvador (%)
Place of birth for the foreign-born population - Guatemala (%)
Place of birth for the foreign-born population - Honduras (%)
Place of birth for the foreign-born population - Mexico (%)
Place of birth for the foreign-born population - Nicaragua (%)
Place of birth for the foreign-born population - Panama (%)
Place of birth for the foreign-born population - Other Central America (%)
Place of birth for the foreign-born population - Argentina (%)
Place of birth for the foreign-born population - Bolivia (%)
Place of birth for the foreign-born population - Brazil (%)
Place of birth for the foreign-born population - Chile (%)
Place of birth for the foreign-born population - Colombia (%)
Place of birth for the foreign-born population - Ecuador (%)
Place of birth for the foreign-born population - Guyana (%)
Place of birth for the foreign-born population - Peru (%)
Place of birth for the foreign-born population - Uruguay (%)
Place of birth for the foreign-born population - Venezuela (%)
Place of birth for the foreign-born population - Other South America (%)
Place of birth for the foreign-born population - Canada (%)
Place of birth for the foreign-born population - Other Northern America (%)
Place of birth for the foreign-born population - Other (%)
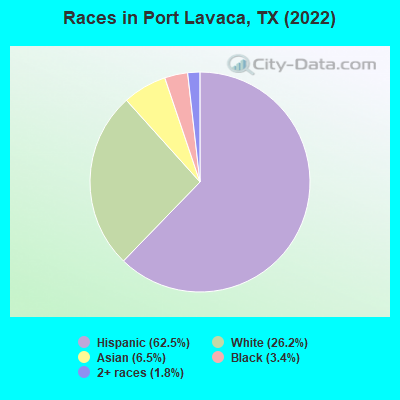
According to 2022 data, the most numerous races in Port Lavaca, TX are Hispanic (7,406 residents), White alone (3,102 residents), and Black alone (403 residents). 63.4% of Port Lavaca residents speak English at home. 13.6% of Port Lavaca, TX residents are foreign-born (7.9% born in Latin America, 5.2% born in Asia), which is 24.8% less than the foreign-born rate of 17.0% across the entire state of Texas.
Race distribution in Port Lavaca
2000 2022
10,933,313 52.4% White alone 6,669,666 32.0% Hispanic 2,364,255 11.3% Black alone 554,445 2.7% Asian alone 230,567 1.1% Two or more races 68,859 0.3% American Indian alone 19,958 0.10% Other race alone 10,757 0.05% Native Hawaiian and Other
12,070,642 40.2% Hispanic 11,683,430 38.9% White alone 3,508,706 11.7% Black alone 1,608,173 5.4% Asian alone 956,560 3.2% Two or more races 125,763 0.4% Other race alone 47,023 0.2% American Indian alone 29,275 0.10% Native Hawaiian and Other
Income and house value in Port Lavaca Median household income in 2022 $58,048 White non-Hispanic householders$147,112 Asian householders$87,498 Some other race householders$59,513 Two or more races householders$54,101 Hispanic or Latino race householdersMedian 2022 house value $173,141 White Non-Hispanic householders$105,605 Black or African American householders$58,669 American Indian or Alaska Native householders $242,762 Asian householders$101,955 Some other race householders$130,377 Two or more races householders$109,517 Hispanic or Latino householders
Median age by race in Port Lavaca
36.9 Median age for White residents36.2 39.3 38.1 Median age for Black or African American residents27.5 62.1 -684,418,145.3 Median age for American Indian / Alaska Native residents-682,445,758.7 -684,418,145.3 46.1 Median age for Asian residents51.3 37.5 -581,560,283.1 Median age for Native Hawaiian / Pacific Islander residents-612,729,233.5 -577,777,777.2 21.2 Median age for Other race residents25.0 17.6 38.1 Median age for Two or more races residents50.0 28.1 51.8 Median age for White alone residents51.9 51.3 27.8 Median age for Hispanic or Latino residents28.2 26.9
Owner/renter occupied households by race in Port Lavaca
House owners and renters - White residents 1,838 72.3% Owner occupied704 27.7% Renter occupiedHouse owners and renters - Black or African American residents 130 40.6% Owner occupied191 59.4% Renter occupiedHouse owners and renters - American Indian / Alaska Native residents 4 100.0% Owner occupiedHouse owners and renters - Asian residents 253 80.2% Owner occupied62 19.8% Renter occupiedHouse owners and renters - Other race residents 239 86.5% Owner occupied37 13.5% Renter occupiedHouse owners and renters - Two or more races residents 1,066 88.0% Owner occupied146 12.0% Renter occupiedHouse owners and renters - White alone residents 1,107 76.0% Owner occupied349 24.0% Renter occupiedHouse owners and renters - Hispanic or Latino residents 1,878 74.8% Owner occupied633 25.2% Renter occupied
Language usage in Port Lavaca
English speakers - Total 63.4% of residents of Port Lavaca speak English at home.
29.8% of residents speak Spanish at home 2,270 68.5% Speak English very well1,045 31.5% Speak English less than very well6.7% of residents speak other language at home 334 45.0% Speak English very well409 55.0% Speak English less than very well
English speakers - Born in the United States 87.0% of residents of Port Lavaca speak English at home.
7.8% of residents speak Spanish at home 63 98.4% Speak English very well1 1.6% Speak English less than very well5.3% of residents speak other language at home 44 100.0% Speak English very well
English speakers - Native, born elsewhere 91.1% of residents of Port Lavaca speak English at home.
7.3% of residents speak Spanish at home 9 100.0% Speak English less than very well
English speakers - Foreign-born 1.8% of residents of Port Lavaca speak English at home.
59.9% of residents speak Spanish at home 339 35.1% Speak English very well628 64.9% Speak English less than very well37.5% of residents speak other language at home 231 38.1% Speak English very well375 61.9% Speak English less than very well
White (Caucasian) - Speak another language Native:
13.7% (779)Foreign-born:
88.3% (247)
Asian - Speak only English Native:
40.0% (64)Foreign-born:
3.8% (24)
Asian - Speak another language Native:
59.8% (95)Foreign-born:
95.9% (613)
Other race - Speak another language Native:
65.4% (500)Foreign-born:
99.5% (107)
Two or more races - Speak only English Native:
67.8% (1,717)Foreign-born:
2.6% (10)
Two or more races - Speak another language Native:
29.2% (739)Foreign-born:
97.5% (361)
White alone - Speak another language Native:
7.5% (229)Foreign-born:
99.8% (33)
Hispanic or Latino - Speak only English Native:
63.8% (3,719)Foreign-born:
0.7% (7)
Hispanic or Latino - Speak another language Native:
36.9% (2,150)Foreign-born:
98.9% (948)
Foreign-born residents in Port Lavaca 1,615 residents are foreign born (7.9% Latin America , 5.2% Asia ).
This city:
13.6%Texas:
17.1%
Marital status for residents in Port Lavaca Marital status - White (Caucasian) population 15 years and over
Males 28.1% Never married59.7% Now married2.0% Separated2.0% Widowed8.3% DivorcedFemales 29.1% Never married43.0% Now married6.7% Separated12.0% Widowed9.3% DivorcedWomen who gave birth in the past 12 months Now married:
65.5% (31)Unmarried:
34.5% (16)
Women who did not give birth in the past 12 months Now married:
39.3% (512)Unmarried:
60.7% (792)
Marital status - Black or African American population 15 years and over
Males 55.2% Never married14.5% Now married0.0% Separated0.0% Widowed30.3% DivorcedFemales 0.0% Never married21.7% Now married0.0% Separated0.0% Widowed78.3% DivorcedWomen who did not give birth in the past 12 months Now married:
39.8% (41)Unmarried:
60.2% (63)
Marital status - American Indian / Alaska Native population 15 years and over
Males 0.0% Never married100.0% Now married0.0% Separated0.0% Widowed0.0% DivorcedFemales 0.0% Never married0.0% Now married0.0% Separated100.0% Widowed0.0% DivorcedMarital status - Asian population 15 years and over
Males 35.2% Never married61.5% Now married0.0% Separated0.6% Widowed2.8% DivorcedFemales 23.4% Never married68.8% Now married0.9% Separated0.0% Widowed6.9% DivorcedWomen who gave birth in the past 12 months Now married:
100.0% (6)Unmarried:
0.0% (0)
Women who did not give birth in the past 12 months Now married:
53.4% (100)Unmarried:
46.6% (87)
Marital status - Other race population 15 years and over
Males 19.1% Never married68.5% Now married0.0% Separated0.0% Widowed12.5% DivorcedFemales 41.8% Never married58.2% Now married0.0% Separated0.0% Widowed0.0% DivorcedWomen who did not give birth in the past 12 months Now married:
49.2% (129)Unmarried:
50.8% (133)
Marital status - Two or more races population 15 years and over
Males 26.6% Never married47.0% Now married2.3% Separated9.7% Widowed14.5% DivorcedFemales 6.3% Never married67.5% Now married0.0% Separated4.9% Widowed21.3% DivorcedWomen who gave birth in the past 12 months Now married:
100.0% (104)Unmarried:
0.0% (0)
Women who did not give birth in the past 12 months Now married:
56.6% (285)Unmarried:
43.4% (218)
Marital status - White alone, not Hispanic / Latino population 15 years and over
Males 20.7% Never married65.0% Now married0.0% Separated2.6% Widowed11.8% DivorcedFemales 12.4% Never married58.5% Now married0.0% Separated18.3% Widowed10.8% DivorcedWomen who did not give birth in the past 12 months Now married:
57.8% (384)Unmarried:
42.2% (280)
Marital status - Hispanic or Latino population 15 years and over
Males 31.9% Never married52.9% Now married2.8% Separated3.7% Widowed8.7% DivorcedFemales 34.0% Never married42.1% Now married8.3% Separated5.2% Widowed10.5% DivorcedWomen who gave birth in the past 12 months Now married:
79.6% (81)Unmarried:
20.4% (21)
Women who did not give birth in the past 12 months Now married:
38.2% (598)Unmarried:
61.8% (967)
Ancestries in Port Lavaca
327 4.9% American284 4.2% German245 3.6% Irish109 1.6% European81 1.2% English66 1.0% Czech26 0.4% Scottish20 0.3% Scotch-Irish8 0.1% French7 0.1% Polish6 0.09% British5 0.07% Italian3 0.04% Cajun2 0.03% Swiss1 0.01% Egyptian
Children Nativity (place of birth) in Port Lavaca
Children under 6 years - Living with two parents Both parents native 347 100.0% NativeBoth parents foreign-born 28 100.0% NativeOne native, one foreign-born parent 49 100.0% NativeChildren under 6 years - Living with one parent Native parent 340 100.0% NativeForeign-born parent 116 100.0% NativeChildren 6 to 17 years - Living with two parents Both parents native 410 99.9% Native0 0.1% Foreign-bornBoth parents foreign-born 270 79.4% Native70 20.6% Foreign-bornOne native, one foreign-born parent 34 100.0% NativeChildren 6 to 17 years - Living with one parent Native parent 820 100.0% NativeForeign-born parent 120 55.4% Native96 44.6% Foreign-born
Grandparents responsible for own grandchildren in Port Lavaca
Grandparents (30 to 59 years) White / Caucasian 17 14.6% Responsible for grandchildren100 85.4% Not responsible for grandchildrenAsian 2 100.0% Not responsible for grandchildrenTwo or more races 73 100.0% Not responsible for grandchildrenWhite alone, not Hispanic / Latino 6 6.3% Responsible for grandchildren86 93.7% Not responsible for grandchildrenHispanic or Latino 19 14.6% Responsible for grandchildren111 85.4% Not responsible for grandchildrenGrandparents (60 years and over) White / Caucasian 46 79.8% Responsible for grandchildren12 20.2% Not responsible for grandchildrenAsian 10 100.0% Not responsible for grandchildrenTwo or more races 18 11.5% Responsible for grandchildren138 88.5% Not responsible for grandchildrenWhite alone, not Hispanic / Latino 20 80.1% Responsible for grandchildren5 19.9% Not responsible for grandchildrenHispanic or Latino 92 49.1% Responsible for grandchildren96 50.9% Not responsible for grandchildren