Races in Peabody, Massachusetts (MA) Detailed Stats
Data:
Races - White alone (%)
Races - White alone (% change since 2000)
Races - Black alone (%)
Races - Black alone (% change since 2000)
Races - American Indian alone (%)
Races - American Indian alone (% change since 2000)
Races - Asian alone (%)
Races - Asian alone (% change since 2000)
Races - Hispanic (%)
Races - Hispanic (% change since 2000)
Races - Native Hawaiian and Other Pacific Islander alone (%)
Races - Native Hawaiian and Other Pacific Islander alone (% change since 2000)
Races - Two or more races(%)
Races - Two or more races(% change since 2000)
Races - Other race alone (%)
Races - Other race alone (% change since 2000)
Racial diversity
Place of birth - Born in state of residence (%)
Place of birth - Born in state of residence (%) - White
Place of birth - Born in state of residence (%) - Black or African American
Place of birth - Born in state of residence (%) - Asian
Place of birth - Born in state of residence (%) - Hispanic or Latino
Place of birth - Born in state of residence (%) - American Indian and Alaska Native
Place of birth - Born in state of residence (%) - Multirace
Place of birth - Born in state of residence (%) - Other Race
Place of birth - Born in other state (%)
Place of birth - Born in other state (%) - White
Place of birth - Born in other state (%) - Black or African American
Place of birth - Born in other state (%) - Asian
Place of birth - Born in other state (%) - Hispanic or Latino
Place of birth - Born in other state (%) - American Indian and Alaska Native
Place of birth - Born in other state (%) - Multirace
Place of birth - Born in other state (%) - Other Race
Place of birth - Native, outside of US (%)
Place of birth - Native, outside of US (%) - White
Place of birth - Native, outside of US (%) - Black or African American
Place of birth - Native, outside of US (%) - Asian
Place of birth - Native, outside of US (%) - Hispanic or Latino
Place of birth - Native, outside of US (%) - American Indian and Alaska Native
Place of birth - Native, outside of US (%) - Multirace
Place of birth - Native, outside of US (%) - Other Race
Place of birth - Foreign born (%)
Place of birth - Foreign born (%) - White
Place of birth - Foreign born (%) - Black or African American
Place of birth - Foreign born (%) - Asian
Place of birth - Foreign born (%) - Hispanic or Latino
Place of birth - Foreign born (%) - American Indian and Alaska Native
Place of birth - Foreign born (%) - Multirace
Place of birth - Foreign born (%) - Other Race
Residents speaking English at home (%)
Residents speaking English at home - Born in the United States (%)
Residents speaking English at home - Native, born elsewhere (%)
Residents speaking English at home - Foreign born (%)
Residents speaking Spanish at home (%)
Residents speaking Spanish at home - Born in the United States (%)
Residents speaking Spanish at home - Native, born elsewhere (%)
Residents speaking Spanish at home - Foreign born (%)
Residents speaking other language at home (%)
Residents speaking other language at home - Born in the United States (%)
Residents speaking other language at home - Native, born elsewhere (%)
Residents speaking other language at home - Foreign born (%)
Marital status - Never married (%)
Marital status - Now married (%)
Marital status - Separated (%)
Marital status - Widowed (%)
Marital status - Divorced (%)
Ancestries Reported - Arab (%)
Ancestries Reported - Czech (%)
Ancestries Reported - Danish (%)
Ancestries Reported - Dutch (%)
Ancestries Reported - English (%)
Ancestries Reported - French (%)
Ancestries Reported - French Canadian (%)
Ancestries Reported - German (%)
Ancestries Reported - Greek (%)
Ancestries Reported - Hungarian (%)
Ancestries Reported - Irish (%)
Ancestries Reported - Italian (%)
Ancestries Reported - Lithuanian (%)
Ancestries Reported - Norwegian (%)
Ancestries Reported - Polish (%)
Ancestries Reported - Portuguese (%)
Ancestries Reported - Russian (%)
Ancestries Reported - Scotch-Irish (%)
Ancestries Reported - Scottish (%)
Ancestries Reported - Slovak (%)
Ancestries Reported - Subsaharan African (%)
Ancestries Reported - Swedish (%)
Ancestries Reported - Swiss (%)
Ancestries Reported - Ukrainian (%)
Ancestries Reported - United States (%)
Ancestries Reported - Welsh (%)
Ancestries Reported - West Indian (%)
Ancestries Reported - Other (%)
Geographical mobility - Same house 1 year ago (%)
Geographical mobility - Same house 1 year ago (%) - White
Geographical mobility - Same house 1 year ago (%) - Black or African American
Geographical mobility - Same house 1 year ago (%) - Asian
Geographical mobility - Same house 1 year ago (%) - Hispanic or Latino
Geographical mobility - Same house 1 year ago (%) - American Indian and Alaska Native
Geographical mobility - Same house 1 year ago (%) - Multirace
Geographical mobility - Same house 1 year ago (%) - Other Race
Geographical mobility - Moved within same county (%)
Geographical mobility - Moved within same county (%) - White
Geographical mobility - Moved within same county (%) - Black or African American
Geographical mobility - Moved within same county (%) - Asian
Geographical mobility - Moved within same county (%) - Hispanic or Latino
Geographical mobility - Moved within same county (%) - American Indian and Alaska Native
Geographical mobility - Moved within same county (%) - Multirace
Geographical mobility - Moved within same county (%) - Other Race
Geographical mobility - Moved from different county within same state (%)
Geographical mobility - Moved from different county within same state (%) - White
Geographical mobility - Moved from different county within same state (%) - Black or African American
Geographical mobility - Moved from different county within same state (%) - Asian
Geographical mobility - Moved from different county within same state (%) - Hispanic or Latino
Geographical mobility - Moved from different county within same state (%) - American Indian and Alaska Native
Geographical mobility - Moved from different county within same state (%) - Multirace
Geographical mobility - Moved from different county within same state (%) - Other Race
Geographical mobility - Moved from different state (%)
Geographical mobility - Moved from different state (%) - White
Geographical mobility - Moved from different state (%) - Black or African American
Geographical mobility - Moved from different state (%) - Asian
Geographical mobility - Moved from different state (%) - Hispanic or Latino
Geographical mobility - Moved from different state (%) - American Indian and Alaska Native
Geographical mobility - Moved from different state (%) - Multirace
Geographical mobility - Moved from different state (%) - Other Race
Geographical mobility - Moved from abroad (%)
Geographical mobility - Moved from abroad (%) - White
Geographical mobility - Moved from abroad (%) - Black or African American
Geographical mobility - Moved from abroad (%) - Asian
Geographical mobility - Moved from abroad (%) - Hispanic or Latino
Geographical mobility - Moved from abroad (%) - American Indian and Alaska Native
Geographical mobility - Moved from abroad (%) - Multirace
Geographical mobility - Moved from abroad (%) - Other Race
Place of birth for the foreign-born population - Ireland (%)
Place of birth for the foreign-born population - Denmark (%)
Place of birth for the foreign-born population - Norway (%)
Place of birth for the foreign-born population - Sweden (%)
Place of birth for the foreign-born population - United Kingdom (%)
Place of birth for the foreign-born population - England (%)
Place of birth for the foreign-born population - Scotland (%)
Place of birth for the foreign-born population - Other Northern Europe (%)
Place of birth for the foreign-born population - Austria (%)
Place of birth for the foreign-born population - Belgium (%)
Place of birth for the foreign-born population - France (%)
Place of birth for the foreign-born population - Germany (%)
Place of birth for the foreign-born population - Netherlands (%)
Place of birth for the foreign-born population - Switzerland (%)
Place of birth for the foreign-born population - Other Western Europe (%)
Place of birth for the foreign-born population - Greece (%)
Place of birth for the foreign-born population - Italy (%)
Place of birth for the foreign-born population - Portugal (%)
Place of birth for the foreign-born population - Spain (%)
Place of birth for the foreign-born population - Other Southern Europe (%)
Place of birth for the foreign-born population - Albania (%)
Place of birth for the foreign-born population - Belarus (%)
Place of birth for the foreign-born population - Bosnia and Herzegovina (%)
Place of birth for the foreign-born population - Bulgaria (%)
Place of birth for the foreign-born population - Croatia (%)
Place of birth for the foreign-born population - Czechoslovakia (%)
Place of birth for the foreign-born population - Hungary (%)
Place of birth for the foreign-born population - Latvia (%)
Place of birth for the foreign-born population - Lithuania (%)
Place of birth for the foreign-born population - North Macedonia (Macedonia) (%)
Place of birth for the foreign-born population - Moldova (%)
Place of birth for the foreign-born population - Poland (%)
Place of birth for the foreign-born population - Romania (%)
Place of birth for the foreign-born population - Russia (%)
Place of birth for the foreign-born population - Serbia (%)
Place of birth for the foreign-born population - Ukraine (%)
Place of birth for the foreign-born population - Other Eastern Europe (%)
Place of birth for the foreign-born population - China (%)
Place of birth for the foreign-born population - Hong Kong (%)
Place of birth for the foreign-born population - Taiwan (%)
Place of birth for the foreign-born population - Japan (%)
Place of birth for the foreign-born population - Korea (%)
Place of birth for the foreign-born population - Other Eastern Asia (%)
Place of birth for the foreign-born population - Afghanistan (%)
Place of birth for the foreign-born population - Bangladesh (%)
Place of birth for the foreign-born population - India (%)
Place of birth for the foreign-born population - Iran (%)
Place of birth for the foreign-born population - Kazakhstan (%)
Place of birth for the foreign-born population - Nepal (%)
Place of birth for the foreign-born population - Pakistan (%)
Place of birth for the foreign-born population - Sri Lanka (%)
Place of birth for the foreign-born population - Uzbekistan (%)
Place of birth for the foreign-born population - Other South Central Asia (%)
Place of birth for the foreign-born population - Burma (%)
Place of birth for the foreign-born population - Cambodia (%)
Place of birth for the foreign-born population - Indonesia (%)
Place of birth for the foreign-born population - Laos (%)
Place of birth for the foreign-born population - Malaysia (%)
Place of birth for the foreign-born population - Philippines (%)
Place of birth for the foreign-born population - Singapore (%)
Place of birth for the foreign-born population - Thailand (%)
Place of birth for the foreign-born population - Vietnam (%)
Place of birth for the foreign-born population - Other South Eastern Asia (%)
Place of birth for the foreign-born population - Armenia (%)
Place of birth for the foreign-born population - Iraq (%)
Place of birth for the foreign-born population - Israel (%)
Place of birth for the foreign-born population - Jordan (%)
Place of birth for the foreign-born population - Kuwait (%)
Place of birth for the foreign-born population - Lebanon (%)
Place of birth for the foreign-born population - Saudi Arabia (%)
Place of birth for the foreign-born population - Syria (%)
Place of birth for the foreign-born population - Turkey (%)
Place of birth for the foreign-born population - Yemen (%)
Place of birth for the foreign-born population - Other Western Asia (%)
Place of birth for the foreign-born population - Eritrea (%)
Place of birth for the foreign-born population - Ethiopia (%)
Place of birth for the foreign-born population - Kenya (%)
Place of birth for the foreign-born population - Somalia (%)
Place of birth for the foreign-born population - Uganda (%)
Place of birth for the foreign-born population - Zimbabwe (%)
Place of birth for the foreign-born population - Other Eastern Africa (%)
Place of birth for the foreign-born population - Cameroon (%)
Place of birth for the foreign-born population - Congo (%)
Place of birth for the foreign-born population - Democratic Republic of Congo (Zaire) (%)
Place of birth for the foreign-born population - Other Middle Africa (%)
Place of birth for the foreign-born population - Egypt (%)
Place of birth for the foreign-born population - Morocco (%)
Place of birth for the foreign-born population - Sudan (%)
Place of birth for the foreign-born population - Other Northern Africa (%)
Place of birth for the foreign-born population - South Africa (%)
Place of birth for the foreign-born population - Other Southern Africa (%)
Place of birth for the foreign-born population - Cabo Verde (%)
Place of birth for the foreign-born population - Ghana (%)
Place of birth for the foreign-born population - Liberia (%)
Place of birth for the foreign-born population - Nigeria (%)
Place of birth for the foreign-born population - Senegal (%)
Place of birth for the foreign-born population - Sierra Leone (%)
Place of birth for the foreign-born population - Other Western Africa (%)
Place of birth for the foreign-born population - Australia (%)
Place of birth for the foreign-born population - New Zealand (%)
Place of birth for the foreign-born population - Fiji (%)
Place of birth for the foreign-born population - Micronesia (%)
Place of birth for the foreign-born population - Bahamas (%)
Place of birth for the foreign-born population - Barbados (%)
Place of birth for the foreign-born population - Cuba (%)
Place of birth for the foreign-born population - Dominica (%)
Place of birth for the foreign-born population - Dominican Republic (%)
Place of birth for the foreign-born population - Grenada (%)
Place of birth for the foreign-born population - Haiti (%)
Place of birth for the foreign-born population - Jamaica (%)
Place of birth for the foreign-born population - St. Vincent and the Grenadines (%)
Place of birth for the foreign-born population - Trinidad and Tobago (%)
Place of birth for the foreign-born population - West Indies (%)
Place of birth for the foreign-born population - Other Caribbean (%)
Place of birth for the foreign-born population - Belize (%)
Place of birth for the foreign-born population - Costa Rica (%)
Place of birth for the foreign-born population - El Salvador (%)
Place of birth for the foreign-born population - Guatemala (%)
Place of birth for the foreign-born population - Honduras (%)
Place of birth for the foreign-born population - Mexico (%)
Place of birth for the foreign-born population - Nicaragua (%)
Place of birth for the foreign-born population - Panama (%)
Place of birth for the foreign-born population - Other Central America (%)
Place of birth for the foreign-born population - Argentina (%)
Place of birth for the foreign-born population - Bolivia (%)
Place of birth for the foreign-born population - Brazil (%)
Place of birth for the foreign-born population - Chile (%)
Place of birth for the foreign-born population - Colombia (%)
Place of birth for the foreign-born population - Ecuador (%)
Place of birth for the foreign-born population - Guyana (%)
Place of birth for the foreign-born population - Peru (%)
Place of birth for the foreign-born population - Uruguay (%)
Place of birth for the foreign-born population - Venezuela (%)
Place of birth for the foreign-born population - Other South America (%)
Place of birth for the foreign-born population - Canada (%)
Place of birth for the foreign-born population - Other Northern America (%)
Place of birth for the foreign-born population - Other (%)
Latest news about races in Peabody, MA collected exclusively by city-data.com from local newspapers, TV, and radio stations
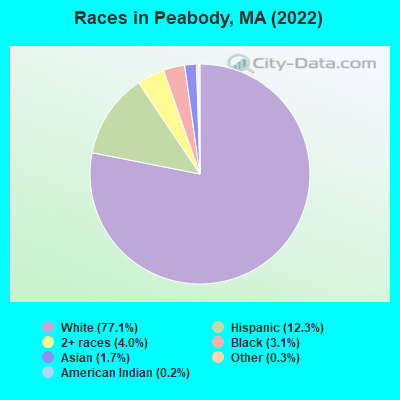
According to 2022 data, the most numerous races in Peabody, MA are White alone (41,850 residents), Hispanic (6,654 residents), and Asian alone (914 residents). 76.0% of Peabody residents speak English at home. 16.7% of Peabody, MA residents are foreign-born (7.9% born in Latin America, 6.2% born in Europe), which is 7.6% less than the foreign-born rate of 18.0% across the entire state of Massachusetts.
Race distribution in Peabody
2000 2022
5,198,359 81.9% White alone 428,729 6.8% Hispanic 318,329 5.0% Black alone 236,786 3.7% Asian alone 110,338 1.7% Two or more races 43,586 0.7% Other race alone 11,264 0.2% American Indian alone 1,706 0.03% Native Hawaiian and Other
4,676,627 67.0% White alone 911,038 13.0% Hispanic 501,463 7.2% Asian alone 459,740 6.6% Black alone 341,889 4.9% Two or more races 84,403 1.2% Other race alone 5,838 0.08% American Indian alone 976 0.01% Native Hawaiian and Other
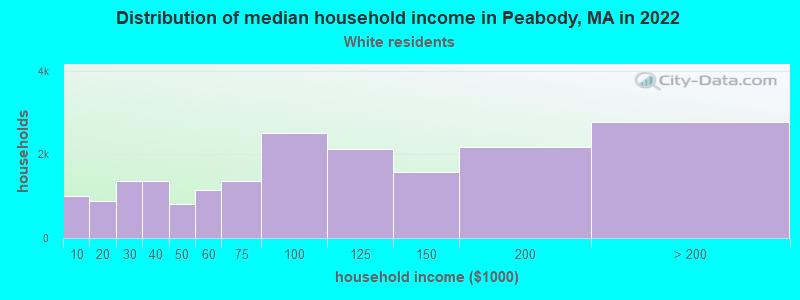
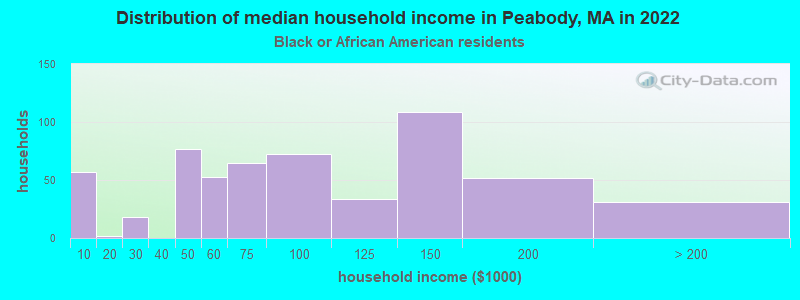
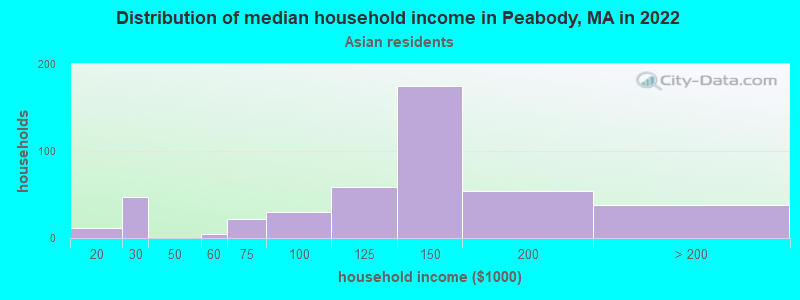
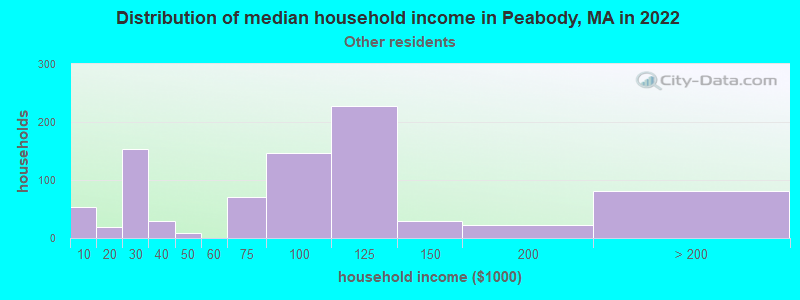
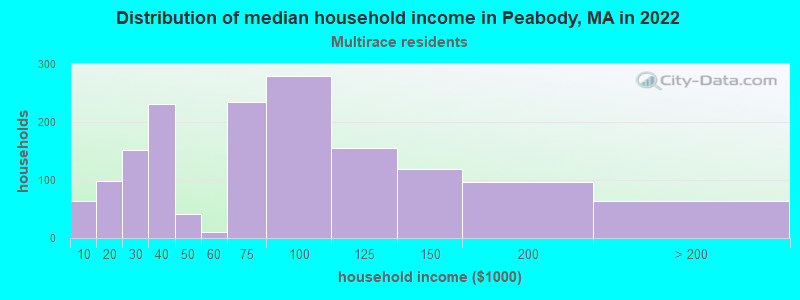
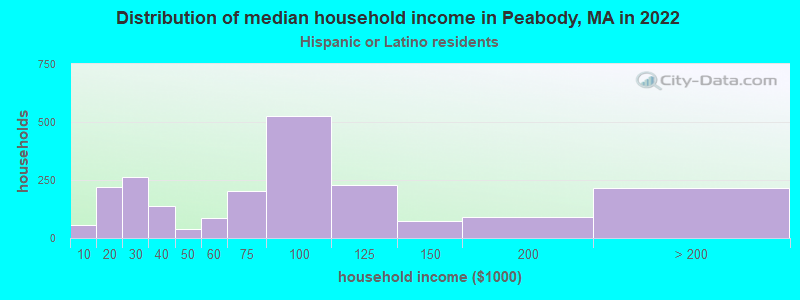
Income and house value in Peabody Median household income in 2022 $91,019 White non-Hispanic householders$79,624 Black householders$108,859 Asian householders$91,893 Some other race householders$66,720 Two or more races householders$78,601 Hispanic or Latino race householdersMedian 2022 house value $577,344 White Non-Hispanic householders$656,682 Black or African American householders$368,546 American Indian or Alaska Native householders $670,084 Asian householders$507,655 Some other race householders$639,260 Two or more races householders$613,797 Hispanic or Latino householders
Median age by race in Peabody
51.8 Median age for White residents50.5 52.6 32.9 Median age for Black or African American residents33.2 29.8 56.3 Median age for American Indian / Alaska Native residents-679,156,908.0 -364,551,862.7 56.0 Median age for Asian residents44.5 58.2 -514,227,641.8 Median age for Native Hawaiian / Pacific Islander residents-666,666,666.0 -508,717,948.2 43.7 Median age for Other race residents44.4 42.4 30.2 Median age for Two or more races residents26.8 31.3 52.1 Median age for White alone residents50.9 53.0 31.7 Median age for Hispanic or Latino residents31.4 32.9
Owner/renter occupied households by race in Peabody
House owners and renters - White residents 13,341 70.3% Owner occupied5,646 29.7% Renter occupiedHouse owners and renters - Black or African American residents 231 41.0% Owner occupied334 59.0% Renter occupiedHouse owners and renters - American Indian / Alaska Native residents 7 100.0% Renter occupiedHouse owners and renters - Asian residents 366 80.6% Owner occupied88 19.4% Renter occupiedHouse owners and renters - Other race residents 411 53.5% Owner occupied356 46.5% Renter occupiedHouse owners and renters - Two or more races residents 622 40.4% Owner occupied916 59.6% Renter occupiedHouse owners and renters - White alone residents 13,285 70.5% Owner occupied5,546 29.5% Renter occupiedHouse owners and renters - Hispanic or Latino residents 846 38.9% Owner occupied1,331 61.1% Renter occupied
Language usage in Peabody
English speakers - Total 76.0% of residents of Peabody speak English at home.
7.6% of residents speak Spanish at home 1,618 41.7% Speak English very well2,265 58.3% Speak English less than very well16.5% of residents speak other language at home 5,036 59.6% Speak English very well3,418 40.4% Speak English less than very well
English speakers - Born in the United States 93.1% of residents of Peabody speak English at home.
5.9% of residents speak Spanish at home 210 67.1% Speak English very well103 32.9% Speak English less than very well1.6% of residents speak other language at home 46 55.4% Speak English very well37 44.6% Speak English less than very well
English speakers - Native, born elsewhere 41.5% of residents of Peabody speak English at home.
49.5% of residents speak Spanish at home 224 61.2% Speak English very well142 38.8% Speak English less than very well9.7% of residents speak other language at home 36 50.0% Speak English very well36 50.0% Speak English less than very well
English speakers - Foreign-born 11.9% of residents of Peabody speak English at home.
25.7% of residents speak Spanish at home 670 27.8% Speak English very well1,740 72.2% Speak English less than very well61.5% of residents speak other language at home 2,866 49.7% Speak English very well2,902 50.3% Speak English less than very well
White (Caucasian) - Speak only English Native:
95.2% (34,812)Foreign-born:
14.1% (521)
White (Caucasian) - Speak another language Native:
4.8% (1,760)Foreign-born:
84.6% (3,133)
Black or African American - Speak only English Native:
81.8% (515)Foreign-born:
29.0% (236)
Black or African American - Speak another language Native:
18.5% (117)Foreign-born:
71.3% (579)
Asian - Speak only English Native:
46.7% (167)Foreign-born:
24.4% (131)
Asian - Speak another language Native:
51.4% (184)Foreign-born:
73.0% (392)
Other race - Speak only English Native:
39.6% (276)Foreign-born:
5.6% (79)
Other race - Speak another language Native:
63.7% (445)Foreign-born:
94.5% (1,347)
Two or more races - Speak only English Native:
61.8% (1,740)Foreign-born:
5.7% (93)
Two or more races - Speak another language Native:
37.5% (1,058)Foreign-born:
93.2% (1,511)
White alone - Speak only English Native:
94.8% (34,208)Foreign-born:
14.8% (579)
White alone - Speak another language Native:
5.3% (1,901)Foreign-born:
85.9% (3,354)
Hispanic or Latino - Speak only English Native:
54.1% (1,682)Foreign-born:
3.4% (91)
Hispanic or Latino - Speak another language Native:
47.2% (1,469)Foreign-born:
96.4% (2,580)
Foreign-born residents in Peabody 9,073 residents are foreign born (7.9% Latin America , 6.2% Europe ).
This city:
16.7%Massachusetts:
17.6%
Marital status for residents in Peabody Marital status - White (Caucasian) population 15 years and over
Males 31.3% Never married53.0% Now married0.2% Separated4.9% Widowed10.5% DivorcedFemales 25.5% Never married46.1% Now married1.2% Separated15.8% Widowed11.3% DivorcedWomen who gave birth in the past 12 months Now married:
75.3% (443)Unmarried:
24.7% (146)
Women who did not give birth in the past 12 months Now married:
42.8% (3,163)Unmarried:
57.2% (4,235)
Marital status - Black or African American population 15 years and over
Males 31.3% Never married51.3% Now married5.3% Separated0.0% Widowed12.1% DivorcedFemales 34.6% Never married44.5% Now married0.0% Separated4.6% Widowed16.3% DivorcedWomen who gave birth in the past 12 months Now married:
100.0% (106)Unmarried:
0.0% (0)
Women who did not give birth in the past 12 months Now married:
27.3% (79)Unmarried:
72.7% (211)
Marital status - American Indian / Alaska Native population 15 years and over
Males 0.0% Never married86.7% Now married0.0% Separated13.3% Widowed0.0% DivorcedFemales 0.0% Never married0.0% Now married0.0% Separated100.0% Widowed0.0% DivorcedMarital status - Asian population 15 years and over
Males 15.8% Never married69.1% Now married0.0% Separated7.0% Widowed8.1% DivorcedFemales 7.7% Never married64.3% Now married0.0% Separated8.7% Widowed19.3% DivorcedWomen who did not give birth in the past 12 months Now married:
67.3% (121)Unmarried:
32.7% (59)
Marital status - Other race population 15 years and over
Males 35.1% Never married48.8% Now married0.0% Separated0.8% Widowed15.3% DivorcedFemales 20.9% Never married42.8% Now married5.2% Separated8.3% Widowed22.8% DivorcedWomen who gave birth in the past 12 months Now married:
100.0% (39)Unmarried:
0.0% (0)
Women who did not give birth in the past 12 months Now married:
33.9% (109)Unmarried:
66.1% (214)
Marital status - Two or more races population 15 years and over
Males 41.4% Never married47.6% Now married2.5% Separated1.7% Widowed6.7% DivorcedFemales 28.5% Never married53.7% Now married2.4% Separated4.0% Widowed11.3% DivorcedWomen who gave birth in the past 12 months Now married:
100.0% (64)Unmarried:
0.0% (0)
Women who did not give birth in the past 12 months Now married:
59.4% (642)Unmarried:
40.6% (439)
Marital status - White alone, not Hispanic / Latino population 15 years and over
Males 30.6% Never married54.0% Now married0.2% Separated5.1% Widowed10.2% DivorcedFemales 24.5% Never married46.8% Now married1.2% Separated16.3% Widowed11.3% DivorcedWomen who gave birth in the past 12 months Now married:
74.7% (453)Unmarried:
25.3% (154)
Women who did not give birth in the past 12 months Now married:
43.6% (3,160)Unmarried:
56.4% (4,082)
Marital status - Hispanic or Latino population 15 years and over
Males 41.8% Never married44.0% Now married2.1% Separated0.3% Widowed11.8% DivorcedFemales 33.9% Never married40.8% Now married3.5% Separated4.6% Widowed17.1% DivorcedWomen who gave birth in the past 12 months Now married:
100.0% (33)Unmarried:
0.0% (0)
Women who did not give birth in the past 12 months Now married:
46.4% (655)Unmarried:
53.6% (756)
Ancestries in Peabody
4,677 17.4% Italian3,272 12.2% Irish1,721 6.4% Portuguese1,540 5.7% Greek1,203 4.5% Brazilian1,190 4.4% English1,158 4.3% Albanian1,032 3.8% American601 2.2% Polish590 2.2% French Canadian563 2.1% European548 2.0% Haitian490 1.8% French387 1.4% Russian264 1.0% Scottish219 0.8% German147 0.5% Lithuanian131 0.5% Canadian107 0.4% Eastern European96 0.4% West Indian95 0.4% Ukrainian92 0.3% Iranian88 0.3% Iraqi70 0.3% Egyptian67 0.2% Romanian59 0.2% Scotch-Irish58 0.2% Swiss56 0.2% Dutch55 0.2% Swedish46 0.2% Turkish42 0.2% Hungarian37 0.1% Austrian31 0.1% Jamaican30 0.1% British27 0.1% Norwegian26 0.10% Moroccan25 0.09% Barbadian23 0.09% Lebanese21 0.08% Slovak19 0.07% Finnish10 0.04% African9 0.03% Croatian7 0.03% Scandinavian5 0.02% British West Indian
Geographical mobility in Peabody Same house 1 year ago 38,089 90.4% White (Caucasian)1,113 71.4% Black or African American78 100.0% American Indian / Alaska Native710 78.7% Asian2,107 99.7% Other race3,988 82.7% Two or more races37,295 90.1% White alone, not Hispanic / Latino6,237 94.5% Hispanic or LatinoMoved within same county 2,477 5.9% White / Caucasian92 5.9% Black or African American43 2.0% Other race605 12.5% Two or more races2,477 6.0% White alone, not Hispanic / Latino290 4.4% Hispanic or LatinoMoved within same state 1,115 2.6% White / Caucasian113 7.3% Black or African American83 9.2% Asian4 0.2% Other race97 2.0% Two or more races1,183 2.9% White alone, not Hispanic / Latino31 0.5% Hispanic or LatinoMoved from different state 171 0.4% White / Caucasian242 15.5% Black or African American72 8.0% Asian30 0.6% Two or more races124 0.3% White alone, not Hispanic / Latino70 1.1% Hispanic or LatinoMoved from abroad 211 0.5% White15 1.0% Black or African American22 2.5% Asian98 2.0% Two or more races284 0.7% White alone, not Hispanic / Latino
Children Nativity (place of birth) in Peabody
Children under 6 years - Living with two parents Both parents native 1,461 100.0% NativeBoth parents foreign-born 658 97.8% Native15 2.2% Foreign-bornOne native, one foreign-born parent 460 100.0% NativeChildren under 6 years - Living with one parent Native parent 624 100.0% NativeForeign-born parent 51 100.0% NativeChildren 6 to 17 years - Living with two parents Both parents native 2,585 99.7% Native8 0.3% Foreign-bornBoth parents foreign-born 1,161 82.9% Native240 17.1% Foreign-bornOne native, one foreign-born parent 202 91.9% Native18 8.1% Foreign-bornChildren 6 to 17 years - Living with one parent Native parent 1,272 100.0% NativeForeign-born parent 272 51.0% Native262 49.0% Foreign-born
Place of birth for residents in Peabody 4,555 Americas4,405 Latin America3,444 Europe2,515 Caribbean1,741 Southern Europe1,657 South America1,325 Eastern Europe798 Asia283 Eastern Asia246 South Eastern Asia241 Africa232 Central America211 Northern Europe210 China166 Western Europe158 Western Asia149 Northern America110 South Central Asia85 Middle Africa75 Western Africa51 Northern Africa33 Oceania33 Australia and New Zealand Subregion28 Eastern Africa1,818 Dominican Republic1,527 Brazil1,065 Albania1,001 Portugal407 Haiti392 Greece322 Italy180 China161 Cuba149 Canada126 El Salvador104 Iran101 Ireland87 Azores Islands86 Vietnam82 Iraq82 Poland77 Romania70 Russia69 France64 Thailand64 Guatemala56 Korea56 Austria55 England54 Jamaica53 Nigeria51 Peru49 Cambodia46 Chile44 Democratic Republic of Congo (Zaire)44 Philippines41 Congo34 Trinidad and Tobago34 Honduras33 Australia33 United Kingdom32 Barbados29 Taiwan28 Turkey28 Kenya27 Morocco24 Spain24 Jordan23 Egypt20 Scotland20 Switzerland19 Germany16 Japan16 Colombia15 Croatia15 Israel15 Argentina11 Czechoslovakia9 Ivory Coast7 Armenia7 St. Lucia7 Mexico6 India3 Ukraine2 Indonesia
Grandparents responsible for own grandchildren in Peabody
Grandparents (30 to 59 years) White / Caucasian 66 100.0% Not responsible for grandchildrenBlack or African American 7 100.0% Not responsible for grandchildrenWhite alone, not Hispanic / Latino 80 100.0% Not responsible for grandchildrenHispanic or Latino 10 100.0% Not responsible for grandchildrenGrandparents (60 years and over) White / Caucasian 82 10.0% Responsible for grandchildren742 90.0% Not responsible for grandchildrenBlack or African American 6 100.0% Not responsible for grandchildrenWhite alone, not Hispanic / Latino 94 11.6% Responsible for grandchildren717 88.4% Not responsible for grandchildrenHispanic or Latino 142 100.0% Not responsible for grandchildren