Races in Oakton, Virginia (VA) Detailed Stats
Data:
Races - White alone (%)
Races - White alone (% change since 2000)
Races - Black alone (%)
Races - Black alone (% change since 2000)
Races - American Indian alone (%)
Races - American Indian alone (% change since 2000)
Races - Asian alone (%)
Races - Asian alone (% change since 2000)
Races - Hispanic (%)
Races - Hispanic (% change since 2000)
Races - Native Hawaiian and Other Pacific Islander alone (%)
Races - Native Hawaiian and Other Pacific Islander alone (% change since 2000)
Races - Two or more races(%)
Races - Two or more races(% change since 2000)
Races - Other race alone (%)
Races - Other race alone (% change since 2000)
Racial diversity
Place of birth - Born in state of residence (%)
Place of birth - Born in state of residence (%) - White
Place of birth - Born in state of residence (%) - Black or African American
Place of birth - Born in state of residence (%) - Asian
Place of birth - Born in state of residence (%) - Hispanic or Latino
Place of birth - Born in state of residence (%) - American Indian and Alaska Native
Place of birth - Born in state of residence (%) - Multirace
Place of birth - Born in state of residence (%) - Other Race
Place of birth - Born in other state (%)
Place of birth - Born in other state (%) - White
Place of birth - Born in other state (%) - Black or African American
Place of birth - Born in other state (%) - Asian
Place of birth - Born in other state (%) - Hispanic or Latino
Place of birth - Born in other state (%) - American Indian and Alaska Native
Place of birth - Born in other state (%) - Multirace
Place of birth - Born in other state (%) - Other Race
Place of birth - Native, outside of US (%)
Place of birth - Native, outside of US (%) - White
Place of birth - Native, outside of US (%) - Black or African American
Place of birth - Native, outside of US (%) - Asian
Place of birth - Native, outside of US (%) - Hispanic or Latino
Place of birth - Native, outside of US (%) - American Indian and Alaska Native
Place of birth - Native, outside of US (%) - Multirace
Place of birth - Native, outside of US (%) - Other Race
Place of birth - Foreign born (%)
Place of birth - Foreign born (%) - White
Place of birth - Foreign born (%) - Black or African American
Place of birth - Foreign born (%) - Asian
Place of birth - Foreign born (%) - Hispanic or Latino
Place of birth - Foreign born (%) - American Indian and Alaska Native
Place of birth - Foreign born (%) - Multirace
Place of birth - Foreign born (%) - Other Race
Residents speaking English at home (%)
Residents speaking English at home - Born in the United States (%)
Residents speaking English at home - Native, born elsewhere (%)
Residents speaking English at home - Foreign born (%)
Residents speaking Spanish at home (%)
Residents speaking Spanish at home - Born in the United States (%)
Residents speaking Spanish at home - Native, born elsewhere (%)
Residents speaking Spanish at home - Foreign born (%)
Residents speaking other language at home (%)
Residents speaking other language at home - Born in the United States (%)
Residents speaking other language at home - Native, born elsewhere (%)
Residents speaking other language at home - Foreign born (%)
Marital status - Never married (%)
Marital status - Now married (%)
Marital status - Separated (%)
Marital status - Widowed (%)
Marital status - Divorced (%)
Ancestries Reported - Arab (%)
Ancestries Reported - Czech (%)
Ancestries Reported - Danish (%)
Ancestries Reported - Dutch (%)
Ancestries Reported - English (%)
Ancestries Reported - French (%)
Ancestries Reported - French Canadian (%)
Ancestries Reported - German (%)
Ancestries Reported - Greek (%)
Ancestries Reported - Hungarian (%)
Ancestries Reported - Irish (%)
Ancestries Reported - Italian (%)
Ancestries Reported - Lithuanian (%)
Ancestries Reported - Norwegian (%)
Ancestries Reported - Polish (%)
Ancestries Reported - Portuguese (%)
Ancestries Reported - Russian (%)
Ancestries Reported - Scotch-Irish (%)
Ancestries Reported - Scottish (%)
Ancestries Reported - Slovak (%)
Ancestries Reported - Subsaharan African (%)
Ancestries Reported - Swedish (%)
Ancestries Reported - Swiss (%)
Ancestries Reported - Ukrainian (%)
Ancestries Reported - United States (%)
Ancestries Reported - Welsh (%)
Ancestries Reported - West Indian (%)
Ancestries Reported - Other (%)
Geographical mobility - Same house 1 year ago (%)
Geographical mobility - Same house 1 year ago (%) - White
Geographical mobility - Same house 1 year ago (%) - Black or African American
Geographical mobility - Same house 1 year ago (%) - Asian
Geographical mobility - Same house 1 year ago (%) - Hispanic or Latino
Geographical mobility - Same house 1 year ago (%) - American Indian and Alaska Native
Geographical mobility - Same house 1 year ago (%) - Multirace
Geographical mobility - Same house 1 year ago (%) - Other Race
Geographical mobility - Moved within same county (%)
Geographical mobility - Moved within same county (%) - White
Geographical mobility - Moved within same county (%) - Black or African American
Geographical mobility - Moved within same county (%) - Asian
Geographical mobility - Moved within same county (%) - Hispanic or Latino
Geographical mobility - Moved within same county (%) - American Indian and Alaska Native
Geographical mobility - Moved within same county (%) - Multirace
Geographical mobility - Moved within same county (%) - Other Race
Geographical mobility - Moved from different county within same state (%)
Geographical mobility - Moved from different county within same state (%) - White
Geographical mobility - Moved from different county within same state (%) - Black or African American
Geographical mobility - Moved from different county within same state (%) - Asian
Geographical mobility - Moved from different county within same state (%) - Hispanic or Latino
Geographical mobility - Moved from different county within same state (%) - American Indian and Alaska Native
Geographical mobility - Moved from different county within same state (%) - Multirace
Geographical mobility - Moved from different county within same state (%) - Other Race
Geographical mobility - Moved from different state (%)
Geographical mobility - Moved from different state (%) - White
Geographical mobility - Moved from different state (%) - Black or African American
Geographical mobility - Moved from different state (%) - Asian
Geographical mobility - Moved from different state (%) - Hispanic or Latino
Geographical mobility - Moved from different state (%) - American Indian and Alaska Native
Geographical mobility - Moved from different state (%) - Multirace
Geographical mobility - Moved from different state (%) - Other Race
Geographical mobility - Moved from abroad (%)
Geographical mobility - Moved from abroad (%) - White
Geographical mobility - Moved from abroad (%) - Black or African American
Geographical mobility - Moved from abroad (%) - Asian
Geographical mobility - Moved from abroad (%) - Hispanic or Latino
Geographical mobility - Moved from abroad (%) - American Indian and Alaska Native
Geographical mobility - Moved from abroad (%) - Multirace
Geographical mobility - Moved from abroad (%) - Other Race
Place of birth for the foreign-born population - Ireland (%)
Place of birth for the foreign-born population - Denmark (%)
Place of birth for the foreign-born population - Norway (%)
Place of birth for the foreign-born population - Sweden (%)
Place of birth for the foreign-born population - United Kingdom (%)
Place of birth for the foreign-born population - England (%)
Place of birth for the foreign-born population - Scotland (%)
Place of birth for the foreign-born population - Other Northern Europe (%)
Place of birth for the foreign-born population - Austria (%)
Place of birth for the foreign-born population - Belgium (%)
Place of birth for the foreign-born population - France (%)
Place of birth for the foreign-born population - Germany (%)
Place of birth for the foreign-born population - Netherlands (%)
Place of birth for the foreign-born population - Switzerland (%)
Place of birth for the foreign-born population - Other Western Europe (%)
Place of birth for the foreign-born population - Greece (%)
Place of birth for the foreign-born population - Italy (%)
Place of birth for the foreign-born population - Portugal (%)
Place of birth for the foreign-born population - Spain (%)
Place of birth for the foreign-born population - Other Southern Europe (%)
Place of birth for the foreign-born population - Albania (%)
Place of birth for the foreign-born population - Belarus (%)
Place of birth for the foreign-born population - Bosnia and Herzegovina (%)
Place of birth for the foreign-born population - Bulgaria (%)
Place of birth for the foreign-born population - Croatia (%)
Place of birth for the foreign-born population - Czechoslovakia (%)
Place of birth for the foreign-born population - Hungary (%)
Place of birth for the foreign-born population - Latvia (%)
Place of birth for the foreign-born population - Lithuania (%)
Place of birth for the foreign-born population - North Macedonia (Macedonia) (%)
Place of birth for the foreign-born population - Moldova (%)
Place of birth for the foreign-born population - Poland (%)
Place of birth for the foreign-born population - Romania (%)
Place of birth for the foreign-born population - Russia (%)
Place of birth for the foreign-born population - Serbia (%)
Place of birth for the foreign-born population - Ukraine (%)
Place of birth for the foreign-born population - Other Eastern Europe (%)
Place of birth for the foreign-born population - China (%)
Place of birth for the foreign-born population - Hong Kong (%)
Place of birth for the foreign-born population - Taiwan (%)
Place of birth for the foreign-born population - Japan (%)
Place of birth for the foreign-born population - Korea (%)
Place of birth for the foreign-born population - Other Eastern Asia (%)
Place of birth for the foreign-born population - Afghanistan (%)
Place of birth for the foreign-born population - Bangladesh (%)
Place of birth for the foreign-born population - India (%)
Place of birth for the foreign-born population - Iran (%)
Place of birth for the foreign-born population - Kazakhstan (%)
Place of birth for the foreign-born population - Nepal (%)
Place of birth for the foreign-born population - Pakistan (%)
Place of birth for the foreign-born population - Sri Lanka (%)
Place of birth for the foreign-born population - Uzbekistan (%)
Place of birth for the foreign-born population - Other South Central Asia (%)
Place of birth for the foreign-born population - Burma (%)
Place of birth for the foreign-born population - Cambodia (%)
Place of birth for the foreign-born population - Indonesia (%)
Place of birth for the foreign-born population - Laos (%)
Place of birth for the foreign-born population - Malaysia (%)
Place of birth for the foreign-born population - Philippines (%)
Place of birth for the foreign-born population - Singapore (%)
Place of birth for the foreign-born population - Thailand (%)
Place of birth for the foreign-born population - Vietnam (%)
Place of birth for the foreign-born population - Other South Eastern Asia (%)
Place of birth for the foreign-born population - Armenia (%)
Place of birth for the foreign-born population - Iraq (%)
Place of birth for the foreign-born population - Israel (%)
Place of birth for the foreign-born population - Jordan (%)
Place of birth for the foreign-born population - Kuwait (%)
Place of birth for the foreign-born population - Lebanon (%)
Place of birth for the foreign-born population - Saudi Arabia (%)
Place of birth for the foreign-born population - Syria (%)
Place of birth for the foreign-born population - Turkey (%)
Place of birth for the foreign-born population - Yemen (%)
Place of birth for the foreign-born population - Other Western Asia (%)
Place of birth for the foreign-born population - Eritrea (%)
Place of birth for the foreign-born population - Ethiopia (%)
Place of birth for the foreign-born population - Kenya (%)
Place of birth for the foreign-born population - Somalia (%)
Place of birth for the foreign-born population - Uganda (%)
Place of birth for the foreign-born population - Zimbabwe (%)
Place of birth for the foreign-born population - Other Eastern Africa (%)
Place of birth for the foreign-born population - Cameroon (%)
Place of birth for the foreign-born population - Congo (%)
Place of birth for the foreign-born population - Democratic Republic of Congo (Zaire) (%)
Place of birth for the foreign-born population - Other Middle Africa (%)
Place of birth for the foreign-born population - Egypt (%)
Place of birth for the foreign-born population - Morocco (%)
Place of birth for the foreign-born population - Sudan (%)
Place of birth for the foreign-born population - Other Northern Africa (%)
Place of birth for the foreign-born population - South Africa (%)
Place of birth for the foreign-born population - Other Southern Africa (%)
Place of birth for the foreign-born population - Cabo Verde (%)
Place of birth for the foreign-born population - Ghana (%)
Place of birth for the foreign-born population - Liberia (%)
Place of birth for the foreign-born population - Nigeria (%)
Place of birth for the foreign-born population - Senegal (%)
Place of birth for the foreign-born population - Sierra Leone (%)
Place of birth for the foreign-born population - Other Western Africa (%)
Place of birth for the foreign-born population - Australia (%)
Place of birth for the foreign-born population - New Zealand (%)
Place of birth for the foreign-born population - Fiji (%)
Place of birth for the foreign-born population - Micronesia (%)
Place of birth for the foreign-born population - Bahamas (%)
Place of birth for the foreign-born population - Barbados (%)
Place of birth for the foreign-born population - Cuba (%)
Place of birth for the foreign-born population - Dominica (%)
Place of birth for the foreign-born population - Dominican Republic (%)
Place of birth for the foreign-born population - Grenada (%)
Place of birth for the foreign-born population - Haiti (%)
Place of birth for the foreign-born population - Jamaica (%)
Place of birth for the foreign-born population - St. Vincent and the Grenadines (%)
Place of birth for the foreign-born population - Trinidad and Tobago (%)
Place of birth for the foreign-born population - West Indies (%)
Place of birth for the foreign-born population - Other Caribbean (%)
Place of birth for the foreign-born population - Belize (%)
Place of birth for the foreign-born population - Costa Rica (%)
Place of birth for the foreign-born population - El Salvador (%)
Place of birth for the foreign-born population - Guatemala (%)
Place of birth for the foreign-born population - Honduras (%)
Place of birth for the foreign-born population - Mexico (%)
Place of birth for the foreign-born population - Nicaragua (%)
Place of birth for the foreign-born population - Panama (%)
Place of birth for the foreign-born population - Other Central America (%)
Place of birth for the foreign-born population - Argentina (%)
Place of birth for the foreign-born population - Bolivia (%)
Place of birth for the foreign-born population - Brazil (%)
Place of birth for the foreign-born population - Chile (%)
Place of birth for the foreign-born population - Colombia (%)
Place of birth for the foreign-born population - Ecuador (%)
Place of birth for the foreign-born population - Guyana (%)
Place of birth for the foreign-born population - Peru (%)
Place of birth for the foreign-born population - Uruguay (%)
Place of birth for the foreign-born population - Venezuela (%)
Place of birth for the foreign-born population - Other South America (%)
Place of birth for the foreign-born population - Canada (%)
Place of birth for the foreign-born population - Other Northern America (%)
Place of birth for the foreign-born population - Other (%)
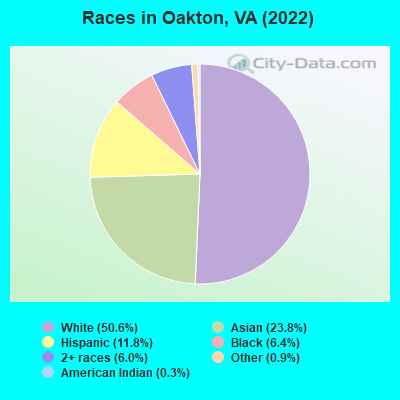
According to 2022 data, the most numerous races in Oakton, VA are White alone (18,366 residents), Black alone (2,332 residents), and Hispanic (4,296 residents). 63.8% of Oakton residents speak English at home. 32.7% of Oakton, VA residents are foreign-born (19.5% born in Asia, 6.2% born in Latin America, 3.4% born in Africa), which is 63.4% greater than the foreign-born rate of 12.0% across the entire state of Virginia.
Race distribution in Oakton
2000 2022
4,965,637 70.2% White alone 1,376,378 19.4% Black alone 329,540 4.7% Hispanic 259,277 3.7% Asian alone 114,022 1.6% Two or more races 18,596 0.3% American Indian alone 11,685 0.2% Other race alone 3,380 0.05% Native Hawaiian and Other
5,095,130 58.7% White alone 1,594,785 18.4% Black alone 905,750 10.4% Hispanic 602,881 6.9% Asian alone 406,047 4.7% Two or more races 60,419 0.7% Other race alone 11,738 0.1% American Indian alone 6,869 0.08% Native Hawaiian and Other
Income and house value in Oakton Median household income in 2022 $162,221 White non-Hispanic householders$111,260 Black householders$161,308 Asian householders$144,389 Some other race householders$158,135 Two or more races householders$113,896 Hispanic or Latino race householdersMedian 2022 house value $901,182 White Non-Hispanic householders$576,768 Black or African American householders$651,143 American Indian or Alaska Native householders $706,708 Asian householders$394,737 Some other race householders$832,017 Two or more races householders$562,298 Hispanic or Latino householders
Median age by race in Oakton
44.0 Median age for White residents43.3 44.6 39.4 Median age for Black or African American residents35.0 41.2 28.5 Median age for American Indian / Alaska Native residents48.2 24.1 38.2 Median age for Asian residents35.8 41.4 -666,666,666.0 Median age for Native Hawaiian / Pacific Islander residents-558,791,801.0 -584,518,166.9 38.1 Median age for Other race residents37.6 51.3 26.4 Median age for Two or more races residents34.1 24.1 43.8 Median age for White alone residents43.4 44.7 35.7 Median age for Hispanic or Latino residents36.0 34.3
Owner/renter occupied households by race in Oakton
House owners and renters - White residents 5,887 70.8% Owner occupied2,425 29.2% Renter occupiedHouse owners and renters - Black or African American residents 348 38.0% Owner occupied569 62.0% Renter occupiedHouse owners and renters - American Indian / Alaska Native residents 20 25.8% Owner occupied57 74.2% Renter occupiedHouse owners and renters - Asian residents 2,111 67.3% Owner occupied1,027 32.7% Renter occupiedHouse owners and renters - Other race residents 335 58.0% Owner occupied242 42.0% Renter occupiedHouse owners and renters - Two or more races residents 867 73.1% Owner occupied319 26.9% Renter occupiedHouse owners and renters - White alone residents 5,728 71.1% Owner occupied2,332 28.9% Renter occupiedHouse owners and renters - Hispanic or Latino residents 802 57.2% Owner occupied600 42.8% Renter occupied
Language usage in Oakton
English speakers - Total 63.8% of residents of Oakton speak English at home.
7.6% of residents speak Spanish at home 1,388 53.0% Speak English very well1,230 47.0% Speak English less than very well28.9% of residents speak other language at home 6,922 69.4% Speak English very well3,051 30.6% Speak English less than very well
English speakers - Born in the United States 89.5% of residents of Oakton speak English at home.
3.5% of residents speak Spanish at home 447 90.9% Speak English very well45 9.1% Speak English less than very well6.7% of residents speak other language at home 895 93.7% Speak English very well60 6.3% Speak English less than very well
English speakers - Native, born elsewhere 73.2% of residents of Oakton speak English at home.
8.9% of residents speak Spanish at home 98 88.3% Speak English very well13 11.7% Speak English less than very well16.9% of residents speak other language at home 210 100.0% Speak English very well
English speakers - Foreign-born 19.4% of residents of Oakton speak English at home.
15.2% of residents speak Spanish at home 735 40.8% Speak English very well1,066 59.2% Speak English less than very well65.9% of residents speak other language at home 4,847 62.0% Speak English very well2,971 38.0% Speak English less than very well
White (Caucasian) - Speak only English Native:
93.9% (14,638)Foreign-born:
28.6% (701)
White (Caucasian) - Speak another language Native:
6.2% (969)Foreign-born:
72.5% (1,773)
Black or African American - Speak only English Native:
90.6% (1,207)Foreign-born:
34.1% (306)
Black or African American - Speak another language Native:
8.9% (118)Foreign-born:
68.2% (612)
American Indian / Alaska Native - Speak another language Native:
36.5% (51)Foreign-born:
100.0% (21)
Asian - Speak only English Native:
59.0% (1,459)Foreign-born:
18.4% (1,089)
Asian - Speak another language Native:
40.1% (991)Foreign-born:
82.3% (4,858)
Other race - Speak only English Native:
73.3% (279)Foreign-born:
3.0% (34)
Other race - Speak another language Native:
35.8% (137)Foreign-born:
95.9% (1,086)
Two or more races - Speak only English Native:
79.5% (2,086)Foreign-born:
13.1% (112)
Two or more races - Speak another language Native:
20.1% (527)Foreign-born:
86.8% (738)
White alone - Speak only English Native:
93.7% (14,099)Foreign-born:
25.5% (666)
White alone - Speak another language Native:
6.2% (926)Foreign-born:
74.1% (1,937)
Hispanic or Latino - Speak only English Native:
70.1% (1,341)Foreign-born:
8.8% (180)
Hispanic or Latino - Speak another language Native:
34.1% (652)Foreign-born:
91.2% (1,858)
Foreign-born residents in Oakton 11,889 residents are foreign born (19.5% Asia , 6.2% Latin America , 3.4% Africa ).
This city:
32.7%Virginia:
12.6%
Marital status for residents in Oakton Marital status - White (Caucasian) population 15 years and over
Males 32.0% Never married55.4% Now married1.1% Separated2.8% Widowed8.6% DivorcedFemales 27.4% Never married53.6% Now married2.7% Separated7.2% Widowed9.1% DivorcedWomen who gave birth in the past 12 months Now married:
100.0% (163)Unmarried:
0.0% (0)
Women who did not give birth in the past 12 months Now married:
52.1% (2,104)Unmarried:
47.9% (1,937)
Marital status - Black or African American population 15 years and over
Males 45.5% Never married49.2% Now married0.0% Separated0.0% Widowed5.4% DivorcedFemales 49.9% Never married31.3% Now married1.8% Separated7.9% Widowed9.1% DivorcedWomen who gave birth in the past 12 months Now married:
0.0% (0)Unmarried:
100.0% (15)
Women who did not give birth in the past 12 months Now married:
30.2% (190)Unmarried:
69.8% (438)
Marital status - American Indian / Alaska Native population 15 years and over
Males 30.8% Never married69.2% Now married0.0% Separated0.0% Widowed0.0% DivorcedFemales 61.6% Never married24.7% Now married0.0% Separated0.0% Widowed13.7% DivorcedWomen who did not give birth in the past 12 months Now married:
28.6% (19)Unmarried:
71.4% (48)
Marital status - Asian population 15 years and over
Males 31.8% Never married65.5% Now married0.7% Separated0.0% Widowed2.0% DivorcedFemales 20.7% Never married70.4% Now married0.2% Separated2.6% Widowed6.1% DivorcedWomen who gave birth in the past 12 months Now married:
88.2% (127)Unmarried:
11.8% (17)
Women who did not give birth in the past 12 months Now married:
62.1% (1,446)Unmarried:
37.9% (882)
Marital status - Other race population 15 years and over
Males 37.3% Never married58.3% Now married0.0% Separated0.0% Widowed4.4% DivorcedFemales 58.9% Never married38.8% Now married0.0% Separated0.0% Widowed2.3% DivorcedWomen who did not give birth in the past 12 months Now married:
30.0% (133)Unmarried:
70.0% (310)
Marital status - Two or more races population 15 years and over
Males 27.8% Never married61.2% Now married0.1% Separated4.2% Widowed6.6% DivorcedFemales 52.2% Never married34.3% Now married0.0% Separated8.4% Widowed5.2% DivorcedWomen who gave birth in the past 12 months Now married:
25.0% (12)Unmarried:
75.0% (36)
Women who did not give birth in the past 12 months Now married:
28.2% (261)Unmarried:
71.8% (663)
Marital status - White alone, not Hispanic / Latino population 15 years and over
Males 31.0% Never married57.5% Now married1.2% Separated2.8% Widowed7.5% DivorcedFemales 26.8% Never married53.9% Now married2.9% Separated7.4% Widowed9.0% DivorcedWomen who gave birth in the past 12 months Now married:
100.0% (178)Unmarried:
0.0% (0)
Women who did not give birth in the past 12 months Now married:
52.8% (2,156)Unmarried:
47.2% (1,930)
Marital status - Hispanic or Latino population 15 years and over
Males 37.8% Never married46.9% Now married0.0% Separated3.5% Widowed11.7% DivorcedFemales 47.4% Never married41.8% Now married0.0% Separated3.5% Widowed7.3% DivorcedWomen who gave birth in the past 12 months Now married:
0.0% (0)Unmarried:
100.0% (27)
Women who did not give birth in the past 12 months Now married:
36.6% (337)Unmarried:
63.4% (585)
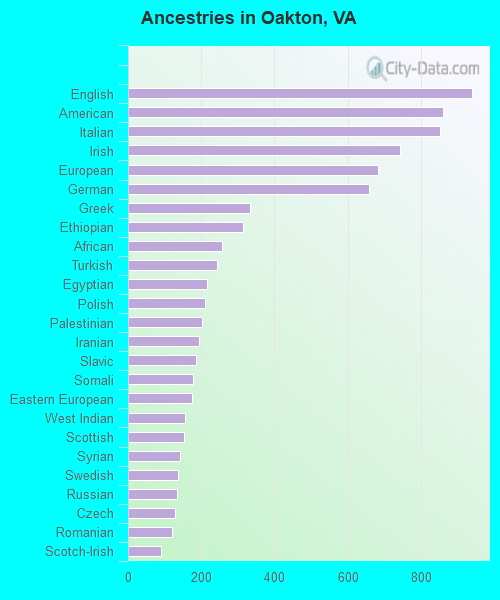
Ancestries in Oakton
939 4.6% English861 4.2% American853 4.2% Italian744 3.6% Irish682 3.3% European659 3.2% German332 1.6% Greek315 1.5% Ethiopian256 1.3% African244 1.2% Turkish215 1.1% Egyptian210 1.0% Polish203 1.0% Palestinian194 1.0% Iranian185 0.9% Slavic178 0.9% Somali176 0.9% Eastern European155 0.8% West Indian154 0.8% Scottish142 0.7% Syrian137 0.7% Swedish135 0.7% Russian127 0.6% Czech121 0.6% Romanian89 0.4% Scotch-Irish88 0.4% British83 0.4% Albanian80 0.4% Norwegian68 0.3% French64 0.3% Belgian63 0.3% Dutch59 0.3% Iraqi57 0.3% Afghan57 0.3% Serbian55 0.3% Brazilian46 0.2% Hungarian45 0.2% Ukrainian41 0.2% Jamaican38 0.2% Latvian33 0.2% Scandinavian26 0.1% Macedonian26 0.1% Barbadian20 0.10% Portuguese19 0.09% Australian19 0.09% Swiss18 0.09% Armenian17 0.08% Slovak15 0.07% Finnish11 0.05% Celtic9 0.04% Moroccan8 0.04% Lebanese8 0.04% New Zealander7 0.03% Welsh6 0.03% Croatian
Geographical mobility in Oakton Same house 1 year ago 16,681 88.5% White (Caucasian)1,991 86.7% Black or African American156 84.2% American Indian / Alaska Native7,213 84.0% Asian1,217 79.8% Other race3,262 79.3% Two or more races16,423 89.9% White alone, not Hispanic / Latino3,390 79.4% Hispanic or LatinoMoved within same county 674 3.6% White / Caucasian113 4.9% Black or African American639 7.4% Asian11 0.7% Other race302 7.4% Two or more races594 3.3% White alone, not Hispanic / Latino223 5.2% Hispanic or LatinoMoved within same state 766 4.1% White / Caucasian84 3.7% Black or African American176 2.1% Asian129 8.5% Other race41 1.0% Two or more races604 3.3% White alone, not Hispanic / Latino349 8.2% Hispanic or LatinoMoved from different state 675 3.6% White / Caucasian78 3.4% Black or African American21 11.2% American Indian / Alaska Native263 3.1% Asian41 2.7% Other race271 6.6% Two or more races547 3.0% White alone, not Hispanic / Latino303 7.1% Hispanic or LatinoMoved from abroad 89 0.5% White328 3.8% Asian137 9.0% Other race193 4.7% Two or more races94 0.5% White alone, not Hispanic / Latino47 1.1% Hispanic or Latino
Children Nativity (place of birth) in Oakton
Children under 6 years - Living with two parents Both parents native 962 100.0% NativeBoth parents foreign-born 446 88.6% Native57 11.4% Foreign-bornOne native, one foreign-born parent 378 100.0% NativeChildren under 6 years - Living with one parent Native parent 189 100.0% NativeForeign-born parent 50 44.4% Native62 55.6% Foreign-bornChildren 6 to 17 years - Living with two parents Both parents native 2,001 98.5% Native30 1.5% Foreign-bornBoth parents foreign-born 817 63.7% Native465 36.3% Foreign-bornOne native, one foreign-born parent 1,064 99.0% Native11 1.0% Foreign-bornChildren 6 to 17 years - Living with one parent Native parent 91 100.0% NativeForeign-born parent 611 61.8% Native379 38.2% Foreign-born
Place of birth for residents in Oakton 7,109 Asia3,174 Eastern Asia2,306 Americas2,249 Latin America2,018 South Central Asia1,428 China1,243 Africa1,157 South America1,134 Europe1,003 South Eastern Asia867 Central America862 Western Asia564 Eastern Africa488 Northern Africa450 Eastern Europe256 Northern Europe248 Western Europe225 Caribbean178 Southern Europe96 Oceania96 Australia and New Zealand Subregion76 Western Africa56 Northern America16 Middle Africa9 Southern Africa1,638 Korea1,271 China921 India532 Vietnam459 Egypt457 Ethiopia455 Peru449 El Salvador407 Nepal275 Philippines261 Bolivia235 Colombia216 Turkey198 Iran181 Mexico155 Pakistan134 Armenia134 Honduras129 Georgia126 Bangladesh124 Brazil121 Romania114 Syria106 Japan105 Germany105 Taiwan95 Iraq84 Cuba81 Australia78 Guatemala76 Ukraine74 Saudi Arabia72 Afghanistan70 England70 Russia67 Greece67 Ghana57 Eritrea56 Canada53 Cambodia52 Netherlands51 Hong Kong47 Spain43 St. Vincent and the Grenadines42 Laos41 Israel41 Barbados39 Poland39 Italy38 Belgium34 Indonesia33 Malaysia32 Trinidad and Tobago32 Ecuador31 Lebanon31 Serbia31 Uganda30 Chile26 Switzerland23 Thailand22 Portugal21 Ireland21 Jamaica20 Latvia19 Albania16 Cameroon14 New Zealand14 Panama14 Austria14 Somalia13 Morocco13 Sweden13 Jordan11 Scotland11 Argentina9 Azerbaijan9 South Africa9 France8 Costa Rica8 Belarus7 Uzbekistan7 United Kingdom6 Czechoslovakia5 Burma (Myanmar)3 Venezuela2 Kenya2 Bulgaria
Grandparents responsible for own grandchildren in Oakton
Grandparents (30 to 59 years) White / Caucasian 11 100.0% Not responsible for grandchildrenBlack or African American 7 100.0% Not responsible for grandchildrenWhite alone, not Hispanic / Latino 26 100.0% Not responsible for grandchildrenGrandparents (60 years and over) White / Caucasian 14 7.7% Responsible for grandchildren172 92.3% Not responsible for grandchildrenBlack or African American 9 100.0% Not responsible for grandchildrenWhite alone, not Hispanic / Latino 16 8.6% Responsible for grandchildren168 91.4% Not responsible for grandchildren