Races in Oak Creek, Wisconsin (WI) Detailed Stats
Data:
Races - White alone (%)
Races - White alone (% change since 2000)
Races - Black alone (%)
Races - Black alone (% change since 2000)
Races - American Indian alone (%)
Races - American Indian alone (% change since 2000)
Races - Asian alone (%)
Races - Asian alone (% change since 2000)
Races - Hispanic (%)
Races - Hispanic (% change since 2000)
Races - Native Hawaiian and Other Pacific Islander alone (%)
Races - Native Hawaiian and Other Pacific Islander alone (% change since 2000)
Races - Two or more races(%)
Races - Two or more races(% change since 2000)
Races - Other race alone (%)
Races - Other race alone (% change since 2000)
Racial diversity
Place of birth - Born in state of residence (%)
Place of birth - Born in state of residence (%) - White
Place of birth - Born in state of residence (%) - Black or African American
Place of birth - Born in state of residence (%) - Asian
Place of birth - Born in state of residence (%) - Hispanic or Latino
Place of birth - Born in state of residence (%) - American Indian and Alaska Native
Place of birth - Born in state of residence (%) - Multirace
Place of birth - Born in state of residence (%) - Other Race
Place of birth - Born in other state (%)
Place of birth - Born in other state (%) - White
Place of birth - Born in other state (%) - Black or African American
Place of birth - Born in other state (%) - Asian
Place of birth - Born in other state (%) - Hispanic or Latino
Place of birth - Born in other state (%) - American Indian and Alaska Native
Place of birth - Born in other state (%) - Multirace
Place of birth - Born in other state (%) - Other Race
Place of birth - Native, outside of US (%)
Place of birth - Native, outside of US (%) - White
Place of birth - Native, outside of US (%) - Black or African American
Place of birth - Native, outside of US (%) - Asian
Place of birth - Native, outside of US (%) - Hispanic or Latino
Place of birth - Native, outside of US (%) - American Indian and Alaska Native
Place of birth - Native, outside of US (%) - Multirace
Place of birth - Native, outside of US (%) - Other Race
Place of birth - Foreign born (%)
Place of birth - Foreign born (%) - White
Place of birth - Foreign born (%) - Black or African American
Place of birth - Foreign born (%) - Asian
Place of birth - Foreign born (%) - Hispanic or Latino
Place of birth - Foreign born (%) - American Indian and Alaska Native
Place of birth - Foreign born (%) - Multirace
Place of birth - Foreign born (%) - Other Race
Residents speaking English at home (%)
Residents speaking English at home - Born in the United States (%)
Residents speaking English at home - Native, born elsewhere (%)
Residents speaking English at home - Foreign born (%)
Residents speaking Spanish at home (%)
Residents speaking Spanish at home - Born in the United States (%)
Residents speaking Spanish at home - Native, born elsewhere (%)
Residents speaking Spanish at home - Foreign born (%)
Residents speaking other language at home (%)
Residents speaking other language at home - Born in the United States (%)
Residents speaking other language at home - Native, born elsewhere (%)
Residents speaking other language at home - Foreign born (%)
Marital status - Never married (%)
Marital status - Now married (%)
Marital status - Separated (%)
Marital status - Widowed (%)
Marital status - Divorced (%)
Ancestries Reported - Arab (%)
Ancestries Reported - Czech (%)
Ancestries Reported - Danish (%)
Ancestries Reported - Dutch (%)
Ancestries Reported - English (%)
Ancestries Reported - French (%)
Ancestries Reported - French Canadian (%)
Ancestries Reported - German (%)
Ancestries Reported - Greek (%)
Ancestries Reported - Hungarian (%)
Ancestries Reported - Irish (%)
Ancestries Reported - Italian (%)
Ancestries Reported - Lithuanian (%)
Ancestries Reported - Norwegian (%)
Ancestries Reported - Polish (%)
Ancestries Reported - Portuguese (%)
Ancestries Reported - Russian (%)
Ancestries Reported - Scotch-Irish (%)
Ancestries Reported - Scottish (%)
Ancestries Reported - Slovak (%)
Ancestries Reported - Subsaharan African (%)
Ancestries Reported - Swedish (%)
Ancestries Reported - Swiss (%)
Ancestries Reported - Ukrainian (%)
Ancestries Reported - United States (%)
Ancestries Reported - Welsh (%)
Ancestries Reported - West Indian (%)
Ancestries Reported - Other (%)
Geographical mobility - Same house 1 year ago (%)
Geographical mobility - Same house 1 year ago (%) - White
Geographical mobility - Same house 1 year ago (%) - Black or African American
Geographical mobility - Same house 1 year ago (%) - Asian
Geographical mobility - Same house 1 year ago (%) - Hispanic or Latino
Geographical mobility - Same house 1 year ago (%) - American Indian and Alaska Native
Geographical mobility - Same house 1 year ago (%) - Multirace
Geographical mobility - Same house 1 year ago (%) - Other Race
Geographical mobility - Moved within same county (%)
Geographical mobility - Moved within same county (%) - White
Geographical mobility - Moved within same county (%) - Black or African American
Geographical mobility - Moved within same county (%) - Asian
Geographical mobility - Moved within same county (%) - Hispanic or Latino
Geographical mobility - Moved within same county (%) - American Indian and Alaska Native
Geographical mobility - Moved within same county (%) - Multirace
Geographical mobility - Moved within same county (%) - Other Race
Geographical mobility - Moved from different county within same state (%)
Geographical mobility - Moved from different county within same state (%) - White
Geographical mobility - Moved from different county within same state (%) - Black or African American
Geographical mobility - Moved from different county within same state (%) - Asian
Geographical mobility - Moved from different county within same state (%) - Hispanic or Latino
Geographical mobility - Moved from different county within same state (%) - American Indian and Alaska Native
Geographical mobility - Moved from different county within same state (%) - Multirace
Geographical mobility - Moved from different county within same state (%) - Other Race
Geographical mobility - Moved from different state (%)
Geographical mobility - Moved from different state (%) - White
Geographical mobility - Moved from different state (%) - Black or African American
Geographical mobility - Moved from different state (%) - Asian
Geographical mobility - Moved from different state (%) - Hispanic or Latino
Geographical mobility - Moved from different state (%) - American Indian and Alaska Native
Geographical mobility - Moved from different state (%) - Multirace
Geographical mobility - Moved from different state (%) - Other Race
Geographical mobility - Moved from abroad (%)
Geographical mobility - Moved from abroad (%) - White
Geographical mobility - Moved from abroad (%) - Black or African American
Geographical mobility - Moved from abroad (%) - Asian
Geographical mobility - Moved from abroad (%) - Hispanic or Latino
Geographical mobility - Moved from abroad (%) - American Indian and Alaska Native
Geographical mobility - Moved from abroad (%) - Multirace
Geographical mobility - Moved from abroad (%) - Other Race
Place of birth for the foreign-born population - Ireland (%)
Place of birth for the foreign-born population - Denmark (%)
Place of birth for the foreign-born population - Norway (%)
Place of birth for the foreign-born population - Sweden (%)
Place of birth for the foreign-born population - United Kingdom (%)
Place of birth for the foreign-born population - England (%)
Place of birth for the foreign-born population - Scotland (%)
Place of birth for the foreign-born population - Other Northern Europe (%)
Place of birth for the foreign-born population - Austria (%)
Place of birth for the foreign-born population - Belgium (%)
Place of birth for the foreign-born population - France (%)
Place of birth for the foreign-born population - Germany (%)
Place of birth for the foreign-born population - Netherlands (%)
Place of birth for the foreign-born population - Switzerland (%)
Place of birth for the foreign-born population - Other Western Europe (%)
Place of birth for the foreign-born population - Greece (%)
Place of birth for the foreign-born population - Italy (%)
Place of birth for the foreign-born population - Portugal (%)
Place of birth for the foreign-born population - Spain (%)
Place of birth for the foreign-born population - Other Southern Europe (%)
Place of birth for the foreign-born population - Albania (%)
Place of birth for the foreign-born population - Belarus (%)
Place of birth for the foreign-born population - Bosnia and Herzegovina (%)
Place of birth for the foreign-born population - Bulgaria (%)
Place of birth for the foreign-born population - Croatia (%)
Place of birth for the foreign-born population - Czechoslovakia (%)
Place of birth for the foreign-born population - Hungary (%)
Place of birth for the foreign-born population - Latvia (%)
Place of birth for the foreign-born population - Lithuania (%)
Place of birth for the foreign-born population - North Macedonia (Macedonia) (%)
Place of birth for the foreign-born population - Moldova (%)
Place of birth for the foreign-born population - Poland (%)
Place of birth for the foreign-born population - Romania (%)
Place of birth for the foreign-born population - Russia (%)
Place of birth for the foreign-born population - Serbia (%)
Place of birth for the foreign-born population - Ukraine (%)
Place of birth for the foreign-born population - Other Eastern Europe (%)
Place of birth for the foreign-born population - China (%)
Place of birth for the foreign-born population - Hong Kong (%)
Place of birth for the foreign-born population - Taiwan (%)
Place of birth for the foreign-born population - Japan (%)
Place of birth for the foreign-born population - Korea (%)
Place of birth for the foreign-born population - Other Eastern Asia (%)
Place of birth for the foreign-born population - Afghanistan (%)
Place of birth for the foreign-born population - Bangladesh (%)
Place of birth for the foreign-born population - India (%)
Place of birth for the foreign-born population - Iran (%)
Place of birth for the foreign-born population - Kazakhstan (%)
Place of birth for the foreign-born population - Nepal (%)
Place of birth for the foreign-born population - Pakistan (%)
Place of birth for the foreign-born population - Sri Lanka (%)
Place of birth for the foreign-born population - Uzbekistan (%)
Place of birth for the foreign-born population - Other South Central Asia (%)
Place of birth for the foreign-born population - Burma (%)
Place of birth for the foreign-born population - Cambodia (%)
Place of birth for the foreign-born population - Indonesia (%)
Place of birth for the foreign-born population - Laos (%)
Place of birth for the foreign-born population - Malaysia (%)
Place of birth for the foreign-born population - Philippines (%)
Place of birth for the foreign-born population - Singapore (%)
Place of birth for the foreign-born population - Thailand (%)
Place of birth for the foreign-born population - Vietnam (%)
Place of birth for the foreign-born population - Other South Eastern Asia (%)
Place of birth for the foreign-born population - Armenia (%)
Place of birth for the foreign-born population - Iraq (%)
Place of birth for the foreign-born population - Israel (%)
Place of birth for the foreign-born population - Jordan (%)
Place of birth for the foreign-born population - Kuwait (%)
Place of birth for the foreign-born population - Lebanon (%)
Place of birth for the foreign-born population - Saudi Arabia (%)
Place of birth for the foreign-born population - Syria (%)
Place of birth for the foreign-born population - Turkey (%)
Place of birth for the foreign-born population - Yemen (%)
Place of birth for the foreign-born population - Other Western Asia (%)
Place of birth for the foreign-born population - Eritrea (%)
Place of birth for the foreign-born population - Ethiopia (%)
Place of birth for the foreign-born population - Kenya (%)
Place of birth for the foreign-born population - Somalia (%)
Place of birth for the foreign-born population - Uganda (%)
Place of birth for the foreign-born population - Zimbabwe (%)
Place of birth for the foreign-born population - Other Eastern Africa (%)
Place of birth for the foreign-born population - Cameroon (%)
Place of birth for the foreign-born population - Congo (%)
Place of birth for the foreign-born population - Democratic Republic of Congo (Zaire) (%)
Place of birth for the foreign-born population - Other Middle Africa (%)
Place of birth for the foreign-born population - Egypt (%)
Place of birth for the foreign-born population - Morocco (%)
Place of birth for the foreign-born population - Sudan (%)
Place of birth for the foreign-born population - Other Northern Africa (%)
Place of birth for the foreign-born population - South Africa (%)
Place of birth for the foreign-born population - Other Southern Africa (%)
Place of birth for the foreign-born population - Cabo Verde (%)
Place of birth for the foreign-born population - Ghana (%)
Place of birth for the foreign-born population - Liberia (%)
Place of birth for the foreign-born population - Nigeria (%)
Place of birth for the foreign-born population - Senegal (%)
Place of birth for the foreign-born population - Sierra Leone (%)
Place of birth for the foreign-born population - Other Western Africa (%)
Place of birth for the foreign-born population - Australia (%)
Place of birth for the foreign-born population - New Zealand (%)
Place of birth for the foreign-born population - Fiji (%)
Place of birth for the foreign-born population - Micronesia (%)
Place of birth for the foreign-born population - Bahamas (%)
Place of birth for the foreign-born population - Barbados (%)
Place of birth for the foreign-born population - Cuba (%)
Place of birth for the foreign-born population - Dominica (%)
Place of birth for the foreign-born population - Dominican Republic (%)
Place of birth for the foreign-born population - Grenada (%)
Place of birth for the foreign-born population - Haiti (%)
Place of birth for the foreign-born population - Jamaica (%)
Place of birth for the foreign-born population - St. Vincent and the Grenadines (%)
Place of birth for the foreign-born population - Trinidad and Tobago (%)
Place of birth for the foreign-born population - West Indies (%)
Place of birth for the foreign-born population - Other Caribbean (%)
Place of birth for the foreign-born population - Belize (%)
Place of birth for the foreign-born population - Costa Rica (%)
Place of birth for the foreign-born population - El Salvador (%)
Place of birth for the foreign-born population - Guatemala (%)
Place of birth for the foreign-born population - Honduras (%)
Place of birth for the foreign-born population - Mexico (%)
Place of birth for the foreign-born population - Nicaragua (%)
Place of birth for the foreign-born population - Panama (%)
Place of birth for the foreign-born population - Other Central America (%)
Place of birth for the foreign-born population - Argentina (%)
Place of birth for the foreign-born population - Bolivia (%)
Place of birth for the foreign-born population - Brazil (%)
Place of birth for the foreign-born population - Chile (%)
Place of birth for the foreign-born population - Colombia (%)
Place of birth for the foreign-born population - Ecuador (%)
Place of birth for the foreign-born population - Guyana (%)
Place of birth for the foreign-born population - Peru (%)
Place of birth for the foreign-born population - Uruguay (%)
Place of birth for the foreign-born population - Venezuela (%)
Place of birth for the foreign-born population - Other South America (%)
Place of birth for the foreign-born population - Canada (%)
Place of birth for the foreign-born population - Other Northern America (%)
Place of birth for the foreign-born population - Other (%)
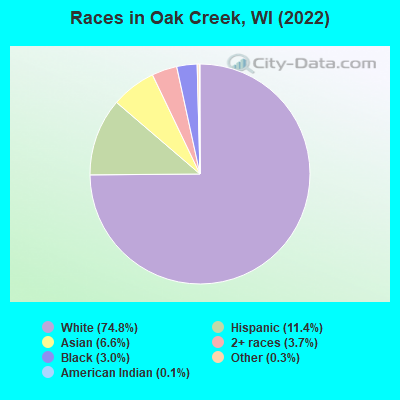
According to 2022 data, the most numerous races in Oak Creek, WI are White alone (26,717 residents), Hispanic (4,074 residents), and Black alone (1,081 residents). 83.4% of Oak Creek residents speak English at home. 12.0% of Oak Creek, WI residents are foreign-born (5.9% born in Asia, 2.6% born in Europe, 1.9% born in Latin America, 1.3% born in Africa), which is 58.3% greater than the foreign-born rate of 5.0% across the entire state of Wisconsin.
Race distribution in Oak Creek
2000 2022
4,681,630 87.3% White alone 300,245 5.6% Black alone 192,921 3.6% Hispanic 87,995 1.6% Asian alone 51,921 1.0% Two or more races 43,980 0.8% American Indian alone 3,637 0.07% Other race alone 1,346 0.03% Native Hawaiian and Other
4,654,031 79.0% White alone 447,022 7.6% Hispanic 345,678 5.9% Black alone 217,532 3.7% Two or more races 172,242 2.9% Asian alone 33,762 0.6% American Indian alone 19,680 0.3% Other race alone 2,592 0.04% Native Hawaiian and Other
Income and house value in Oak Creek Median household income in 2022 $81,201 White non-Hispanic householders$84,595 Black householders$75,837 American Indian and Alaska Native householders$122,546 Asian householders$112,555 Some other race householders$110,151 Two or more races householders$97,039 Hispanic or Latino race householdersMedian 2022 house value $311,974 White Non-Hispanic householders$404,087 Black or African American householders$308,164 American Indian or Alaska Native householders $329,231 Asian householders$398,932 Some other race householders$219,637 Two or more races householders$273,649 Hispanic or Latino householders
Median age by race in Oak Creek
43.3 Median age for White residents42.3 44.2 35.1 Median age for Black or African American residents41.2 29.8 51.5 Median age for American Indian / Alaska Native residents31.0 -627,763,040.9 33.2 Median age for Asian residents32.8 33.4 -825,688,072.6 Median age for Native Hawaiian / Pacific Islander residents-862,745,097.2 -732,444,443.7 31.4 Median age for Other race residents37.0 28.8 29.5 Median age for Two or more races residents40.7 23.0 43.4 Median age for White alone residents42.3 43.9 28.5 Median age for Hispanic or Latino residents33.1 27.4
Owner/renter occupied households by race in Oak Creek
House owners and renters - White residents 7,733 60.9% Owner occupied4,961 39.1% Renter occupiedHouse owners and renters - Black or African American residents 223 43.8% Owner occupied287 56.2% Renter occupiedHouse owners and renters - American Indian / Alaska Native residents 5 9.1% Owner occupied45 90.9% Renter occupiedHouse owners and renters - Asian residents 258 41.2% Owner occupied368 58.8% Renter occupiedHouse owners and renters - Other race residents 89 58.5% Owner occupied63 41.5% Renter occupiedHouse owners and renters - Two or more races residents 771 70.9% Owner occupied316 29.1% Renter occupiedHouse owners and renters - White alone residents 7,699 61.3% Owner occupied4,854 38.7% Renter occupiedHouse owners and renters - Hispanic or Latino residents 484 47.8% Owner occupied529 52.2% Renter occupied
Language usage in Oak Creek
English speakers - Total 83.4% of residents of Oak Creek speak English at home.
5.5% of residents speak Spanish at home 1,266 67.4% Speak English very well612 32.6% Speak English less than very well11.2% of residents speak other language at home 2,674 70.0% Speak English very well1,148 30.0% Speak English less than very well
English speakers - Born in the United States 87.2% of residents of Oak Creek speak English at home.
7.4% of residents speak Spanish at home 410 88.2% Speak English very well55 11.8% Speak English less than very well6.1% of residents speak other language at home 288 74.8% Speak English very well97 25.2% Speak English less than very well
English speakers - Native, born elsewhere 45.1% of residents of Oak Creek speak English at home.
46.9% of residents speak Spanish at home 141 58.5% Speak English very well100 41.5% Speak English less than very well12.6% of residents speak other language at home 65 100.0% Speak English very well
English speakers - Foreign-born 13.9% of residents of Oak Creek speak English at home.
13.5% of residents speak Spanish at home 225 38.7% Speak English very well356 61.3% Speak English less than very well70.8% of residents speak other language at home 2,036 66.6% Speak English very well1,019 33.4% Speak English less than very well
White (Caucasian) - Speak only English Native:
98.9% (24,801)Foreign-born:
30.9% (282)
White (Caucasian) - Speak another language Native:
2.2% (548)Foreign-born:
69.8% (637)
Black or African American - Speak only English Native:
93.8% (642)Foreign-born:
1.6% (8)
Black or African American - Speak another language Native:
4.0% (27)Foreign-born:
100.0% (509)
Asian - Speak only English Native:
38.4% (156)Foreign-born:
11.8% (200)
Asian - Speak another language Native:
62.0% (251)Foreign-born:
88.3% (1,491)
Other race - Speak another language Native:
37.5% (150)Foreign-born:
94.6% (97)
Two or more races - Speak another language Native:
33.7% (1,122)Foreign-born:
100.0% (871)
White alone - Speak only English Native:
98.3% (24,038)Foreign-born:
22.6% (282)
White alone - Speak another language Native:
1.8% (431)Foreign-born:
78.0% (972)
Hispanic or Latino - Speak only English Native:
63.0% (2,068)Foreign-born:
3.9% (26)
Hispanic or Latino - Speak another language Native:
37.7% (1,236)Foreign-born:
95.9% (639)
Foreign-born residents in Oak Creek 4,288 residents are foreign born (5.9% Asia , 2.6% Europe , 1.9% Latin America , 1.3% Africa ).
This city:
12.0%Wisconsin:
5.0%
Marital status for residents in Oak Creek Marital status - White (Caucasian) population 15 years and over
Males 35.0% Never married50.3% Now married0.5% Separated2.6% Widowed11.7% DivorcedFemales 24.4% Never married53.6% Now married1.7% Separated5.7% Widowed14.6% DivorcedWomen who gave birth in the past 12 months Now married:
81.0% (102)Unmarried:
19.0% (24)
Women who did not give birth in the past 12 months Now married:
49.3% (2,748)Unmarried:
50.7% (2,823)
Marital status - Black or African American population 15 years and over
Males 37.3% Never married39.7% Now married0.0% Separated11.4% Widowed11.6% DivorcedFemales 62.5% Never married21.0% Now married5.2% Separated1.7% Widowed9.6% DivorcedWomen who gave birth in the past 12 months Now married:
58.3% (27)Unmarried:
41.7% (19)
Women who did not give birth in the past 12 months Now married:
14.7% (42)Unmarried:
85.3% (243)
Marital status - American Indian / Alaska Native population 15 years and over
Males 77.3% Never married0.0% Now married0.0% Separated22.7% Widowed0.0% DivorcedFemales 46.7% Never married0.0% Now married0.0% Separated0.0% Widowed53.3% DivorcedMarital status - Asian population 15 years and over
Males 3.4% Never married94.2% Now married0.0% Separated0.0% Widowed2.4% DivorcedFemales 35.2% Never married53.7% Now married0.0% Separated11.1% Widowed0.0% DivorcedWomen who gave birth in the past 12 months Now married:
100.0% (11)Unmarried:
0.0% (0)
Women who did not give birth in the past 12 months Now married:
51.9% (490)Unmarried:
48.1% (454)
Marital status - Other race population 15 years and over
Males 40.2% Never married48.2% Now married0.0% Separated0.0% Widowed11.6% DivorcedFemales 48.5% Never married39.0% Now married0.0% Separated4.0% Widowed8.5% DivorcedWomen who gave birth in the past 12 months Now married:
0.0% (0)Unmarried:
100.0% (10)
Women who did not give birth in the past 12 months Now married:
34.2% (69)Unmarried:
65.8% (133)
Marital status - Two or more races population 15 years and over
Males 37.0% Never married54.5% Now married0.0% Separated0.0% Widowed8.5% DivorcedFemales 49.9% Never married38.4% Now married0.0% Separated9.5% Widowed2.2% DivorcedWomen who gave birth in the past 12 months Now married:
100.0% (174)Unmarried:
0.0% (0)
Women who did not give birth in the past 12 months Now married:
25.7% (271)Unmarried:
74.3% (785)
Marital status - White alone, not Hispanic / Latino population 15 years and over
Males 34.7% Never married50.8% Now married0.5% Separated2.7% Widowed11.3% DivorcedFemales 23.1% Never married54.4% Now married1.4% Separated5.9% Widowed15.2% DivorcedWomen who gave birth in the past 12 months Now married:
81.0% (108)Unmarried:
19.0% (25)
Women who did not give birth in the past 12 months Now married:
50.2% (2,709)Unmarried:
49.8% (2,684)
Marital status - Hispanic or Latino population 15 years and over
Males 38.6% Never married46.3% Now married0.0% Separated0.0% Widowed15.2% DivorcedFemales 47.8% Never married40.0% Now married3.1% Separated4.5% Widowed4.6% DivorcedWomen who gave birth in the past 12 months Now married:
84.7% (97)Unmarried:
15.3% (18)
Women who did not give birth in the past 12 months Now married:
34.2% (445)Unmarried:
65.8% (857)
Ancestries in Oak Creek
3,559 21.4% German1,549 9.3% Polish869 5.2% American722 4.3% Italian433 2.6% English402 2.4% Palestinian399 2.4% Albanian313 1.9% Irish262 1.6% Swedish252 1.5% Somali207 1.2% European199 1.2% Serbian169 1.0% Kenyan143 0.9% Hungarian110 0.7% Moroccan110 0.7% Norwegian103 0.6% Finnish100 0.6% Greek95 0.6% Turkish94 0.6% Danish82 0.5% French Canadian71 0.4% Austrian71 0.4% Croatian67 0.4% Ghanaian63 0.4% Scottish55 0.3% Ethiopian50 0.3% Northern European47 0.3% Brazilian45 0.3% Latvian35 0.2% Arab33 0.2% Eastern European30 0.2% Czechoslovakian29 0.2% Romanian29 0.2% Russian26 0.2% Dutch26 0.2% Slovak25 0.2% Ukrainian24 0.1% French22 0.1% German Russian22 0.1% South African21 0.1% Lithuanian12 0.07% Slovene12 0.07% Swiss11 0.07% Canadian8 0.05% Scotch-Irish7 0.04% African4 0.02% Nigerian1 0.01% Scandinavian
Geographical mobility in Oak Creek Same house 1 year ago 23,535 88.0% White (Caucasian)933 84.6% Black or African American16 20.5% American Indian / Alaska Native1,856 78.9% Asian416 76.1% Other race3,840 86.4% Two or more races23,585 88.7% White alone, not Hispanic / Latino3,377 83.6% Hispanic or LatinoMoved within same county 1,887 7.1% White / Caucasian111 10.1% Black or African American53 69.7% American Indian / Alaska Native132 5.6% Asian96 17.6% Other race142 3.2% Two or more races1,930 7.3% White alone, not Hispanic / Latino178 4.4% Hispanic or LatinoMoved within same state 871 3.3% White / Caucasian26 2.4% Black or African American5 0.2% Asian14 2.6% Other race208 4.7% Two or more races611 2.3% White alone, not Hispanic / Latino442 10.9% Hispanic or LatinoMoved from different state 395 1.5% White / Caucasian35 3.2% Black or African American342 14.5% Asian13 2.5% Other race212 4.8% Two or more races369 1.4% White alone, not Hispanic / Latino93 2.3% Hispanic or LatinoMoved from abroad 29 0.1% White70 3.0% Asian10 1.8% Other race38 0.1% White alone, not Hispanic / Latino
Children Nativity (place of birth) in Oak Creek
Children under 6 years - Living with two parents Both parents native 996 98.0% Native21 2.0% Foreign-bornBoth parents foreign-born 294 75.9% Native93 24.1% Foreign-bornOne native, one foreign-born parent 53 100.0% NativeChildren under 6 years - Living with one parent Native parent 324 100.0% NativeForeign-born parent 13 9.1% Native126 90.9% Foreign-bornChildren 6 to 17 years - Living with two parents Both parents native 2,992 98.6% Native42 1.4% Foreign-bornBoth parents foreign-born 479 82.5% Native101 17.5% Foreign-bornOne native, one foreign-born parent 212 100.0% NativeChildren 6 to 17 years - Living with one parent Native parent 1,405 100.0% NativeForeign-born parent 178 54.9% Native146 45.1% Foreign-born
Grandparents responsible for own grandchildren in Oak Creek
Grandparents (30 to 59 years) White / Caucasian 62 53.6% Responsible for grandchildren54 46.4% Not responsible for grandchildrenAsian 29 100.0% Not responsible for grandchildrenWhite alone, not Hispanic / Latino 84 68.9% Responsible for grandchildren38 31.1% Not responsible for grandchildrenGrandparents (60 years and over) White / Caucasian 21 16.4% Responsible for grandchildren105 83.6% Not responsible for grandchildrenAsian 19 20.2% Responsible for grandchildren74 79.8% Not responsible for grandchildrenWhite alone, not Hispanic / Latino 23 15.8% Responsible for grandchildren121 84.2% Not responsible for grandchildren