Races in Northeast Brazos, Texas (TX) Detailed Stats
Ancestries, Foreign-born residents, place of birth
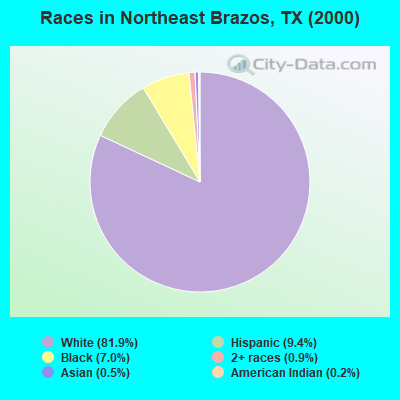
Race distribution in Northeast Brazos

- 9,16981.9%White alone
- 1,0549.4%Hispanic
- 7887.0%Black alone
- 1010.9%Two or more races
- 510.5%Asian alone
- 260.2%American Indian alone
- 90.08%Other race alone
2000
2022
-
- 10,933,31352.4%White alone
- 6,669,66632.0%Hispanic
- 2,364,25511.3%Black alone
- 554,4452.7%Asian alone
- 230,5671.1%Two or more races
- 68,8590.3%American Indian alone
- 19,9580.10%Other race alone
- 10,7570.05%Native Hawaiian and Other
Pacific Islander alone

-
- 12,070,64240.2%Hispanic
- 11,683,43038.9%White alone
- 3,508,70611.7%Black alone
- 1,608,1735.4%Asian alone
- 956,5603.2%Two or more races
- 125,7630.4%Other race alone
- 47,0230.2%American Indian alone
- 29,2750.10%Native Hawaiian and Other
Pacific Islander alone

Income and house value in Northeast Brazos
- Median household income in 2022
- $103,015White non-Hispanic householders
- $72,755Black householders
- $97,878Some other race householders
- $108,065Two or more races householders
- $136,651Hispanic or Latino race householders
- Median 2022 house value
- $378,807White Non-Hispanic householders
- $369,538Black or African American householders
- $73,250Some other race householders
- $154,871Two or more races householders
- $401,529Hispanic or Latino householders
Household income for White non-Hispanic householders

Household income for Black householders

Household income for Two or more races householders

Household income for Hispanic or Latino race householders

Zip code: 77808