Races in Newport, Oregon (OR) Detailed Stats
Data:
Races - White alone (%)
Races - White alone (% change since 2000)
Races - Black alone (%)
Races - Black alone (% change since 2000)
Races - American Indian alone (%)
Races - American Indian alone (% change since 2000)
Races - Asian alone (%)
Races - Asian alone (% change since 2000)
Races - Hispanic (%)
Races - Hispanic (% change since 2000)
Races - Native Hawaiian and Other Pacific Islander alone (%)
Races - Native Hawaiian and Other Pacific Islander alone (% change since 2000)
Races - Two or more races(%)
Races - Two or more races(% change since 2000)
Races - Other race alone (%)
Races - Other race alone (% change since 2000)
Racial diversity
Place of birth - Born in state of residence (%)
Place of birth - Born in state of residence (%) - White
Place of birth - Born in state of residence (%) - Black or African American
Place of birth - Born in state of residence (%) - Asian
Place of birth - Born in state of residence (%) - Hispanic or Latino
Place of birth - Born in state of residence (%) - American Indian and Alaska Native
Place of birth - Born in state of residence (%) - Multirace
Place of birth - Born in state of residence (%) - Other Race
Place of birth - Born in other state (%)
Place of birth - Born in other state (%) - White
Place of birth - Born in other state (%) - Black or African American
Place of birth - Born in other state (%) - Asian
Place of birth - Born in other state (%) - Hispanic or Latino
Place of birth - Born in other state (%) - American Indian and Alaska Native
Place of birth - Born in other state (%) - Multirace
Place of birth - Born in other state (%) - Other Race
Place of birth - Native, outside of US (%)
Place of birth - Native, outside of US (%) - White
Place of birth - Native, outside of US (%) - Black or African American
Place of birth - Native, outside of US (%) - Asian
Place of birth - Native, outside of US (%) - Hispanic or Latino
Place of birth - Native, outside of US (%) - American Indian and Alaska Native
Place of birth - Native, outside of US (%) - Multirace
Place of birth - Native, outside of US (%) - Other Race
Place of birth - Foreign born (%)
Place of birth - Foreign born (%) - White
Place of birth - Foreign born (%) - Black or African American
Place of birth - Foreign born (%) - Asian
Place of birth - Foreign born (%) - Hispanic or Latino
Place of birth - Foreign born (%) - American Indian and Alaska Native
Place of birth - Foreign born (%) - Multirace
Place of birth - Foreign born (%) - Other Race
Residents speaking English at home (%)
Residents speaking English at home - Born in the United States (%)
Residents speaking English at home - Native, born elsewhere (%)
Residents speaking English at home - Foreign born (%)
Residents speaking Spanish at home (%)
Residents speaking Spanish at home - Born in the United States (%)
Residents speaking Spanish at home - Native, born elsewhere (%)
Residents speaking Spanish at home - Foreign born (%)
Residents speaking other language at home (%)
Residents speaking other language at home - Born in the United States (%)
Residents speaking other language at home - Native, born elsewhere (%)
Residents speaking other language at home - Foreign born (%)
Marital status - Never married (%)
Marital status - Now married (%)
Marital status - Separated (%)
Marital status - Widowed (%)
Marital status - Divorced (%)
Ancestries Reported - Arab (%)
Ancestries Reported - Czech (%)
Ancestries Reported - Danish (%)
Ancestries Reported - Dutch (%)
Ancestries Reported - English (%)
Ancestries Reported - French (%)
Ancestries Reported - French Canadian (%)
Ancestries Reported - German (%)
Ancestries Reported - Greek (%)
Ancestries Reported - Hungarian (%)
Ancestries Reported - Irish (%)
Ancestries Reported - Italian (%)
Ancestries Reported - Lithuanian (%)
Ancestries Reported - Norwegian (%)
Ancestries Reported - Polish (%)
Ancestries Reported - Portuguese (%)
Ancestries Reported - Russian (%)
Ancestries Reported - Scotch-Irish (%)
Ancestries Reported - Scottish (%)
Ancestries Reported - Slovak (%)
Ancestries Reported - Subsaharan African (%)
Ancestries Reported - Swedish (%)
Ancestries Reported - Swiss (%)
Ancestries Reported - Ukrainian (%)
Ancestries Reported - United States (%)
Ancestries Reported - Welsh (%)
Ancestries Reported - West Indian (%)
Ancestries Reported - Other (%)
Geographical mobility - Same house 1 year ago (%)
Geographical mobility - Same house 1 year ago (%) - White
Geographical mobility - Same house 1 year ago (%) - Black or African American
Geographical mobility - Same house 1 year ago (%) - Asian
Geographical mobility - Same house 1 year ago (%) - Hispanic or Latino
Geographical mobility - Same house 1 year ago (%) - American Indian and Alaska Native
Geographical mobility - Same house 1 year ago (%) - Multirace
Geographical mobility - Same house 1 year ago (%) - Other Race
Geographical mobility - Moved within same county (%)
Geographical mobility - Moved within same county (%) - White
Geographical mobility - Moved within same county (%) - Black or African American
Geographical mobility - Moved within same county (%) - Asian
Geographical mobility - Moved within same county (%) - Hispanic or Latino
Geographical mobility - Moved within same county (%) - American Indian and Alaska Native
Geographical mobility - Moved within same county (%) - Multirace
Geographical mobility - Moved within same county (%) - Other Race
Geographical mobility - Moved from different county within same state (%)
Geographical mobility - Moved from different county within same state (%) - White
Geographical mobility - Moved from different county within same state (%) - Black or African American
Geographical mobility - Moved from different county within same state (%) - Asian
Geographical mobility - Moved from different county within same state (%) - Hispanic or Latino
Geographical mobility - Moved from different county within same state (%) - American Indian and Alaska Native
Geographical mobility - Moved from different county within same state (%) - Multirace
Geographical mobility - Moved from different county within same state (%) - Other Race
Geographical mobility - Moved from different state (%)
Geographical mobility - Moved from different state (%) - White
Geographical mobility - Moved from different state (%) - Black or African American
Geographical mobility - Moved from different state (%) - Asian
Geographical mobility - Moved from different state (%) - Hispanic or Latino
Geographical mobility - Moved from different state (%) - American Indian and Alaska Native
Geographical mobility - Moved from different state (%) - Multirace
Geographical mobility - Moved from different state (%) - Other Race
Geographical mobility - Moved from abroad (%)
Geographical mobility - Moved from abroad (%) - White
Geographical mobility - Moved from abroad (%) - Black or African American
Geographical mobility - Moved from abroad (%) - Asian
Geographical mobility - Moved from abroad (%) - Hispanic or Latino
Geographical mobility - Moved from abroad (%) - American Indian and Alaska Native
Geographical mobility - Moved from abroad (%) - Multirace
Geographical mobility - Moved from abroad (%) - Other Race
Place of birth for the foreign-born population - Ireland (%)
Place of birth for the foreign-born population - Denmark (%)
Place of birth for the foreign-born population - Norway (%)
Place of birth for the foreign-born population - Sweden (%)
Place of birth for the foreign-born population - United Kingdom (%)
Place of birth for the foreign-born population - England (%)
Place of birth for the foreign-born population - Scotland (%)
Place of birth for the foreign-born population - Other Northern Europe (%)
Place of birth for the foreign-born population - Austria (%)
Place of birth for the foreign-born population - Belgium (%)
Place of birth for the foreign-born population - France (%)
Place of birth for the foreign-born population - Germany (%)
Place of birth for the foreign-born population - Netherlands (%)
Place of birth for the foreign-born population - Switzerland (%)
Place of birth for the foreign-born population - Other Western Europe (%)
Place of birth for the foreign-born population - Greece (%)
Place of birth for the foreign-born population - Italy (%)
Place of birth for the foreign-born population - Portugal (%)
Place of birth for the foreign-born population - Spain (%)
Place of birth for the foreign-born population - Other Southern Europe (%)
Place of birth for the foreign-born population - Albania (%)
Place of birth for the foreign-born population - Belarus (%)
Place of birth for the foreign-born population - Bosnia and Herzegovina (%)
Place of birth for the foreign-born population - Bulgaria (%)
Place of birth for the foreign-born population - Croatia (%)
Place of birth for the foreign-born population - Czechoslovakia (%)
Place of birth for the foreign-born population - Hungary (%)
Place of birth for the foreign-born population - Latvia (%)
Place of birth for the foreign-born population - Lithuania (%)
Place of birth for the foreign-born population - North Macedonia (Macedonia) (%)
Place of birth for the foreign-born population - Moldova (%)
Place of birth for the foreign-born population - Poland (%)
Place of birth for the foreign-born population - Romania (%)
Place of birth for the foreign-born population - Russia (%)
Place of birth for the foreign-born population - Serbia (%)
Place of birth for the foreign-born population - Ukraine (%)
Place of birth for the foreign-born population - Other Eastern Europe (%)
Place of birth for the foreign-born population - China (%)
Place of birth for the foreign-born population - Hong Kong (%)
Place of birth for the foreign-born population - Taiwan (%)
Place of birth for the foreign-born population - Japan (%)
Place of birth for the foreign-born population - Korea (%)
Place of birth for the foreign-born population - Other Eastern Asia (%)
Place of birth for the foreign-born population - Afghanistan (%)
Place of birth for the foreign-born population - Bangladesh (%)
Place of birth for the foreign-born population - India (%)
Place of birth for the foreign-born population - Iran (%)
Place of birth for the foreign-born population - Kazakhstan (%)
Place of birth for the foreign-born population - Nepal (%)
Place of birth for the foreign-born population - Pakistan (%)
Place of birth for the foreign-born population - Sri Lanka (%)
Place of birth for the foreign-born population - Uzbekistan (%)
Place of birth for the foreign-born population - Other South Central Asia (%)
Place of birth for the foreign-born population - Burma (%)
Place of birth for the foreign-born population - Cambodia (%)
Place of birth for the foreign-born population - Indonesia (%)
Place of birth for the foreign-born population - Laos (%)
Place of birth for the foreign-born population - Malaysia (%)
Place of birth for the foreign-born population - Philippines (%)
Place of birth for the foreign-born population - Singapore (%)
Place of birth for the foreign-born population - Thailand (%)
Place of birth for the foreign-born population - Vietnam (%)
Place of birth for the foreign-born population - Other South Eastern Asia (%)
Place of birth for the foreign-born population - Armenia (%)
Place of birth for the foreign-born population - Iraq (%)
Place of birth for the foreign-born population - Israel (%)
Place of birth for the foreign-born population - Jordan (%)
Place of birth for the foreign-born population - Kuwait (%)
Place of birth for the foreign-born population - Lebanon (%)
Place of birth for the foreign-born population - Saudi Arabia (%)
Place of birth for the foreign-born population - Syria (%)
Place of birth for the foreign-born population - Turkey (%)
Place of birth for the foreign-born population - Yemen (%)
Place of birth for the foreign-born population - Other Western Asia (%)
Place of birth for the foreign-born population - Eritrea (%)
Place of birth for the foreign-born population - Ethiopia (%)
Place of birth for the foreign-born population - Kenya (%)
Place of birth for the foreign-born population - Somalia (%)
Place of birth for the foreign-born population - Uganda (%)
Place of birth for the foreign-born population - Zimbabwe (%)
Place of birth for the foreign-born population - Other Eastern Africa (%)
Place of birth for the foreign-born population - Cameroon (%)
Place of birth for the foreign-born population - Congo (%)
Place of birth for the foreign-born population - Democratic Republic of Congo (Zaire) (%)
Place of birth for the foreign-born population - Other Middle Africa (%)
Place of birth for the foreign-born population - Egypt (%)
Place of birth for the foreign-born population - Morocco (%)
Place of birth for the foreign-born population - Sudan (%)
Place of birth for the foreign-born population - Other Northern Africa (%)
Place of birth for the foreign-born population - South Africa (%)
Place of birth for the foreign-born population - Other Southern Africa (%)
Place of birth for the foreign-born population - Cabo Verde (%)
Place of birth for the foreign-born population - Ghana (%)
Place of birth for the foreign-born population - Liberia (%)
Place of birth for the foreign-born population - Nigeria (%)
Place of birth for the foreign-born population - Senegal (%)
Place of birth for the foreign-born population - Sierra Leone (%)
Place of birth for the foreign-born population - Other Western Africa (%)
Place of birth for the foreign-born population - Australia (%)
Place of birth for the foreign-born population - New Zealand (%)
Place of birth for the foreign-born population - Fiji (%)
Place of birth for the foreign-born population - Micronesia (%)
Place of birth for the foreign-born population - Bahamas (%)
Place of birth for the foreign-born population - Barbados (%)
Place of birth for the foreign-born population - Cuba (%)
Place of birth for the foreign-born population - Dominica (%)
Place of birth for the foreign-born population - Dominican Republic (%)
Place of birth for the foreign-born population - Grenada (%)
Place of birth for the foreign-born population - Haiti (%)
Place of birth for the foreign-born population - Jamaica (%)
Place of birth for the foreign-born population - St. Vincent and the Grenadines (%)
Place of birth for the foreign-born population - Trinidad and Tobago (%)
Place of birth for the foreign-born population - West Indies (%)
Place of birth for the foreign-born population - Other Caribbean (%)
Place of birth for the foreign-born population - Belize (%)
Place of birth for the foreign-born population - Costa Rica (%)
Place of birth for the foreign-born population - El Salvador (%)
Place of birth for the foreign-born population - Guatemala (%)
Place of birth for the foreign-born population - Honduras (%)
Place of birth for the foreign-born population - Mexico (%)
Place of birth for the foreign-born population - Nicaragua (%)
Place of birth for the foreign-born population - Panama (%)
Place of birth for the foreign-born population - Other Central America (%)
Place of birth for the foreign-born population - Argentina (%)
Place of birth for the foreign-born population - Bolivia (%)
Place of birth for the foreign-born population - Brazil (%)
Place of birth for the foreign-born population - Chile (%)
Place of birth for the foreign-born population - Colombia (%)
Place of birth for the foreign-born population - Ecuador (%)
Place of birth for the foreign-born population - Guyana (%)
Place of birth for the foreign-born population - Peru (%)
Place of birth for the foreign-born population - Uruguay (%)
Place of birth for the foreign-born population - Venezuela (%)
Place of birth for the foreign-born population - Other South America (%)
Place of birth for the foreign-born population - Canada (%)
Place of birth for the foreign-born population - Other Northern America (%)
Place of birth for the foreign-born population - Other (%)
Latest news about races in Newport, OR collected exclusively by city-data.com from local newspapers, TV, and radio stations
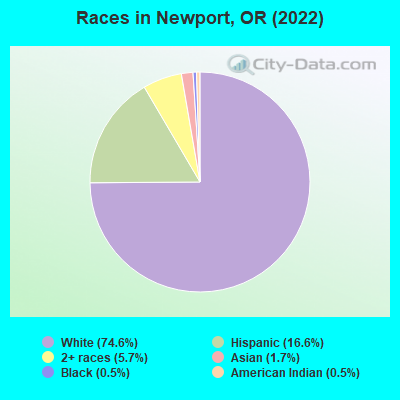
According to 2022 data, the most numerous races in Newport, OR are White alone (7,718 residents), Hispanic (1,721 residents), and Two or more races (590 residents). 84.3% of Newport residents speak English at home. 6.9% of Newport, OR residents are foreign-born (4.9% born in Latin America, 1.3% born in Asia), which is 30.9% less than the foreign-born rate of 9.0% across the entire state of Oregon.
Race distribution in Newport
2000 2022
2,857,616 83.5% White alone 275,314 8.0% Hispanic 100,333 2.9% Asian alone 82,733 2.4% Two or more races 53,325 1.6% Black alone 40,130 1.2% American Indian alone 7,398 0.2% Native Hawaiian and Other 4,550 0.1% Other race alone
3,037,571 71.6% White alone 609,538 14.4% Hispanic 252,744 6.0% Two or more races 191,283 4.5% Asian alone 78,228 1.8% Black alone 29,399 0.7% American Indian alone 25,731 0.6% Other race alone 15,643 0.4% Native Hawaiian and Other
Income and house value in Newport Median household income in 2022 $55,561 White non-Hispanic householders$25,185 American Indian and Alaska Native householders$70,132 Some other race householders$51,484 Two or more races householders$63,744 Hispanic or Latino race householdersMedian 2022 house value $474,701 White Non-Hispanic householders$407,023 American Indian or Alaska Native householders $595,760 Asian householders$357,456 Some other race householders$370,801 Two or more races householders$499,803 Hispanic or Latino householders
Median age by race in Newport
55.0 Median age for White residents50.2 60.2 72.8 Median age for Black or African American residents79.1 13.9 42.9 Median age for American Indian / Alaska Native residents4.4 56.8 57.2 Median age for Asian residents57.4 60.4 -764,705,881.6 Median age for Native Hawaiian / Pacific Islander residents-764,119,600.6 -774,891,774.1 19.7 Median age for Other race residents19.4 24.1 42.0 Median age for Two or more races residents42.2 40.3 55.6 Median age for White alone residents52.4 59.9 23.1 Median age for Hispanic or Latino residents19.1 24.5
Owner/renter occupied households by race in Newport
House owners and renters - White residents 2,578 65.5% Owner occupied1,359 34.5% Renter occupiedHouse owners and renters - Black or African American residents 22 100.0% Renter occupiedHouse owners and renters - American Indian / Alaska Native residents 32 100.0% Renter occupiedHouse owners and renters - Asian residents 26 33.5% Owner occupied51 66.5% Renter occupiedHouse owners and renters - Other race residents 77 29.2% Owner occupied186 70.8% Renter occupiedHouse owners and renters - Two or more races residents 171 50.8% Owner occupied165 49.2% Renter occupiedHouse owners and renters - White alone residents 2,540 64.6% Owner occupied1,389 35.4% Renter occupiedHouse owners and renters - Hispanic or Latino residents 168 43.5% Owner occupied217 56.5% Renter occupied
Language usage in Newport
English speakers - Total 84.3% of residents of Newport speak English at home.
13.5% of residents speak Spanish at home 867 64.4% Speak English very well479 35.6% Speak English less than very well2.4% of residents speak other language at home 157 66.8% Speak English very well78 33.2% Speak English less than very well
English speakers - Born in the United States 93.8% of residents of Newport speak English at home.
4.8% of residents speak Spanish at home 155 59.4% Speak English very well106 40.6% Speak English less than very well1.4% of residents speak other language at home 47 61.8% Speak English very well29 38.2% Speak English less than very well
English speakers - Native, born elsewhere 72.3% of residents of Newport speak English at home.
5.9% of residents speak Spanish at home 6 100.0% Speak English very well21.8% of residents speak other language at home 6 27.3% Speak English very well16 72.7% Speak English less than very well
English speakers - Foreign-born 13.8% of residents of Newport speak English at home.
69.8% of residents speak Spanish at home 141 29.6% Speak English very well336 70.4% Speak English less than very well18.2% of residents speak other language at home 92 74.2% Speak English very well32 25.8% Speak English less than very well
White (Caucasian) - Speak only English Native:
96.8% (7,412)Foreign-born:
64.7% (57)
White (Caucasian) - Speak another language Native:
3.3% (250)Foreign-born:
43.5% (39)
American Indian / Alaska Native - Speak another language Native:
5.1% (2)Foreign-born:
100.0% (2)
Asian - Speak only English Native:
9.9% (4)Foreign-born:
11.3% (15)
Asian - Speak another language Native:
88.1% (39)Foreign-born:
88.3% (116)
Other race - Speak another language Native:
89.5% (645)Foreign-born:
100.0% (462)
Two or more races - Speak only English Native:
88.2% (659)Foreign-born:
23.2% (23)
Two or more races - Speak another language Native:
11.1% (83)Foreign-born:
76.4% (77)
White alone - Speak only English Native:
97.2% (7,302)Foreign-born:
79.4% (49)
White alone - Speak another language Native:
2.8% (214)Foreign-born:
21.9% (13)
Hispanic or Latino - Speak only English Native:
30.3% (320)Foreign-born:
6.4% (33)
Hispanic or Latino - Speak another language Native:
67.7% (716)Foreign-born:
93.5% (477)
Foreign-born residents in Newport 711 residents are foreign born (4.9% Latin America , 1.3% Asia ).
This city:
6.9%Oregon:
9.8%
Marital status for residents in Newport Marital status - White (Caucasian) population 15 years and over
Males 32.3% Never married47.4% Now married1.6% Separated2.8% Widowed15.9% DivorcedFemales 23.9% Never married40.3% Now married2.2% Separated12.4% Widowed21.1% DivorcedWomen who gave birth in the past 12 months Now married:
8.3% (8)Unmarried:
91.7% (94)
Women who did not give birth in the past 12 months Now married:
43.8% (569)Unmarried:
56.2% (728)
Marital status - Black or African American population 15 years and over
Males 19.1% Never married11.8% Now married0.0% Separated0.0% Widowed69.1% DivorcedFemales 18.2% Never married81.8% Now married0.0% Separated0.0% Widowed0.0% DivorcedWomen who did not give birth in the past 12 months Now married:
81.8% (10)Unmarried:
18.2% (2)
Marital status - American Indian / Alaska Native population 15 years and over
Males 22.2% Never married0.0% Now married0.0% Separated0.0% Widowed77.8% DivorcedFemales 96.7% Never married0.0% Now married3.3% Separated0.0% Widowed0.0% DivorcedWomen who did not give birth in the past 12 months Now married:
3.3% (1)Unmarried:
96.7% (32)
Marital status - Asian population 15 years and over
Males 54.1% Never married32.1% Now married0.0% Separated0.0% Widowed13.8% DivorcedFemales 10.5% Never married77.2% Now married0.0% Separated0.0% Widowed12.3% DivorcedWomen who gave birth in the past 12 months Now married:
100.0% (2)Unmarried:
0.0% (0)
Women who did not give birth in the past 12 months Now married:
69.2% (9)Unmarried:
30.8% (4)
Marital status - Other race population 15 years and over
Males 48.8% Never married46.2% Now married5.0% Separated0.0% Widowed0.0% DivorcedFemales 52.0% Never married41.1% Now married2.7% Separated0.0% Widowed4.2% DivorcedWomen who did not give birth in the past 12 months Now married:
41.3% (179)Unmarried:
58.7% (254)
Marital status - Two or more races population 15 years and over
Males 51.6% Never married31.3% Now married0.0% Separated12.6% Widowed4.5% DivorcedFemales 40.0% Never married34.4% Now married1.3% Separated2.6% Widowed21.6% DivorcedWomen who did not give birth in the past 12 months Now married:
38.1% (66)Unmarried:
61.9% (108)
Marital status - White alone, not Hispanic / Latino population 15 years and over
Males 32.6% Never married47.5% Now married0.8% Separated2.9% Widowed16.3% DivorcedFemales 24.4% Never married40.3% Now married2.3% Separated12.0% Widowed21.0% DivorcedWomen who gave birth in the past 12 months Now married:
10.1% (9)Unmarried:
89.9% (78)
Women who did not give birth in the past 12 months Now married:
42.8% (558)Unmarried:
57.2% (744)
Marital status - Hispanic or Latino population 15 years and over
Males 45.1% Never married43.9% Now married8.9% Separated1.2% Widowed0.8% DivorcedFemales 40.9% Never married43.8% Now married1.8% Separated5.7% Widowed7.9% DivorcedWomen who gave birth in the past 12 months Now married:
0.0% (0)Unmarried:
100.0% (21)
Women who did not give birth in the past 12 months Now married:
45.9% (210)Unmarried:
54.1% (247)
Ancestries in Newport
663 12.9% German556 10.8% European498 9.7% English381 7.4% Irish320 6.2% American167 3.2% Italian131 2.5% Scottish111 2.2% Norwegian56 1.1% Polish47 0.9% Eastern European47 0.9% Scandinavian47 0.9% Swedish36 0.7% Welsh26 0.5% Finnish22 0.4% Dutch21 0.4% British21 0.4% Northern European21 0.4% Ukrainian20 0.4% Greek17 0.3% French Canadian16 0.3% Celtic14 0.3% French13 0.3% Hungarian13 0.3% Swiss11 0.2% Danish6 0.1% Russian4 0.08% Lithuanian
Children Nativity (place of birth) in Newport
Children under 6 years - Living with two parents Both parents native 136 100.0% NativeBoth parents foreign-born 22 100.0% NativeOne native, one foreign-born parent 40 100.0% NativeChildren under 6 years - Living with one parent Native parent 200 81.6% Native45 18.4% Foreign-bornForeign-born parent 6 100.0% NativeChildren 6 to 17 years - Living with two parents Both parents native 470 100.0% NativeBoth parents foreign-born 213 100.0% NativeOne native, one foreign-born parent 55 100.0% NativeChildren 6 to 17 years - Living with one parent Native parent 266 100.0% NativeForeign-born parent 134 51.1% Native128 48.9% Foreign-born
Grandparents responsible for own grandchildren in Newport
Grandparents (30 to 59 years) White / Caucasian 62 83.0% Responsible for grandchildren13 17.0% Not responsible for grandchildrenOther race 82 100.0% Not responsible for grandchildrenWhite alone, not Hispanic / Latino 65 81.5% Responsible for grandchildren15 18.5% Not responsible for grandchildrenHispanic or Latino 59 100.0% Not responsible for grandchildren
Grandparents (60 years and over) White / Caucasian 9 100.0% Not responsible for grandchildrenWhite alone, not Hispanic / Latino 10 100.0% Not responsible for grandchildren