Races in New Albany, Ohio (OH) Detailed Stats
Data:
Races - White alone (%)
Races - White alone (% change since 2000)
Races - Black alone (%)
Races - Black alone (% change since 2000)
Races - American Indian alone (%)
Races - American Indian alone (% change since 2000)
Races - Asian alone (%)
Races - Asian alone (% change since 2000)
Races - Hispanic (%)
Races - Hispanic (% change since 2000)
Races - Native Hawaiian and Other Pacific Islander alone (%)
Races - Native Hawaiian and Other Pacific Islander alone (% change since 2000)
Races - Two or more races(%)
Races - Two or more races(% change since 2000)
Races - Other race alone (%)
Races - Other race alone (% change since 2000)
Racial diversity
Place of birth - Born in state of residence (%)
Place of birth - Born in state of residence (%) - White
Place of birth - Born in state of residence (%) - Black or African American
Place of birth - Born in state of residence (%) - Asian
Place of birth - Born in state of residence (%) - Hispanic or Latino
Place of birth - Born in state of residence (%) - American Indian and Alaska Native
Place of birth - Born in state of residence (%) - Multirace
Place of birth - Born in state of residence (%) - Other Race
Place of birth - Born in other state (%)
Place of birth - Born in other state (%) - White
Place of birth - Born in other state (%) - Black or African American
Place of birth - Born in other state (%) - Asian
Place of birth - Born in other state (%) - Hispanic or Latino
Place of birth - Born in other state (%) - American Indian and Alaska Native
Place of birth - Born in other state (%) - Multirace
Place of birth - Born in other state (%) - Other Race
Place of birth - Native, outside of US (%)
Place of birth - Native, outside of US (%) - White
Place of birth - Native, outside of US (%) - Black or African American
Place of birth - Native, outside of US (%) - Asian
Place of birth - Native, outside of US (%) - Hispanic or Latino
Place of birth - Native, outside of US (%) - American Indian and Alaska Native
Place of birth - Native, outside of US (%) - Multirace
Place of birth - Native, outside of US (%) - Other Race
Place of birth - Foreign born (%)
Place of birth - Foreign born (%) - White
Place of birth - Foreign born (%) - Black or African American
Place of birth - Foreign born (%) - Asian
Place of birth - Foreign born (%) - Hispanic or Latino
Place of birth - Foreign born (%) - American Indian and Alaska Native
Place of birth - Foreign born (%) - Multirace
Place of birth - Foreign born (%) - Other Race
Residents speaking English at home (%)
Residents speaking English at home - Born in the United States (%)
Residents speaking English at home - Native, born elsewhere (%)
Residents speaking English at home - Foreign born (%)
Residents speaking Spanish at home (%)
Residents speaking Spanish at home - Born in the United States (%)
Residents speaking Spanish at home - Native, born elsewhere (%)
Residents speaking Spanish at home - Foreign born (%)
Residents speaking other language at home (%)
Residents speaking other language at home - Born in the United States (%)
Residents speaking other language at home - Native, born elsewhere (%)
Residents speaking other language at home - Foreign born (%)
Marital status - Never married (%)
Marital status - Now married (%)
Marital status - Separated (%)
Marital status - Widowed (%)
Marital status - Divorced (%)
Ancestries Reported - Arab (%)
Ancestries Reported - Czech (%)
Ancestries Reported - Danish (%)
Ancestries Reported - Dutch (%)
Ancestries Reported - English (%)
Ancestries Reported - French (%)
Ancestries Reported - French Canadian (%)
Ancestries Reported - German (%)
Ancestries Reported - Greek (%)
Ancestries Reported - Hungarian (%)
Ancestries Reported - Irish (%)
Ancestries Reported - Italian (%)
Ancestries Reported - Lithuanian (%)
Ancestries Reported - Norwegian (%)
Ancestries Reported - Polish (%)
Ancestries Reported - Portuguese (%)
Ancestries Reported - Russian (%)
Ancestries Reported - Scotch-Irish (%)
Ancestries Reported - Scottish (%)
Ancestries Reported - Slovak (%)
Ancestries Reported - Subsaharan African (%)
Ancestries Reported - Swedish (%)
Ancestries Reported - Swiss (%)
Ancestries Reported - Ukrainian (%)
Ancestries Reported - United States (%)
Ancestries Reported - Welsh (%)
Ancestries Reported - West Indian (%)
Ancestries Reported - Other (%)
Geographical mobility - Same house 1 year ago (%)
Geographical mobility - Same house 1 year ago (%) - White
Geographical mobility - Same house 1 year ago (%) - Black or African American
Geographical mobility - Same house 1 year ago (%) - Asian
Geographical mobility - Same house 1 year ago (%) - Hispanic or Latino
Geographical mobility - Same house 1 year ago (%) - American Indian and Alaska Native
Geographical mobility - Same house 1 year ago (%) - Multirace
Geographical mobility - Same house 1 year ago (%) - Other Race
Geographical mobility - Moved within same county (%)
Geographical mobility - Moved within same county (%) - White
Geographical mobility - Moved within same county (%) - Black or African American
Geographical mobility - Moved within same county (%) - Asian
Geographical mobility - Moved within same county (%) - Hispanic or Latino
Geographical mobility - Moved within same county (%) - American Indian and Alaska Native
Geographical mobility - Moved within same county (%) - Multirace
Geographical mobility - Moved within same county (%) - Other Race
Geographical mobility - Moved from different county within same state (%)
Geographical mobility - Moved from different county within same state (%) - White
Geographical mobility - Moved from different county within same state (%) - Black or African American
Geographical mobility - Moved from different county within same state (%) - Asian
Geographical mobility - Moved from different county within same state (%) - Hispanic or Latino
Geographical mobility - Moved from different county within same state (%) - American Indian and Alaska Native
Geographical mobility - Moved from different county within same state (%) - Multirace
Geographical mobility - Moved from different county within same state (%) - Other Race
Geographical mobility - Moved from different state (%)
Geographical mobility - Moved from different state (%) - White
Geographical mobility - Moved from different state (%) - Black or African American
Geographical mobility - Moved from different state (%) - Asian
Geographical mobility - Moved from different state (%) - Hispanic or Latino
Geographical mobility - Moved from different state (%) - American Indian and Alaska Native
Geographical mobility - Moved from different state (%) - Multirace
Geographical mobility - Moved from different state (%) - Other Race
Geographical mobility - Moved from abroad (%)
Geographical mobility - Moved from abroad (%) - White
Geographical mobility - Moved from abroad (%) - Black or African American
Geographical mobility - Moved from abroad (%) - Asian
Geographical mobility - Moved from abroad (%) - Hispanic or Latino
Geographical mobility - Moved from abroad (%) - American Indian and Alaska Native
Geographical mobility - Moved from abroad (%) - Multirace
Geographical mobility - Moved from abroad (%) - Other Race
Place of birth for the foreign-born population - Ireland (%)
Place of birth for the foreign-born population - Denmark (%)
Place of birth for the foreign-born population - Norway (%)
Place of birth for the foreign-born population - Sweden (%)
Place of birth for the foreign-born population - United Kingdom (%)
Place of birth for the foreign-born population - England (%)
Place of birth for the foreign-born population - Scotland (%)
Place of birth for the foreign-born population - Other Northern Europe (%)
Place of birth for the foreign-born population - Austria (%)
Place of birth for the foreign-born population - Belgium (%)
Place of birth for the foreign-born population - France (%)
Place of birth for the foreign-born population - Germany (%)
Place of birth for the foreign-born population - Netherlands (%)
Place of birth for the foreign-born population - Switzerland (%)
Place of birth for the foreign-born population - Other Western Europe (%)
Place of birth for the foreign-born population - Greece (%)
Place of birth for the foreign-born population - Italy (%)
Place of birth for the foreign-born population - Portugal (%)
Place of birth for the foreign-born population - Spain (%)
Place of birth for the foreign-born population - Other Southern Europe (%)
Place of birth for the foreign-born population - Albania (%)
Place of birth for the foreign-born population - Belarus (%)
Place of birth for the foreign-born population - Bosnia and Herzegovina (%)
Place of birth for the foreign-born population - Bulgaria (%)
Place of birth for the foreign-born population - Croatia (%)
Place of birth for the foreign-born population - Czechoslovakia (%)
Place of birth for the foreign-born population - Hungary (%)
Place of birth for the foreign-born population - Latvia (%)
Place of birth for the foreign-born population - Lithuania (%)
Place of birth for the foreign-born population - North Macedonia (Macedonia) (%)
Place of birth for the foreign-born population - Moldova (%)
Place of birth for the foreign-born population - Poland (%)
Place of birth for the foreign-born population - Romania (%)
Place of birth for the foreign-born population - Russia (%)
Place of birth for the foreign-born population - Serbia (%)
Place of birth for the foreign-born population - Ukraine (%)
Place of birth for the foreign-born population - Other Eastern Europe (%)
Place of birth for the foreign-born population - China (%)
Place of birth for the foreign-born population - Hong Kong (%)
Place of birth for the foreign-born population - Taiwan (%)
Place of birth for the foreign-born population - Japan (%)
Place of birth for the foreign-born population - Korea (%)
Place of birth for the foreign-born population - Other Eastern Asia (%)
Place of birth for the foreign-born population - Afghanistan (%)
Place of birth for the foreign-born population - Bangladesh (%)
Place of birth for the foreign-born population - India (%)
Place of birth for the foreign-born population - Iran (%)
Place of birth for the foreign-born population - Kazakhstan (%)
Place of birth for the foreign-born population - Nepal (%)
Place of birth for the foreign-born population - Pakistan (%)
Place of birth for the foreign-born population - Sri Lanka (%)
Place of birth for the foreign-born population - Uzbekistan (%)
Place of birth for the foreign-born population - Other South Central Asia (%)
Place of birth for the foreign-born population - Burma (%)
Place of birth for the foreign-born population - Cambodia (%)
Place of birth for the foreign-born population - Indonesia (%)
Place of birth for the foreign-born population - Laos (%)
Place of birth for the foreign-born population - Malaysia (%)
Place of birth for the foreign-born population - Philippines (%)
Place of birth for the foreign-born population - Singapore (%)
Place of birth for the foreign-born population - Thailand (%)
Place of birth for the foreign-born population - Vietnam (%)
Place of birth for the foreign-born population - Other South Eastern Asia (%)
Place of birth for the foreign-born population - Armenia (%)
Place of birth for the foreign-born population - Iraq (%)
Place of birth for the foreign-born population - Israel (%)
Place of birth for the foreign-born population - Jordan (%)
Place of birth for the foreign-born population - Kuwait (%)
Place of birth for the foreign-born population - Lebanon (%)
Place of birth for the foreign-born population - Saudi Arabia (%)
Place of birth for the foreign-born population - Syria (%)
Place of birth for the foreign-born population - Turkey (%)
Place of birth for the foreign-born population - Yemen (%)
Place of birth for the foreign-born population - Other Western Asia (%)
Place of birth for the foreign-born population - Eritrea (%)
Place of birth for the foreign-born population - Ethiopia (%)
Place of birth for the foreign-born population - Kenya (%)
Place of birth for the foreign-born population - Somalia (%)
Place of birth for the foreign-born population - Uganda (%)
Place of birth for the foreign-born population - Zimbabwe (%)
Place of birth for the foreign-born population - Other Eastern Africa (%)
Place of birth for the foreign-born population - Cameroon (%)
Place of birth for the foreign-born population - Congo (%)
Place of birth for the foreign-born population - Democratic Republic of Congo (Zaire) (%)
Place of birth for the foreign-born population - Other Middle Africa (%)
Place of birth for the foreign-born population - Egypt (%)
Place of birth for the foreign-born population - Morocco (%)
Place of birth for the foreign-born population - Sudan (%)
Place of birth for the foreign-born population - Other Northern Africa (%)
Place of birth for the foreign-born population - South Africa (%)
Place of birth for the foreign-born population - Other Southern Africa (%)
Place of birth for the foreign-born population - Cabo Verde (%)
Place of birth for the foreign-born population - Ghana (%)
Place of birth for the foreign-born population - Liberia (%)
Place of birth for the foreign-born population - Nigeria (%)
Place of birth for the foreign-born population - Senegal (%)
Place of birth for the foreign-born population - Sierra Leone (%)
Place of birth for the foreign-born population - Other Western Africa (%)
Place of birth for the foreign-born population - Australia (%)
Place of birth for the foreign-born population - New Zealand (%)
Place of birth for the foreign-born population - Fiji (%)
Place of birth for the foreign-born population - Micronesia (%)
Place of birth for the foreign-born population - Bahamas (%)
Place of birth for the foreign-born population - Barbados (%)
Place of birth for the foreign-born population - Cuba (%)
Place of birth for the foreign-born population - Dominica (%)
Place of birth for the foreign-born population - Dominican Republic (%)
Place of birth for the foreign-born population - Grenada (%)
Place of birth for the foreign-born population - Haiti (%)
Place of birth for the foreign-born population - Jamaica (%)
Place of birth for the foreign-born population - St. Vincent and the Grenadines (%)
Place of birth for the foreign-born population - Trinidad and Tobago (%)
Place of birth for the foreign-born population - West Indies (%)
Place of birth for the foreign-born population - Other Caribbean (%)
Place of birth for the foreign-born population - Belize (%)
Place of birth for the foreign-born population - Costa Rica (%)
Place of birth for the foreign-born population - El Salvador (%)
Place of birth for the foreign-born population - Guatemala (%)
Place of birth for the foreign-born population - Honduras (%)
Place of birth for the foreign-born population - Mexico (%)
Place of birth for the foreign-born population - Nicaragua (%)
Place of birth for the foreign-born population - Panama (%)
Place of birth for the foreign-born population - Other Central America (%)
Place of birth for the foreign-born population - Argentina (%)
Place of birth for the foreign-born population - Bolivia (%)
Place of birth for the foreign-born population - Brazil (%)
Place of birth for the foreign-born population - Chile (%)
Place of birth for the foreign-born population - Colombia (%)
Place of birth for the foreign-born population - Ecuador (%)
Place of birth for the foreign-born population - Guyana (%)
Place of birth for the foreign-born population - Peru (%)
Place of birth for the foreign-born population - Uruguay (%)
Place of birth for the foreign-born population - Venezuela (%)
Place of birth for the foreign-born population - Other South America (%)
Place of birth for the foreign-born population - Canada (%)
Place of birth for the foreign-born population - Other Northern America (%)
Place of birth for the foreign-born population - Other (%)
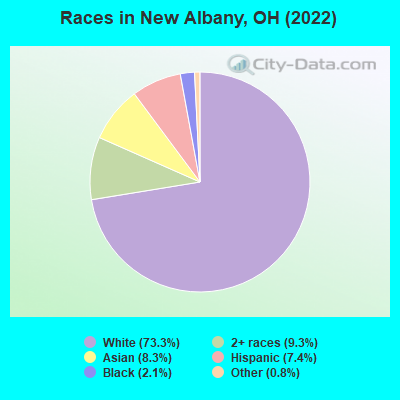
According to 2022 data, the most numerous races in New Albany, OH are White alone (7,733 residents), Black alone (220 residents), and Two or more races (978 residents). 84.9% of New Albany residents speak English at home. 11.0% of New Albany, OH residents are foreign-born (6.6% born in Asia, 2.1% born in Europe), which is 63.5% greater than the foreign-born rate of 4.0% across the entire state of Ohio.
Race distribution in New Albany
2000 2022
9,538,111 84.0% White alone 1,290,662 11.4% Black alone 217,123 1.9% Hispanic 137,770 1.2% Two or more races 131,670 1.2% Asian alone 21,985 0.2% American Indian alone 13,483 0.1% Other race alone 2,336 0.02% Native Hawaiian and Other
8,948,793 76.1% White alone 1,401,403 11.9% Black alone 529,291 4.5% Two or more races 517,232 4.4% Hispanic 293,387 2.5% Asian alone 52,805 0.4% Other race alone 9,785 0.08% American Indian alone 3,362 0.03% Native Hawaiian and Other
Income and house value in New Albany Median household income in 2022 over $200,000 White non-Hispanic householders$170,286 Black householdersover $200,000 Asian householdersover $200,000 Two or more races householdersover $200,000 Hispanic or Latino race householdersMedian 2022 house value $692,532 White Non-Hispanic householdersover $1,000,000 Black or African American householders over $1,000,000 Asian householders$294,243 Two or more races householders
Median age by race in New Albany
44.0 Median age for White residents44.5 43.6 40.1 Median age for Black or African American residents39.9 39.1 -691,029,899.6 Median age for American Indian / Alaska Native residents-670,953,911.4 -732,121,211.4 43.2 Median age for Asian residents41.5 44.5 -497,206,703.4 Median age for Native Hawaiian / Pacific Islander residents-544,891,640.3 -805,394,989.6 18.5 Median age for Other race residents67.1 16.2 19.7 Median age for Two or more races residents19.8 30.1 44.0 Median age for White alone residents44.1 44.1 17.3 Median age for Hispanic or Latino residents17.1 25.9
Owner/renter occupied households by race in New Albany
House owners and renters - White residents 2,439 90.7% Owner occupied250 9.3% Renter occupiedHouse owners and renters - Black or African American residents 83 86.2% Owner occupied13 13.8% Renter occupiedHouse owners and renters - Asian residents 243 100.0% Owner occupiedHouse owners and renters - Other race residents 19 100.0% Renter occupiedHouse owners and renters - Two or more races residents 311 100.0% Owner occupiedHouse owners and renters - White alone residents 2,426 91.0% Owner occupied241 9.0% Renter occupiedHouse owners and renters - Hispanic or Latino residents 165 91.7% Owner occupied15 8.3% Renter occupied
Language usage in New Albany
English speakers - Total 84.9% of residents of New Albany speak English at home.
3.0% of residents speak Spanish at home 252 84.6% Speak English very well46 15.4% Speak English less than very well11.7% of residents speak other language at home 932 79.3% Speak English very well243 20.7% Speak English less than very well
English speakers - Born in the United States 85.8% of residents of New Albany speak English at home.
7.5% of residents speak Spanish at home 208 86.3% Speak English very well33 13.7% Speak English less than very well6.7% of residents speak other language at home 176 81.9% Speak English very well39 18.1% Speak English less than very well
English speakers - Native, born elsewhere 92.6% of residents of New Albany speak English at home.
8.5% of residents speak other language at home 16 100.0% Speak English very well
English speakers - Foreign-born 25.1% of residents of New Albany speak English at home.
4.7% of residents speak Spanish at home 41 74.5% Speak English very well14 25.5% Speak English less than very well66.5% of residents speak other language at home 581 74.8% Speak English very well196 25.2% Speak English less than very well
White (Caucasian) - Speak only English Native:
97.6% (7,004)Foreign-born:
50.6% (128)
White (Caucasian) - Speak another language Native:
2.4% (170)Foreign-born:
50.6% (128)
Black or African American - Speak another language Native:
20.9% (31)Foreign-born:
100.0% (62)
Asian - Speak only English Native:
68.4% (228)Foreign-born:
4.9% (27)
Asian - Speak another language Native:
34.0% (113)Foreign-born:
97.5% (532)
Two or more races - Speak only English Native:
73.5% (963)Foreign-born:
67.2% (198)
Two or more races - Speak another language Native:
24.4% (319)Foreign-born:
33.4% (99)
White alone - Speak only English Native:
97.2% (6,909)Foreign-born:
43.6% (131)
White alone - Speak another language Native:
2.9% (203)Foreign-born:
52.7% (158)
Hispanic or Latino - Speak only English Native:
59.8% (337)Foreign-born:
40.0% (37)
Hispanic or Latino - Speak another language Native:
37.4% (210)Foreign-born:
65.6% (61)
Foreign-born residents in New Albany 1,155 residents are foreign born (6.6% Asia , 2.1% Europe ).
Marital status for residents in New Albany Marital status - White (Caucasian) population 15 years and over
Males 22.7% Never married72.4% Now married0.2% Separated0.9% Widowed3.8% DivorcedFemales 16.1% Never married72.6% Now married0.7% Separated4.2% Widowed6.4% DivorcedWomen who gave birth in the past 12 months Now married:
100.0% (47)Unmarried:
0.0% (0)
Women who did not give birth in the past 12 months Now married:
69.1% (1,092)Unmarried:
30.9% (487)
Marital status - Black or African American population 15 years and over
Males 50.4% Never married41.9% Now married7.7% Separated0.0% Widowed0.0% DivorcedFemales 56.7% Never married29.9% Now married0.0% Separated0.0% Widowed13.4% DivorcedWomen who did not give birth in the past 12 months Now married:
22.7% (10)Unmarried:
77.3% (32)
Marital status - Asian population 15 years and over
Males 14.9% Never married83.0% Now married0.0% Separated0.0% Widowed2.0% DivorcedFemales 6.2% Never married93.8% Now married0.0% Separated0.0% Widowed0.0% DivorcedWomen who did not give birth in the past 12 months Now married:
91.0% (210)Unmarried:
9.0% (21)
Marital status - Other race population 15 years and over
Males 30.0% Never married70.0% Now married0.0% Separated0.0% Widowed0.0% DivorcedFemales 55.2% Never married44.8% Now married0.0% Separated0.0% Widowed0.0% DivorcedWomen who did not give birth in the past 12 months Now married:
0.0% (0)Unmarried:
100.0% (19)
Marital status - Two or more races population 15 years and over
Males 40.8% Never married59.2% Now married0.0% Separated0.0% Widowed0.0% DivorcedFemales 19.9% Never married49.9% Now married0.0% Separated30.3% Widowed0.0% DivorcedWomen who did not give birth in the past 12 months Now married:
71.9% (226)Unmarried:
28.1% (88)
Marital status - White alone, not Hispanic / Latino population 15 years and over
Males 21.7% Never married73.3% Now married0.2% Separated0.9% Widowed3.9% DivorcedFemales 16.2% Never married72.3% Now married0.7% Separated4.3% Widowed6.5% DivorcedWomen who gave birth in the past 12 months Now married:
100.0% (48)Unmarried:
0.0% (0)
Women who did not give birth in the past 12 months Now married:
68.8% (1,092)Unmarried:
31.2% (494)
Marital status - Hispanic or Latino population 15 years and over
Males 39.0% Never married61.0% Now married0.0% Separated0.0% Widowed0.0% DivorcedFemales 23.0% Never married77.0% Now married0.0% Separated0.0% Widowed0.0% DivorcedWomen who did not give birth in the past 12 months Now married:
81.2% (105)Unmarried:
18.8% (24)
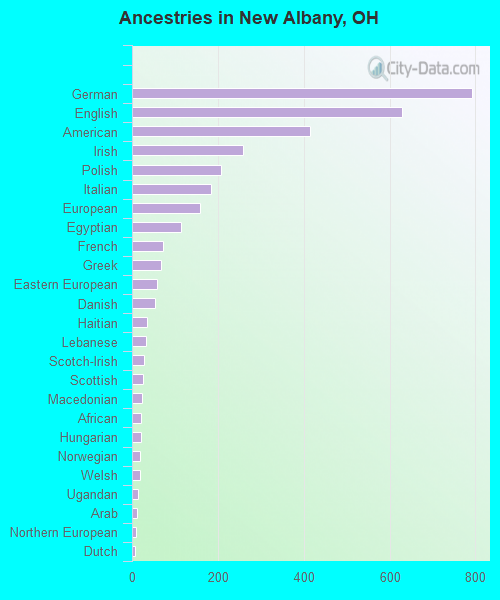
Ancestries in New Albany
792 15.3% German628 12.1% English415 8.0% American258 5.0% Irish207 4.0% Polish184 3.6% Italian159 3.1% European114 2.2% Egyptian73 1.4% French67 1.3% Greek59 1.1% Eastern European54 1.0% Danish35 0.7% Haitian33 0.6% Lebanese28 0.5% Scotch-Irish26 0.5% Scottish23 0.4% Macedonian21 0.4% African20 0.4% Hungarian19 0.4% Norwegian18 0.3% Welsh14 0.3% Ugandan11 0.2% Arab10 0.2% Northern European8 0.2% Dutch8 0.2% Slovak5 0.10% Lithuanian5 0.10% Senegalese5 0.10% Ukrainian
Children Nativity (place of birth) in New Albany
Children under 6 years - Living with two parents Both parents native 346 100.0% NativeBoth parents foreign-born 10 32.1% Native22 67.9% Foreign-bornOne native, one foreign-born parent 201 100.0% NativeChildren under 6 years - Living with one parent Native parent 13 100.0% NativeForeign-born parent 12 100.0% NativeChildren 6 to 17 years - Living with two parents Both parents native 2,147 100.0% NativeBoth parents foreign-born 257 80.5% Native62 19.5% Foreign-bornOne native, one foreign-born parent 133 100.0% NativeChildren 6 to 17 years - Living with one parent Native parent 188 100.0% NativeForeign-born parent 32 50.6% Native31 49.4% Foreign-born
Grandparents responsible for own grandchildren in New Albany
Grandparents (30 to 59 years) White / Caucasian 12 100.0% Not responsible for grandchildrenOther race 15 100.0% Responsible for grandchildrenWhite alone, not Hispanic / Latino 13 100.0% Not responsible for grandchildren
Grandparents (60 years and over) White / Caucasian 45 100.0% Not responsible for grandchildrenOther race 17 100.0% Responsible for grandchildrenWhite alone, not Hispanic / Latino 46 100.0% Not responsible for grandchildren