Races in Montalba-Tennessee Colony, Texas (TX) Detailed Stats
Ancestries, Foreign-born residents, place of birth
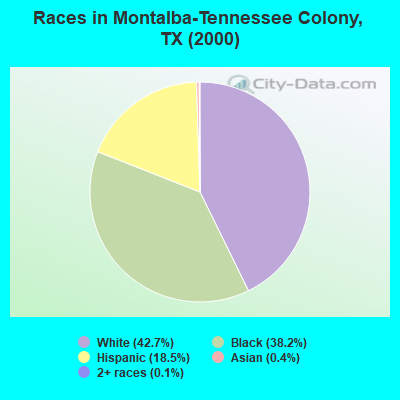
Race distribution in Montalba-Tennessee Colony

- 7,57742.7%White alone
- 6,77938.2%Black alone
- 3,28118.5%Hispanic
- 740.4%Asian alone
- 250.1%Two or more races
- 150.08%American Indian alone
- 10.01%Other race alone
2000
2022
-
- 10,933,31352.4%White alone
- 6,669,66632.0%Hispanic
- 2,364,25511.3%Black alone
- 554,4452.7%Asian alone
- 230,5671.1%Two or more races
- 68,8590.3%American Indian alone
- 19,9580.10%Other race alone
- 10,7570.05%Native Hawaiian and Other
Pacific Islander alone

-
- 12,070,64240.2%Hispanic
- 11,683,43038.9%White alone
- 3,508,70611.7%Black alone
- 1,608,1735.4%Asian alone
- 956,5603.2%Two or more races
- 125,7630.4%Other race alone
- 47,0230.2%American Indian alone
- 29,2750.10%Native Hawaiian and Other
Pacific Islander alone

Income and house value in Montalba-Tennessee Colony
- Median household income in 2022
- $68,491White non-Hispanic householders
- $44,653Black householders
- $80,797American Indian and Alaska Native householders
- $5,486Some other race householders
- $33,154Two or more races householders
- $11,143Hispanic or Latino race householders
- Median 2022 house value
- $197,891White Non-Hispanic householders
- $234,937Black or African American householders
- $237,470Some other race householders
- $118,735Two or more races householders
- $237,470Hispanic or Latino householders
Household income for White non-Hispanic householders

Household income for Black householders

Household income for American Indian and Alaska Native householders

Household income for Two or more races householders

Household income for Hispanic or Latino race householders

Zip code: 75853