Races in Mason, Ohio (OH) Detailed Stats
Data:
Races - White alone (%)
Races - White alone (% change since 2000)
Races - Black alone (%)
Races - Black alone (% change since 2000)
Races - American Indian alone (%)
Races - American Indian alone (% change since 2000)
Races - Asian alone (%)
Races - Asian alone (% change since 2000)
Races - Hispanic (%)
Races - Hispanic (% change since 2000)
Races - Native Hawaiian and Other Pacific Islander alone (%)
Races - Native Hawaiian and Other Pacific Islander alone (% change since 2000)
Races - Two or more races(%)
Races - Two or more races(% change since 2000)
Races - Other race alone (%)
Races - Other race alone (% change since 2000)
Racial diversity
Place of birth - Born in state of residence (%)
Place of birth - Born in state of residence (%) - White
Place of birth - Born in state of residence (%) - Black or African American
Place of birth - Born in state of residence (%) - Asian
Place of birth - Born in state of residence (%) - Hispanic or Latino
Place of birth - Born in state of residence (%) - American Indian and Alaska Native
Place of birth - Born in state of residence (%) - Multirace
Place of birth - Born in state of residence (%) - Other Race
Place of birth - Born in other state (%)
Place of birth - Born in other state (%) - White
Place of birth - Born in other state (%) - Black or African American
Place of birth - Born in other state (%) - Asian
Place of birth - Born in other state (%) - Hispanic or Latino
Place of birth - Born in other state (%) - American Indian and Alaska Native
Place of birth - Born in other state (%) - Multirace
Place of birth - Born in other state (%) - Other Race
Place of birth - Native, outside of US (%)
Place of birth - Native, outside of US (%) - White
Place of birth - Native, outside of US (%) - Black or African American
Place of birth - Native, outside of US (%) - Asian
Place of birth - Native, outside of US (%) - Hispanic or Latino
Place of birth - Native, outside of US (%) - American Indian and Alaska Native
Place of birth - Native, outside of US (%) - Multirace
Place of birth - Native, outside of US (%) - Other Race
Place of birth - Foreign born (%)
Place of birth - Foreign born (%) - White
Place of birth - Foreign born (%) - Black or African American
Place of birth - Foreign born (%) - Asian
Place of birth - Foreign born (%) - Hispanic or Latino
Place of birth - Foreign born (%) - American Indian and Alaska Native
Place of birth - Foreign born (%) - Multirace
Place of birth - Foreign born (%) - Other Race
Residents speaking English at home (%)
Residents speaking English at home - Born in the United States (%)
Residents speaking English at home - Native, born elsewhere (%)
Residents speaking English at home - Foreign born (%)
Residents speaking Spanish at home (%)
Residents speaking Spanish at home - Born in the United States (%)
Residents speaking Spanish at home - Native, born elsewhere (%)
Residents speaking Spanish at home - Foreign born (%)
Residents speaking other language at home (%)
Residents speaking other language at home - Born in the United States (%)
Residents speaking other language at home - Native, born elsewhere (%)
Residents speaking other language at home - Foreign born (%)
Marital status - Never married (%)
Marital status - Now married (%)
Marital status - Separated (%)
Marital status - Widowed (%)
Marital status - Divorced (%)
Ancestries Reported - Arab (%)
Ancestries Reported - Czech (%)
Ancestries Reported - Danish (%)
Ancestries Reported - Dutch (%)
Ancestries Reported - English (%)
Ancestries Reported - French (%)
Ancestries Reported - French Canadian (%)
Ancestries Reported - German (%)
Ancestries Reported - Greek (%)
Ancestries Reported - Hungarian (%)
Ancestries Reported - Irish (%)
Ancestries Reported - Italian (%)
Ancestries Reported - Lithuanian (%)
Ancestries Reported - Norwegian (%)
Ancestries Reported - Polish (%)
Ancestries Reported - Portuguese (%)
Ancestries Reported - Russian (%)
Ancestries Reported - Scotch-Irish (%)
Ancestries Reported - Scottish (%)
Ancestries Reported - Slovak (%)
Ancestries Reported - Subsaharan African (%)
Ancestries Reported - Swedish (%)
Ancestries Reported - Swiss (%)
Ancestries Reported - Ukrainian (%)
Ancestries Reported - United States (%)
Ancestries Reported - Welsh (%)
Ancestries Reported - West Indian (%)
Ancestries Reported - Other (%)
Geographical mobility - Same house 1 year ago (%)
Geographical mobility - Same house 1 year ago (%) - White
Geographical mobility - Same house 1 year ago (%) - Black or African American
Geographical mobility - Same house 1 year ago (%) - Asian
Geographical mobility - Same house 1 year ago (%) - Hispanic or Latino
Geographical mobility - Same house 1 year ago (%) - American Indian and Alaska Native
Geographical mobility - Same house 1 year ago (%) - Multirace
Geographical mobility - Same house 1 year ago (%) - Other Race
Geographical mobility - Moved within same county (%)
Geographical mobility - Moved within same county (%) - White
Geographical mobility - Moved within same county (%) - Black or African American
Geographical mobility - Moved within same county (%) - Asian
Geographical mobility - Moved within same county (%) - Hispanic or Latino
Geographical mobility - Moved within same county (%) - American Indian and Alaska Native
Geographical mobility - Moved within same county (%) - Multirace
Geographical mobility - Moved within same county (%) - Other Race
Geographical mobility - Moved from different county within same state (%)
Geographical mobility - Moved from different county within same state (%) - White
Geographical mobility - Moved from different county within same state (%) - Black or African American
Geographical mobility - Moved from different county within same state (%) - Asian
Geographical mobility - Moved from different county within same state (%) - Hispanic or Latino
Geographical mobility - Moved from different county within same state (%) - American Indian and Alaska Native
Geographical mobility - Moved from different county within same state (%) - Multirace
Geographical mobility - Moved from different county within same state (%) - Other Race
Geographical mobility - Moved from different state (%)
Geographical mobility - Moved from different state (%) - White
Geographical mobility - Moved from different state (%) - Black or African American
Geographical mobility - Moved from different state (%) - Asian
Geographical mobility - Moved from different state (%) - Hispanic or Latino
Geographical mobility - Moved from different state (%) - American Indian and Alaska Native
Geographical mobility - Moved from different state (%) - Multirace
Geographical mobility - Moved from different state (%) - Other Race
Geographical mobility - Moved from abroad (%)
Geographical mobility - Moved from abroad (%) - White
Geographical mobility - Moved from abroad (%) - Black or African American
Geographical mobility - Moved from abroad (%) - Asian
Geographical mobility - Moved from abroad (%) - Hispanic or Latino
Geographical mobility - Moved from abroad (%) - American Indian and Alaska Native
Geographical mobility - Moved from abroad (%) - Multirace
Geographical mobility - Moved from abroad (%) - Other Race
Place of birth for the foreign-born population - Ireland (%)
Place of birth for the foreign-born population - Denmark (%)
Place of birth for the foreign-born population - Norway (%)
Place of birth for the foreign-born population - Sweden (%)
Place of birth for the foreign-born population - United Kingdom (%)
Place of birth for the foreign-born population - England (%)
Place of birth for the foreign-born population - Scotland (%)
Place of birth for the foreign-born population - Other Northern Europe (%)
Place of birth for the foreign-born population - Austria (%)
Place of birth for the foreign-born population - Belgium (%)
Place of birth for the foreign-born population - France (%)
Place of birth for the foreign-born population - Germany (%)
Place of birth for the foreign-born population - Netherlands (%)
Place of birth for the foreign-born population - Switzerland (%)
Place of birth for the foreign-born population - Other Western Europe (%)
Place of birth for the foreign-born population - Greece (%)
Place of birth for the foreign-born population - Italy (%)
Place of birth for the foreign-born population - Portugal (%)
Place of birth for the foreign-born population - Spain (%)
Place of birth for the foreign-born population - Other Southern Europe (%)
Place of birth for the foreign-born population - Albania (%)
Place of birth for the foreign-born population - Belarus (%)
Place of birth for the foreign-born population - Bosnia and Herzegovina (%)
Place of birth for the foreign-born population - Bulgaria (%)
Place of birth for the foreign-born population - Croatia (%)
Place of birth for the foreign-born population - Czechoslovakia (%)
Place of birth for the foreign-born population - Hungary (%)
Place of birth for the foreign-born population - Latvia (%)
Place of birth for the foreign-born population - Lithuania (%)
Place of birth for the foreign-born population - North Macedonia (Macedonia) (%)
Place of birth for the foreign-born population - Moldova (%)
Place of birth for the foreign-born population - Poland (%)
Place of birth for the foreign-born population - Romania (%)
Place of birth for the foreign-born population - Russia (%)
Place of birth for the foreign-born population - Serbia (%)
Place of birth for the foreign-born population - Ukraine (%)
Place of birth for the foreign-born population - Other Eastern Europe (%)
Place of birth for the foreign-born population - China (%)
Place of birth for the foreign-born population - Hong Kong (%)
Place of birth for the foreign-born population - Taiwan (%)
Place of birth for the foreign-born population - Japan (%)
Place of birth for the foreign-born population - Korea (%)
Place of birth for the foreign-born population - Other Eastern Asia (%)
Place of birth for the foreign-born population - Afghanistan (%)
Place of birth for the foreign-born population - Bangladesh (%)
Place of birth for the foreign-born population - India (%)
Place of birth for the foreign-born population - Iran (%)
Place of birth for the foreign-born population - Kazakhstan (%)
Place of birth for the foreign-born population - Nepal (%)
Place of birth for the foreign-born population - Pakistan (%)
Place of birth for the foreign-born population - Sri Lanka (%)
Place of birth for the foreign-born population - Uzbekistan (%)
Place of birth for the foreign-born population - Other South Central Asia (%)
Place of birth for the foreign-born population - Burma (%)
Place of birth for the foreign-born population - Cambodia (%)
Place of birth for the foreign-born population - Indonesia (%)
Place of birth for the foreign-born population - Laos (%)
Place of birth for the foreign-born population - Malaysia (%)
Place of birth for the foreign-born population - Philippines (%)
Place of birth for the foreign-born population - Singapore (%)
Place of birth for the foreign-born population - Thailand (%)
Place of birth for the foreign-born population - Vietnam (%)
Place of birth for the foreign-born population - Other South Eastern Asia (%)
Place of birth for the foreign-born population - Armenia (%)
Place of birth for the foreign-born population - Iraq (%)
Place of birth for the foreign-born population - Israel (%)
Place of birth for the foreign-born population - Jordan (%)
Place of birth for the foreign-born population - Kuwait (%)
Place of birth for the foreign-born population - Lebanon (%)
Place of birth for the foreign-born population - Saudi Arabia (%)
Place of birth for the foreign-born population - Syria (%)
Place of birth for the foreign-born population - Turkey (%)
Place of birth for the foreign-born population - Yemen (%)
Place of birth for the foreign-born population - Other Western Asia (%)
Place of birth for the foreign-born population - Eritrea (%)
Place of birth for the foreign-born population - Ethiopia (%)
Place of birth for the foreign-born population - Kenya (%)
Place of birth for the foreign-born population - Somalia (%)
Place of birth for the foreign-born population - Uganda (%)
Place of birth for the foreign-born population - Zimbabwe (%)
Place of birth for the foreign-born population - Other Eastern Africa (%)
Place of birth for the foreign-born population - Cameroon (%)
Place of birth for the foreign-born population - Congo (%)
Place of birth for the foreign-born population - Democratic Republic of Congo (Zaire) (%)
Place of birth for the foreign-born population - Other Middle Africa (%)
Place of birth for the foreign-born population - Egypt (%)
Place of birth for the foreign-born population - Morocco (%)
Place of birth for the foreign-born population - Sudan (%)
Place of birth for the foreign-born population - Other Northern Africa (%)
Place of birth for the foreign-born population - South Africa (%)
Place of birth for the foreign-born population - Other Southern Africa (%)
Place of birth for the foreign-born population - Cabo Verde (%)
Place of birth for the foreign-born population - Ghana (%)
Place of birth for the foreign-born population - Liberia (%)
Place of birth for the foreign-born population - Nigeria (%)
Place of birth for the foreign-born population - Senegal (%)
Place of birth for the foreign-born population - Sierra Leone (%)
Place of birth for the foreign-born population - Other Western Africa (%)
Place of birth for the foreign-born population - Australia (%)
Place of birth for the foreign-born population - New Zealand (%)
Place of birth for the foreign-born population - Fiji (%)
Place of birth for the foreign-born population - Micronesia (%)
Place of birth for the foreign-born population - Bahamas (%)
Place of birth for the foreign-born population - Barbados (%)
Place of birth for the foreign-born population - Cuba (%)
Place of birth for the foreign-born population - Dominica (%)
Place of birth for the foreign-born population - Dominican Republic (%)
Place of birth for the foreign-born population - Grenada (%)
Place of birth for the foreign-born population - Haiti (%)
Place of birth for the foreign-born population - Jamaica (%)
Place of birth for the foreign-born population - St. Vincent and the Grenadines (%)
Place of birth for the foreign-born population - Trinidad and Tobago (%)
Place of birth for the foreign-born population - West Indies (%)
Place of birth for the foreign-born population - Other Caribbean (%)
Place of birth for the foreign-born population - Belize (%)
Place of birth for the foreign-born population - Costa Rica (%)
Place of birth for the foreign-born population - El Salvador (%)
Place of birth for the foreign-born population - Guatemala (%)
Place of birth for the foreign-born population - Honduras (%)
Place of birth for the foreign-born population - Mexico (%)
Place of birth for the foreign-born population - Nicaragua (%)
Place of birth for the foreign-born population - Panama (%)
Place of birth for the foreign-born population - Other Central America (%)
Place of birth for the foreign-born population - Argentina (%)
Place of birth for the foreign-born population - Bolivia (%)
Place of birth for the foreign-born population - Brazil (%)
Place of birth for the foreign-born population - Chile (%)
Place of birth for the foreign-born population - Colombia (%)
Place of birth for the foreign-born population - Ecuador (%)
Place of birth for the foreign-born population - Guyana (%)
Place of birth for the foreign-born population - Peru (%)
Place of birth for the foreign-born population - Uruguay (%)
Place of birth for the foreign-born population - Venezuela (%)
Place of birth for the foreign-born population - Other South America (%)
Place of birth for the foreign-born population - Canada (%)
Place of birth for the foreign-born population - Other Northern America (%)
Place of birth for the foreign-born population - Other (%)
Latest news about races in Mason, OH collected exclusively by city-data.com from local newspapers, TV, and radio stations
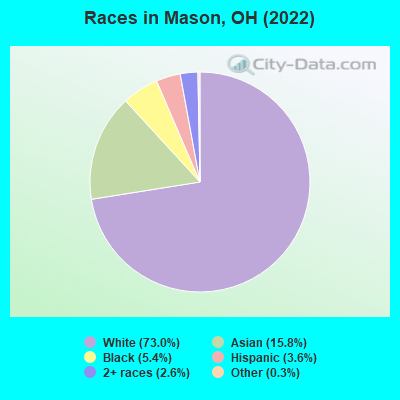
According to 2022 data, the most numerous races in Mason, OH are White alone (26,067 residents), Black alone (1,926 residents), and Two or more races (939 residents). 80.1% of Mason residents speak English at home. 16.6% of Mason, OH residents are foreign-born (12.3% born in Asia, 1.8% born in Europe), which is 76.0% greater than the foreign-born rate of 4.0% across the entire state of Ohio.
Race distribution in Mason
2000 2022
9,538,111 84.0% White alone 1,290,662 11.4% Black alone 217,123 1.9% Hispanic 137,770 1.2% Two or more races 131,670 1.2% Asian alone 21,985 0.2% American Indian alone 13,483 0.1% Other race alone 2,336 0.02% Native Hawaiian and Other
8,948,793 76.1% White alone 1,401,403 11.9% Black alone 529,291 4.5% Two or more races 517,232 4.4% Hispanic 293,387 2.5% Asian alone 52,805 0.4% Other race alone 9,785 0.08% American Indian alone 3,362 0.03% Native Hawaiian and Other
Income and house value in Mason Median household income in 2022 $106,678 White non-Hispanic householders$129,222 Black householders$166,306 Asian householdersover $200,000 Some other race householders$152,535 Two or more races householdersover $200,000 Hispanic or Latino race householdersMedian 2022 house value $420,798 White Non-Hispanic householders$591,296 Black or African American householders$279,987 American Indian or Alaska Native householders $557,523 Asian householders$374,496 Native Hawaiian and other Pacific Islander householders$204,270 Two or more races householders$862,568 Hispanic or Latino householders
Median age by race in Mason
44.6 Median age for White residents43.0 46.3 29.6 Median age for Black or African American residents17.0 28.5 -676,818,950.3 Median age for American Indian / Alaska Native residents-685,185,184.5 -1,189,189,188.0 36.6 Median age for Asian residents35.6 37.7 -666,666,666.0 Median age for Native Hawaiian / Pacific Islander residents-666,666,666.0 -666,666,666.0 41.6 Median age for Other race residents4.6 49.0 42.1 Median age for Two or more races residents55.6 33.3 44.5 Median age for White alone residents43.1 46.5 44.9 Median age for Hispanic or Latino residents46.6 44.2
Owner/renter occupied households by race in Mason
House owners and renters - White residents 8,560 82.3% Owner occupied1,835 17.7% Renter occupiedHouse owners and renters - Black or African American residents 279 59.9% Owner occupied187 40.1% Renter occupiedHouse owners and renters - Asian residents 1,867 87.1% Owner occupied275 12.9% Renter occupiedHouse owners and renters - Other race residents 50 75.7% Owner occupied16 24.3% Renter occupiedHouse owners and renters - Two or more races residents 432 70.5% Owner occupied181 29.5% Renter occupiedHouse owners and renters - White alone residents 8,526 82.1% Owner occupied1,854 17.9% Renter occupiedHouse owners and renters - Hispanic or Latino residents 382 93.7% Owner occupied26 6.3% Renter occupied
Language usage in Mason
English speakers - Total 80.1% of residents of Mason speak English at home.
2.5% of residents speak Spanish at home 741 87.8% Speak English very well103 12.2% Speak English less than very well18.0% of residents speak other language at home 4,911 80.3% Speak English very well1,204 19.7% Speak English less than very well
English speakers - Born in the United States 94.1% of residents of Mason speak English at home.
1.7% of residents speak Spanish at home 159 85.9% Speak English very well26 14.1% Speak English less than very well3.0% of residents speak other language at home 313 94.6% Speak English very well18 5.4% Speak English less than very well
English speakers - Native, born elsewhere 39.1% of residents of Mason speak English at home.
55.4% of residents speak Spanish at home 181 100.0% Speak English very well9.8% of residents speak other language at home 32 100.0% Speak English very well
English speakers - Foreign-born 16.6% of residents of Mason speak English at home.
5.6% of residents speak Spanish at home 314 85.3% Speak English very well54 14.7% Speak English less than very well78.7% of residents speak other language at home 4,072 78.5% Speak English very well1,118 21.5% Speak English less than very well
White (Caucasian) - Speak only English Native:
97.8% (23,679)Foreign-born:
18.1% (196)
White (Caucasian) - Speak another language Native:
1.7% (422)Foreign-born:
77.2% (836)
Black or African American - Speak only English Native:
95.2% (1,220)Foreign-born:
100.0% (247)
Black or African American - Speak another language Native:
1.3% (17)Foreign-born:
8.0% (20)
Asian - Speak only English Native:
52.2% (487)Foreign-born:
11.8% (505)
Asian - Speak another language Native:
40.3% (376)Foreign-born:
87.6% (3,743)
Other race - Speak another language Native:
100.0% (106)Foreign-born:
100.0% (104)
Two or more races - Speak only English Native:
74.5% (879)Foreign-born:
2.9% (16)
Two or more races - Speak another language Native:
32.5% (383)Foreign-born:
100.0% (560)
White alone - Speak only English Native:
98.1% (23,567)Foreign-born:
15.4% (174)
White alone - Speak another language Native:
1.6% (394)Foreign-born:
83.6% (942)
Hispanic or Latino - Speak only English Native:
39.5% (325)Foreign-born:
9.6% (32)
Hispanic or Latino - Speak another language Native:
66.0% (542)Foreign-born:
100.0% (334)
Foreign-born residents in Mason 5,945 residents are foreign born (12.3% Asia , 1.8% Europe ).
Marital status for residents in Mason Marital status - White (Caucasian) population 15 years and over
Males 23.3% Never married64.8% Now married0.3% Separated3.3% Widowed8.2% DivorcedFemales 22.5% Never married56.1% Now married0.7% Separated7.6% Widowed13.1% DivorcedWomen who gave birth in the past 12 months Now married:
100.0% (257)Unmarried:
0.0% (0)
Women who did not give birth in the past 12 months Now married:
46.9% (2,602)Unmarried:
53.1% (2,943)
Marital status - Black or African American population 15 years and over
Males 44.3% Never married49.7% Now married2.4% Separated0.0% Widowed3.5% DivorcedFemales 52.6% Never married22.5% Now married2.4% Separated8.3% Widowed14.2% DivorcedWomen who gave birth in the past 12 months Now married:
100.0% (12)Unmarried:
0.0% (0)
Women who did not give birth in the past 12 months Now married:
26.2% (112)Unmarried:
73.8% (316)
Marital status - Asian population 15 years and over
Males 24.5% Never married72.6% Now married0.0% Separated0.0% Widowed3.0% DivorcedFemales 20.0% Never married71.6% Now married0.0% Separated5.0% Widowed3.3% DivorcedWomen who gave birth in the past 12 months Now married:
100.0% (86)Unmarried:
0.0% (0)
Women who did not give birth in the past 12 months Now married:
67.4% (941)Unmarried:
32.6% (455)
Marital status - Other race population 15 years and over
Males 0.0% Never married100.0% Now married0.0% Separated0.0% Widowed0.0% DivorcedFemales 36.1% Never married29.5% Now married23.0% Separated0.0% Widowed11.5% DivorcedWomen who did not give birth in the past 12 months Now married:
59.3% (85)Unmarried:
40.7% (58)
Marital status - Two or more races population 15 years and over
Males 38.6% Never married59.9% Now married0.0% Separated0.0% Widowed1.6% DivorcedFemales 45.8% Never married50.0% Now married0.0% Separated4.2% Widowed0.0% DivorcedWomen who gave birth in the past 12 months Now married:
0.0% (0)Unmarried:
100.0% (133)
Women who did not give birth in the past 12 months Now married:
59.8% (317)Unmarried:
40.2% (213)
Marital status - White alone, not Hispanic / Latino population 15 years and over
Males 23.3% Never married64.7% Now married0.3% Separated3.4% Widowed8.3% DivorcedFemales 22.5% Never married56.2% Now married0.5% Separated7.7% Widowed13.2% DivorcedWomen who gave birth in the past 12 months Now married:
100.0% (261)Unmarried:
0.0% (0)
Women who did not give birth in the past 12 months Now married:
46.5% (2,572)Unmarried:
53.5% (2,955)
Marital status - Hispanic or Latino population 15 years and over
Males 24.9% Never married75.1% Now married0.0% Separated0.0% Widowed0.0% DivorcedFemales 35.8% Never married47.7% Now married13.4% Separated0.0% Widowed3.1% DivorcedWomen who did not give birth in the past 12 months Now married:
60.9% (270)Unmarried:
39.1% (173)
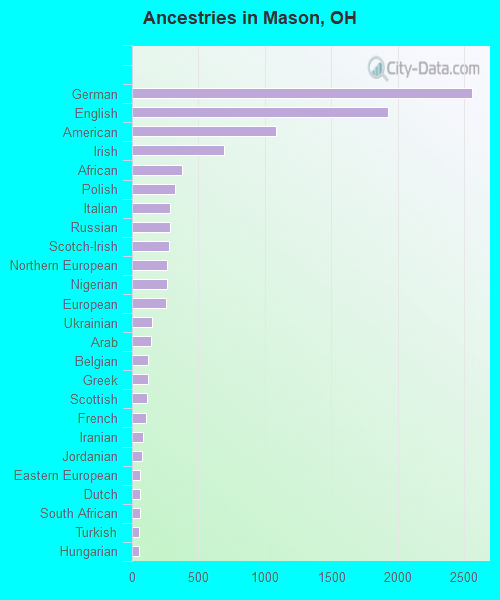
Ancestries in Mason
2,561 14.2% German1,927 10.7% English1,086 6.0% American694 3.9% Irish374 2.1% African324 1.8% Polish285 1.6% Italian284 1.6% Russian281 1.6% Scotch-Irish264 1.5% Northern European262 1.5% Nigerian257 1.4% European149 0.8% Ukrainian143 0.8% Arab120 0.7% Belgian119 0.7% Greek114 0.6% Scottish105 0.6% French84 0.5% Iranian75 0.4% Jordanian61 0.3% Eastern European60 0.3% Dutch60 0.3% South African53 0.3% Turkish51 0.3% Hungarian45 0.3% French Canadian32 0.2% Slovene31 0.2% Ghanaian27 0.2% Swedish26 0.1% Canadian22 0.1% British20 0.1% Slovak15 0.08% Lebanese14 0.08% Yugoslavian10 0.06% Armenian7 0.04% Palestinian7 0.04% Moroccan
Geographical mobility in Mason Same house 1 year ago 23,533 90.3% White (Caucasian)1,550 85.7% Black or African American4,370 82.5% Asian305 98.6% Other race1,830 97.6% Two or more races23,176 89.7% White alone, not Hispanic / Latino1,222 100.0% Hispanic or LatinoMoved within same county 648 2.5% White / Caucasian274 15.2% Black or African American101 1.9% Asian63 3.3% Two or more races672 2.6% White alone, not Hispanic / LatinoMoved within same state 1,236 4.7% White / Caucasian31 1.7% Black or African American276 5.2% Asian20 1.1% Two or more races1,278 4.9% White alone, not Hispanic / LatinoMoved from different state 477 1.8% White / Caucasian123 6.8% Black or African American258 4.9% Asian512 2.0% White alone, not Hispanic / LatinoMoved from abroad 70 0.3% White229 4.3% Asian78 0.3% White alone, not Hispanic / Latino
Children Nativity (place of birth) in Mason
Children under 6 years - Living with two parents Both parents native 463 100.0% NativeBoth parents foreign-born 606 89.9% Native68 10.1% Foreign-bornOne native, one foreign-born parent 468 100.0% NativeChildren under 6 years - Living with one parent Native parent 311 99.7% Native1 0.3% Foreign-bornForeign-born parent 16 42.6% Native22 57.4% Foreign-bornChildren 6 to 17 years - Living with two parents Both parents native 3,837 100.0% NativeBoth parents foreign-born 1,417 78.3% Native394 21.7% Foreign-bornOne native, one foreign-born parent 423 96.1% Native17 3.9% Foreign-bornChildren 6 to 17 years - Living with one parent Native parent 418 72.8% Native156 27.2% Foreign-bornForeign-born parent 244 81.2% Native56 18.8% Foreign-born
Grandparents responsible for own grandchildren in Mason
Grandparents (30 to 59 years) White / Caucasian 60 43.7% Responsible for grandchildren77 56.3% Not responsible for grandchildrenBlack or African American 41 100.0% Not responsible for grandchildrenAsian 41 100.0% Not responsible for grandchildrenWhite alone, not Hispanic / Latino 60 41.8% Responsible for grandchildren84 58.2% Not responsible for grandchildrenGrandparents (60 years and over) White / Caucasian 62 37.1% Responsible for grandchildren104 62.9% Not responsible for grandchildrenBlack or African American 54 100.0% Not responsible for grandchildrenAsian 32 39.1% Responsible for grandchildren49 60.9% Not responsible for grandchildrenWhite alone, not Hispanic / Latino 62 37.8% Responsible for grandchildren102 62.2% Not responsible for grandchildren