Races in La Sara, Texas (TX) Detailed Stats
Ancestries, Foreign-born residents, place of birth
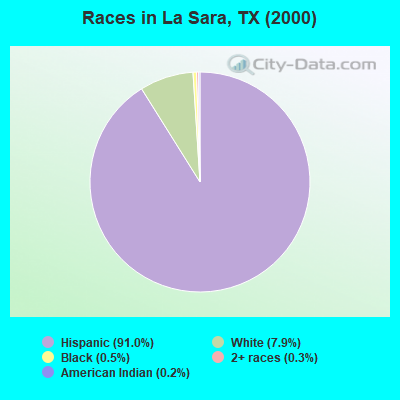
Race distribution in La Sara

- 6,44491.0%Hispanic
- 5627.9%White alone
- 370.5%Black alone
- 200.3%Two or more races
- 150.2%American Indian alone
- 50.07%Asian alone
- 10.01%Other race alone
2000
2022
-
- 10,933,31352.4%White alone
- 6,669,66632.0%Hispanic
- 2,364,25511.3%Black alone
- 554,4452.7%Asian alone
- 230,5671.1%Two or more races
- 68,8590.3%American Indian alone
- 19,9580.10%Other race alone
- 10,7570.05%Native Hawaiian and Other
Pacific Islander alone

-
- 12,070,64240.2%Hispanic
- 11,683,43038.9%White alone
- 3,508,70611.7%Black alone
- 1,608,1735.4%Asian alone
- 956,5603.2%Two or more races
- 125,7630.4%Other race alone
- 47,0230.2%American Indian alone
- 29,2750.10%Native Hawaiian and Other
Pacific Islander alone

Income and house value in La Sara
- Median household income in 2022
- $58,574White non-Hispanic householders
- $56,762Black householders
- $15,692American Indian and Alaska Native householders
- $37,340Some other race householders
- $58,511Two or more races householders
- $37,563Hispanic or Latino race householders
- Median 2022 house value
- $129,406White Non-Hispanic householders
- $106,067Black or African American householders
- $100,059American Indian or Alaska Native householders
- $61,005Some other race householders
- $39,515Two or more races householders
- $61,930Hispanic or Latino householders
Household income for White non-Hispanic householders

Household income for Black householders

Household income for American Indian and Alaska Native householders

Household income for Two or more races householders

Household income for Hispanic or Latino race householders

Zip code: 78580