Races in Kent, Washington (WA) Detailed Stats
Data:
Races - White alone (%)
Races - White alone (% change since 2000)
Races - Black alone (%)
Races - Black alone (% change since 2000)
Races - American Indian alone (%)
Races - American Indian alone (% change since 2000)
Races - Asian alone (%)
Races - Asian alone (% change since 2000)
Races - Hispanic (%)
Races - Hispanic (% change since 2000)
Races - Native Hawaiian and Other Pacific Islander alone (%)
Races - Native Hawaiian and Other Pacific Islander alone (% change since 2000)
Races - Two or more races(%)
Races - Two or more races(% change since 2000)
Races - Other race alone (%)
Races - Other race alone (% change since 2000)
Racial diversity
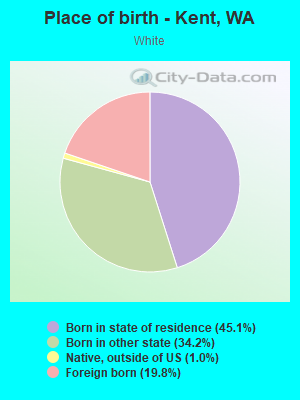
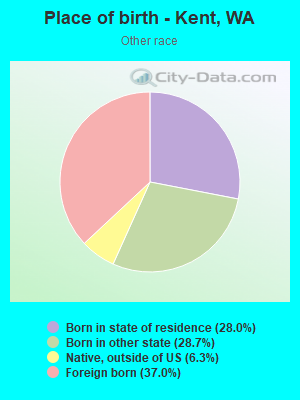
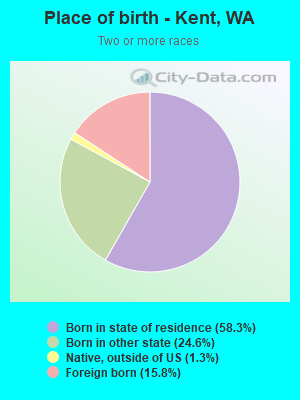
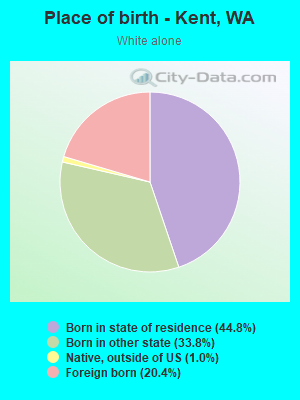
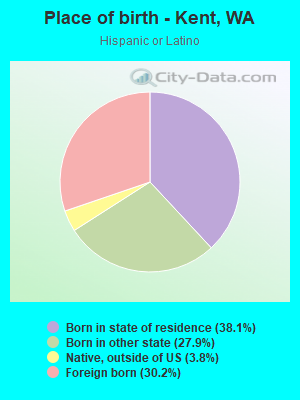
Place of birth - Born in state of residence (%)
Place of birth - Born in state of residence (%) - White
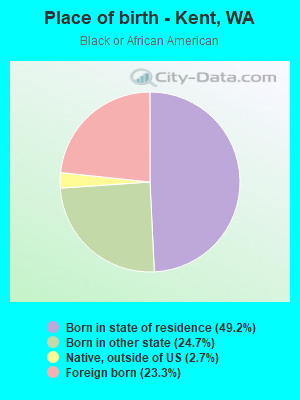
Place of birth - Born in state of residence (%) - Black or African American
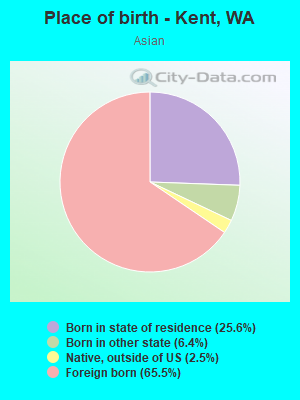
Place of birth - Born in state of residence (%) - Asian
Place of birth - Born in state of residence (%) - Hispanic or Latino
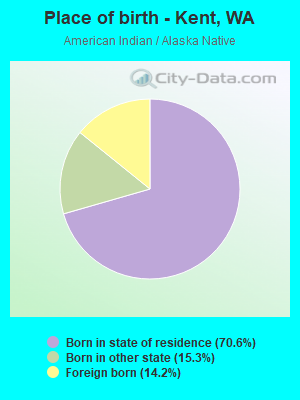
Place of birth - Born in state of residence (%) - American Indian and Alaska Native
Place of birth - Born in state of residence (%) - Multirace
Place of birth - Born in state of residence (%) - Other Race
Place of birth - Born in other state (%)
Place of birth - Born in other state (%) - White
Place of birth - Born in other state (%) - Black or African American
Place of birth - Born in other state (%) - Asian
Place of birth - Born in other state (%) - Hispanic or Latino
Place of birth - Born in other state (%) - American Indian and Alaska Native
Place of birth - Born in other state (%) - Multirace
Place of birth - Born in other state (%) - Other Race
Place of birth - Native, outside of US (%)
Place of birth - Native, outside of US (%) - White
Place of birth - Native, outside of US (%) - Black or African American
Place of birth - Native, outside of US (%) - Asian
Place of birth - Native, outside of US (%) - Hispanic or Latino
Place of birth - Native, outside of US (%) - American Indian and Alaska Native
Place of birth - Native, outside of US (%) - Multirace
Place of birth - Native, outside of US (%) - Other Race
Place of birth - Foreign born (%)
Place of birth - Foreign born (%) - White
Place of birth - Foreign born (%) - Black or African American
Place of birth - Foreign born (%) - Asian
Place of birth - Foreign born (%) - Hispanic or Latino
Place of birth - Foreign born (%) - American Indian and Alaska Native
Place of birth - Foreign born (%) - Multirace
Place of birth - Foreign born (%) - Other Race
Residents speaking English at home (%)
Residents speaking English at home - Born in the United States (%)
Residents speaking English at home - Native, born elsewhere (%)
Residents speaking English at home - Foreign born (%)
Residents speaking Spanish at home (%)
Residents speaking Spanish at home - Born in the United States (%)
Residents speaking Spanish at home - Native, born elsewhere (%)
Residents speaking Spanish at home - Foreign born (%)
Residents speaking other language at home (%)
Residents speaking other language at home - Born in the United States (%)
Residents speaking other language at home - Native, born elsewhere (%)
Residents speaking other language at home - Foreign born (%)
Marital status - Never married (%)
Marital status - Now married (%)
Marital status - Separated (%)
Marital status - Widowed (%)
Marital status - Divorced (%)
Ancestries Reported - Arab (%)
Ancestries Reported - Czech (%)
Ancestries Reported - Danish (%)
Ancestries Reported - Dutch (%)
Ancestries Reported - English (%)
Ancestries Reported - French (%)
Ancestries Reported - French Canadian (%)
Ancestries Reported - German (%)
Ancestries Reported - Greek (%)
Ancestries Reported - Hungarian (%)
Ancestries Reported - Irish (%)
Ancestries Reported - Italian (%)
Ancestries Reported - Lithuanian (%)
Ancestries Reported - Norwegian (%)
Ancestries Reported - Polish (%)
Ancestries Reported - Portuguese (%)
Ancestries Reported - Russian (%)
Ancestries Reported - Scotch-Irish (%)
Ancestries Reported - Scottish (%)
Ancestries Reported - Slovak (%)
Ancestries Reported - Subsaharan African (%)
Ancestries Reported - Swedish (%)
Ancestries Reported - Swiss (%)
Ancestries Reported - Ukrainian (%)
Ancestries Reported - United States (%)
Ancestries Reported - Welsh (%)
Ancestries Reported - West Indian (%)
Ancestries Reported - Other (%)
Geographical mobility - Same house 1 year ago (%)
Geographical mobility - Same house 1 year ago (%) - White
Geographical mobility - Same house 1 year ago (%) - Black or African American
Geographical mobility - Same house 1 year ago (%) - Asian
Geographical mobility - Same house 1 year ago (%) - Hispanic or Latino
Geographical mobility - Same house 1 year ago (%) - American Indian and Alaska Native
Geographical mobility - Same house 1 year ago (%) - Multirace
Geographical mobility - Same house 1 year ago (%) - Other Race
Geographical mobility - Moved within same county (%)
Geographical mobility - Moved within same county (%) - White
Geographical mobility - Moved within same county (%) - Black or African American
Geographical mobility - Moved within same county (%) - Asian
Geographical mobility - Moved within same county (%) - Hispanic or Latino
Geographical mobility - Moved within same county (%) - American Indian and Alaska Native
Geographical mobility - Moved within same county (%) - Multirace
Geographical mobility - Moved within same county (%) - Other Race
Geographical mobility - Moved from different county within same state (%)
Geographical mobility - Moved from different county within same state (%) - White
Geographical mobility - Moved from different county within same state (%) - Black or African American
Geographical mobility - Moved from different county within same state (%) - Asian
Geographical mobility - Moved from different county within same state (%) - Hispanic or Latino
Geographical mobility - Moved from different county within same state (%) - American Indian and Alaska Native
Geographical mobility - Moved from different county within same state (%) - Multirace
Geographical mobility - Moved from different county within same state (%) - Other Race
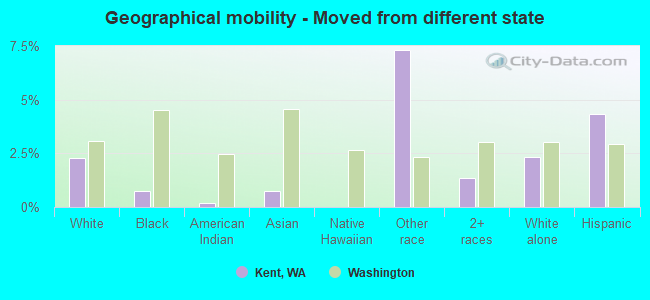
Geographical mobility - Moved from different state (%)
Geographical mobility - Moved from different state (%) - White
Geographical mobility - Moved from different state (%) - Black or African American
Geographical mobility - Moved from different state (%) - Asian
Geographical mobility - Moved from different state (%) - Hispanic or Latino
Geographical mobility - Moved from different state (%) - American Indian and Alaska Native
Geographical mobility - Moved from different state (%) - Multirace
Geographical mobility - Moved from different state (%) - Other Race
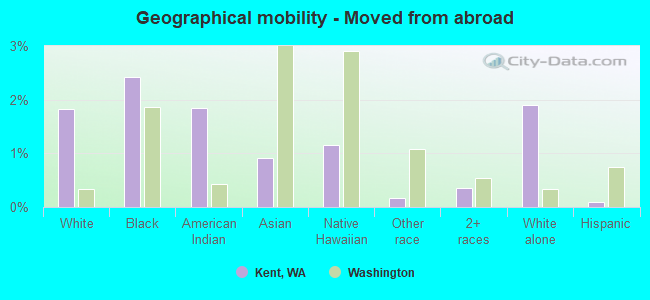
Geographical mobility - Moved from abroad (%)
Geographical mobility - Moved from abroad (%) - White
Geographical mobility - Moved from abroad (%) - Black or African American
Geographical mobility - Moved from abroad (%) - Asian
Geographical mobility - Moved from abroad (%) - Hispanic or Latino
Geographical mobility - Moved from abroad (%) - American Indian and Alaska Native
Geographical mobility - Moved from abroad (%) - Multirace
Geographical mobility - Moved from abroad (%) - Other Race
Place of birth for the foreign-born population - Ireland (%)
Place of birth for the foreign-born population - Denmark (%)
Place of birth for the foreign-born population - Norway (%)
Place of birth for the foreign-born population - Sweden (%)
Place of birth for the foreign-born population - United Kingdom (%)
Place of birth for the foreign-born population - England (%)
Place of birth for the foreign-born population - Scotland (%)
Place of birth for the foreign-born population - Other Northern Europe (%)
Place of birth for the foreign-born population - Austria (%)
Place of birth for the foreign-born population - Belgium (%)
Place of birth for the foreign-born population - France (%)
Place of birth for the foreign-born population - Germany (%)
Place of birth for the foreign-born population - Netherlands (%)
Place of birth for the foreign-born population - Switzerland (%)
Place of birth for the foreign-born population - Other Western Europe (%)
Place of birth for the foreign-born population - Greece (%)
Place of birth for the foreign-born population - Italy (%)
Place of birth for the foreign-born population - Portugal (%)
Place of birth for the foreign-born population - Spain (%)
Place of birth for the foreign-born population - Other Southern Europe (%)
Place of birth for the foreign-born population - Albania (%)
Place of birth for the foreign-born population - Belarus (%)
Place of birth for the foreign-born population - Bosnia and Herzegovina (%)
Place of birth for the foreign-born population - Bulgaria (%)
Place of birth for the foreign-born population - Croatia (%)
Place of birth for the foreign-born population - Czechoslovakia (%)
Place of birth for the foreign-born population - Hungary (%)
Place of birth for the foreign-born population - Latvia (%)
Place of birth for the foreign-born population - Lithuania (%)
Place of birth for the foreign-born population - North Macedonia (Macedonia) (%)
Place of birth for the foreign-born population - Moldova (%)
Place of birth for the foreign-born population - Poland (%)
Place of birth for the foreign-born population - Romania (%)
Place of birth for the foreign-born population - Russia (%)
Place of birth for the foreign-born population - Serbia (%)
Place of birth for the foreign-born population - Ukraine (%)
Place of birth for the foreign-born population - Other Eastern Europe (%)
Place of birth for the foreign-born population - China (%)
Place of birth for the foreign-born population - Hong Kong (%)
Place of birth for the foreign-born population - Taiwan (%)
Place of birth for the foreign-born population - Japan (%)
Place of birth for the foreign-born population - Korea (%)
Place of birth for the foreign-born population - Other Eastern Asia (%)
Place of birth for the foreign-born population - Afghanistan (%)
Place of birth for the foreign-born population - Bangladesh (%)
Place of birth for the foreign-born population - India (%)
Place of birth for the foreign-born population - Iran (%)
Place of birth for the foreign-born population - Kazakhstan (%)
Place of birth for the foreign-born population - Nepal (%)
Place of birth for the foreign-born population - Pakistan (%)
Place of birth for the foreign-born population - Sri Lanka (%)
Place of birth for the foreign-born population - Uzbekistan (%)
Place of birth for the foreign-born population - Other South Central Asia (%)
Place of birth for the foreign-born population - Burma (%)
Place of birth for the foreign-born population - Cambodia (%)
Place of birth for the foreign-born population - Indonesia (%)
Place of birth for the foreign-born population - Laos (%)
Place of birth for the foreign-born population - Malaysia (%)
Place of birth for the foreign-born population - Philippines (%)
Place of birth for the foreign-born population - Singapore (%)
Place of birth for the foreign-born population - Thailand (%)
Place of birth for the foreign-born population - Vietnam (%)
Place of birth for the foreign-born population - Other South Eastern Asia (%)
Place of birth for the foreign-born population - Armenia (%)
Place of birth for the foreign-born population - Iraq (%)
Place of birth for the foreign-born population - Israel (%)
Place of birth for the foreign-born population - Jordan (%)
Place of birth for the foreign-born population - Kuwait (%)
Place of birth for the foreign-born population - Lebanon (%)
Place of birth for the foreign-born population - Saudi Arabia (%)
Place of birth for the foreign-born population - Syria (%)
Place of birth for the foreign-born population - Turkey (%)
Place of birth for the foreign-born population - Yemen (%)
Place of birth for the foreign-born population - Other Western Asia (%)
Place of birth for the foreign-born population - Eritrea (%)
Place of birth for the foreign-born population - Ethiopia (%)
Place of birth for the foreign-born population - Kenya (%)
Place of birth for the foreign-born population - Somalia (%)
Place of birth for the foreign-born population - Uganda (%)
Place of birth for the foreign-born population - Zimbabwe (%)
Place of birth for the foreign-born population - Other Eastern Africa (%)
Place of birth for the foreign-born population - Cameroon (%)
Place of birth for the foreign-born population - Congo (%)
Place of birth for the foreign-born population - Democratic Republic of Congo (Zaire) (%)
Place of birth for the foreign-born population - Other Middle Africa (%)
Place of birth for the foreign-born population - Egypt (%)
Place of birth for the foreign-born population - Morocco (%)
Place of birth for the foreign-born population - Sudan (%)
Place of birth for the foreign-born population - Other Northern Africa (%)
Place of birth for the foreign-born population - South Africa (%)
Place of birth for the foreign-born population - Other Southern Africa (%)
Place of birth for the foreign-born population - Cabo Verde (%)
Place of birth for the foreign-born population - Ghana (%)
Place of birth for the foreign-born population - Liberia (%)
Place of birth for the foreign-born population - Nigeria (%)
Place of birth for the foreign-born population - Senegal (%)
Place of birth for the foreign-born population - Sierra Leone (%)
Place of birth for the foreign-born population - Other Western Africa (%)
Place of birth for the foreign-born population - Australia (%)
Place of birth for the foreign-born population - New Zealand (%)
Place of birth for the foreign-born population - Fiji (%)
Place of birth for the foreign-born population - Micronesia (%)
Place of birth for the foreign-born population - Bahamas (%)
Place of birth for the foreign-born population - Barbados (%)
Place of birth for the foreign-born population - Cuba (%)
Place of birth for the foreign-born population - Dominica (%)
Place of birth for the foreign-born population - Dominican Republic (%)
Place of birth for the foreign-born population - Grenada (%)
Place of birth for the foreign-born population - Haiti (%)
Place of birth for the foreign-born population - Jamaica (%)
Place of birth for the foreign-born population - St. Vincent and the Grenadines (%)
Place of birth for the foreign-born population - Trinidad and Tobago (%)
Place of birth for the foreign-born population - West Indies (%)
Place of birth for the foreign-born population - Other Caribbean (%)
Place of birth for the foreign-born population - Belize (%)
Place of birth for the foreign-born population - Costa Rica (%)
Place of birth for the foreign-born population - El Salvador (%)
Place of birth for the foreign-born population - Guatemala (%)
Place of birth for the foreign-born population - Honduras (%)
Place of birth for the foreign-born population - Mexico (%)
Place of birth for the foreign-born population - Nicaragua (%)
Place of birth for the foreign-born population - Panama (%)
Place of birth for the foreign-born population - Other Central America (%)
Place of birth for the foreign-born population - Argentina (%)
Place of birth for the foreign-born population - Bolivia (%)
Place of birth for the foreign-born population - Brazil (%)
Place of birth for the foreign-born population - Chile (%)
Place of birth for the foreign-born population - Colombia (%)
Place of birth for the foreign-born population - Ecuador (%)
Place of birth for the foreign-born population - Guyana (%)
Place of birth for the foreign-born population - Peru (%)
Place of birth for the foreign-born population - Uruguay (%)
Place of birth for the foreign-born population - Venezuela (%)
Place of birth for the foreign-born population - Other South America (%)
Place of birth for the foreign-born population - Canada (%)
Place of birth for the foreign-born population - Other Northern America (%)
Place of birth for the foreign-born population - Other (%)
Latest news about races in Kent, WA collected exclusively by city-data.com from local newspapers, TV, and radio stations
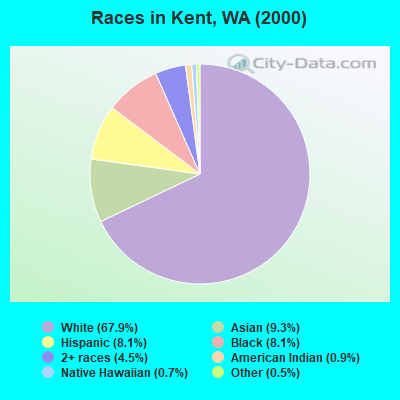
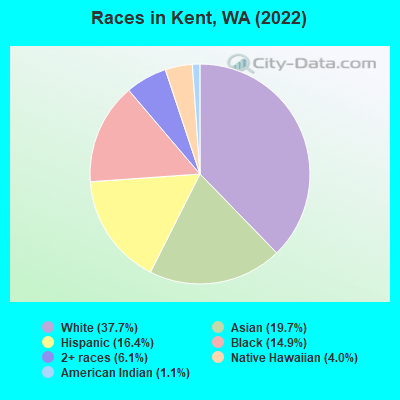
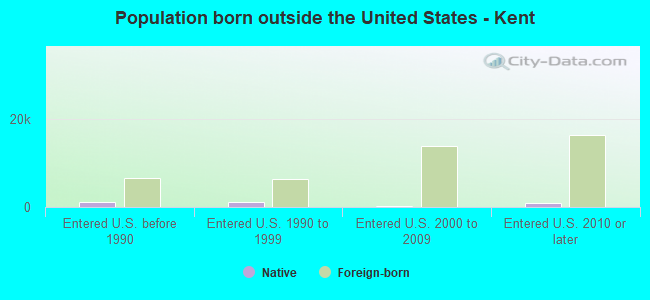
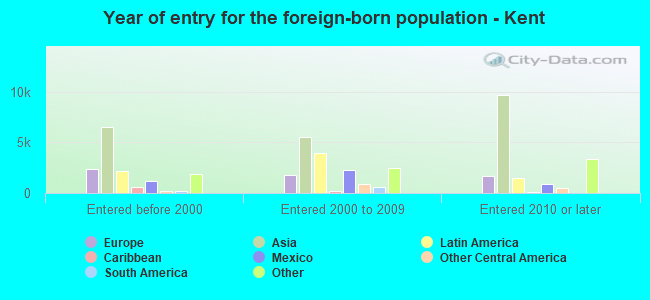
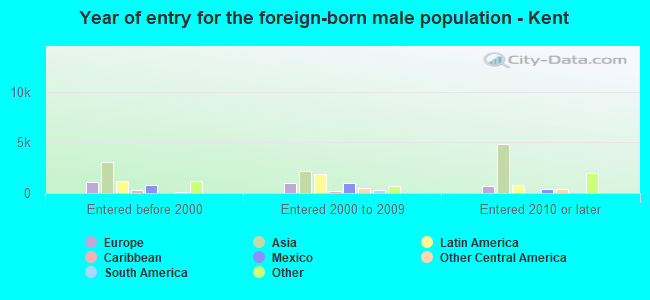
According to 2022 data, the most numerous races in Kent, WA are White alone (50,616 residents), Hispanic (22,108 residents), and Asian alone (26,448 residents). 56.8% of Kent residents speak English at home. 33.5% of Kent, WA residents are foreign-born (17.6% born in Asia, 6.6% born in Latin America), which is 55.3% greater than the foreign-born rate of 15.0% across the entire state of Washington.
Race distribution in Kent
2000 2022
53,964 67.9% White alone 7,407 9.3% Asian alone 6,466 8.1% Hispanic 6,444 8.1% Black alone 3,568 4.5% Two or more races 682 0.9% American Indian alone 587 0.7% Native Hawaiian and Other 406 0.5% Other race alone
50,616 37.7% White alone 26,448 19.7% Asian alone 22,108 16.4% Hispanic 19,997 14.9% Black alone 8,244 6.1% Two or more races 5,391 4.0% Native Hawaiian and Other 1,483 1.1% American Indian alone 113 0.08% Other race alone
2000 2022
4,652,490 78.9% White alone 441,509 7.5% Hispanic 319,401 5.4% Asian alone 184,631 3.1% Black alone 175,926 3.0% Two or more races 85,396 1.4% American Indian alone 22,779 0.4% Native Hawaiian and Other 11,989 0.2% Other race alone
4,941,456 63.5% White alone 1,093,313 14.0% Hispanic 755,832 9.7% Asian alone 523,448 6.7% Two or more races 299,537 3.8% Black alone 69,024 0.9% American Indian alone 52,231 0.7% Native Hawaiian and Other 50,945 0.7% Other race alone
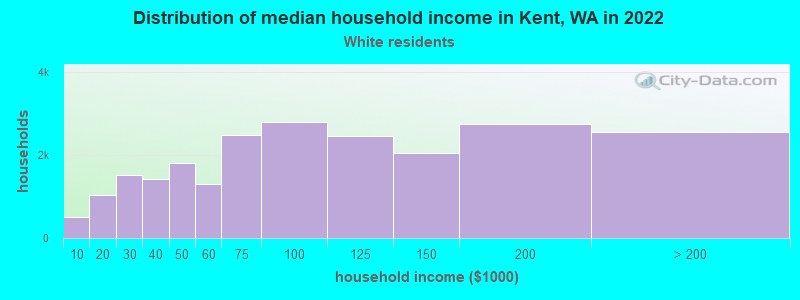
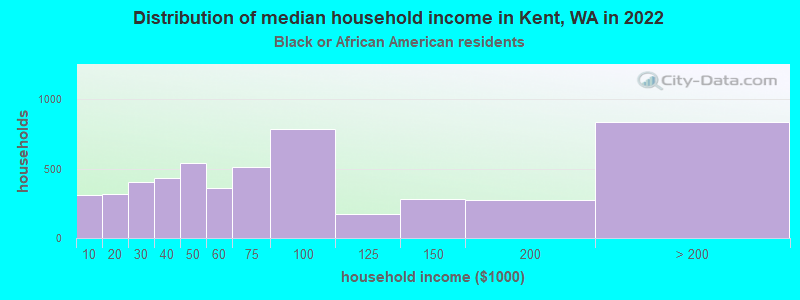
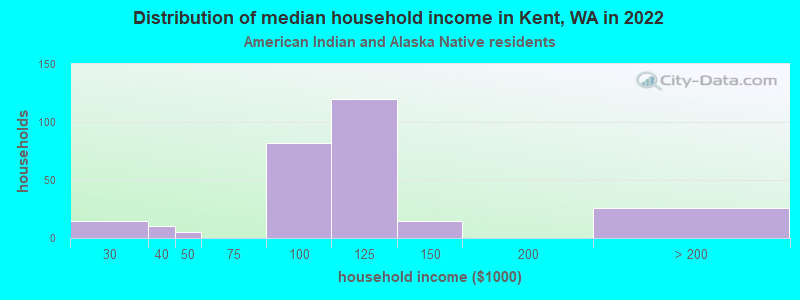
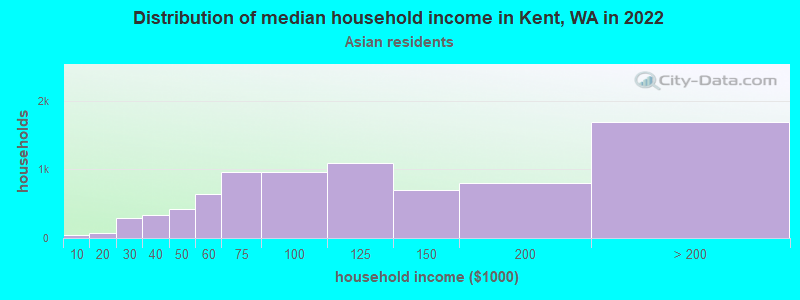
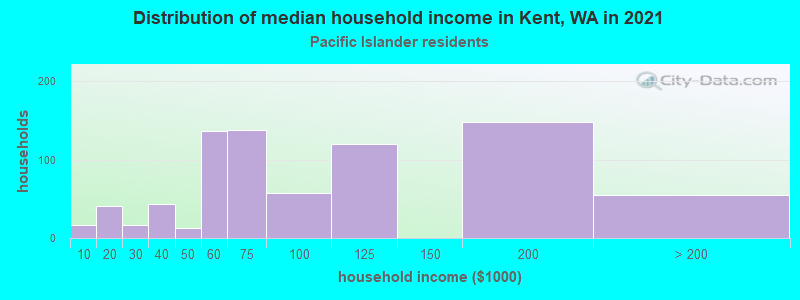
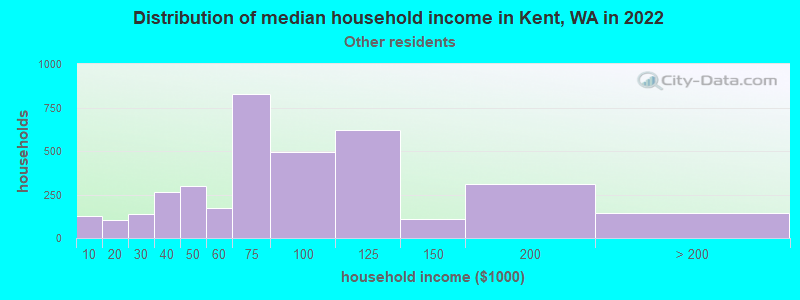
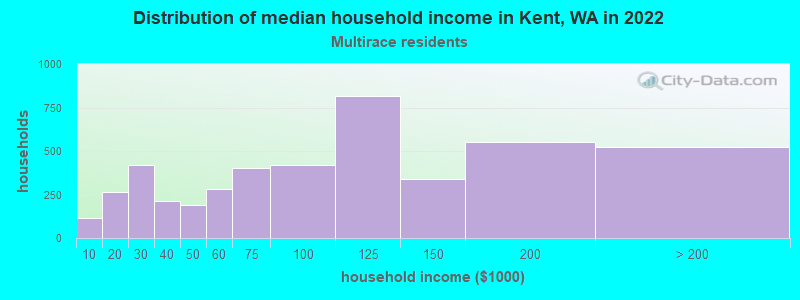
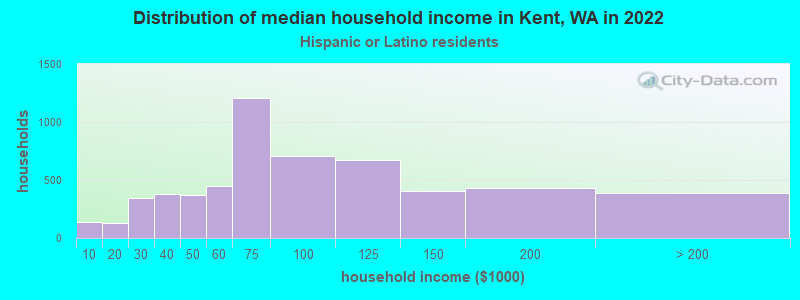
Income and house value in Kent Median household income in 2022 $88,345 White non-Hispanic householders$76,296 Black householders$107,895 American Indian and Alaska Native householders$109,186 Asian householders$104,235 Native Hawaiian and other Pacific Islander householders$62,372 Some other race householders$90,067 Two or more races householders$65,989 Hispanic or Latino race householdersMedian 2022 house value $590,121 White Non-Hispanic householders$641,218 Black or African American householders$633,871 American Indian or Alaska Native householders $626,189 Asian householders$553,050 Native Hawaiian and other Pacific Islander householders$543,365 Some other race householders$567,077 Two or more races householders$578,766 Hispanic or Latino householders
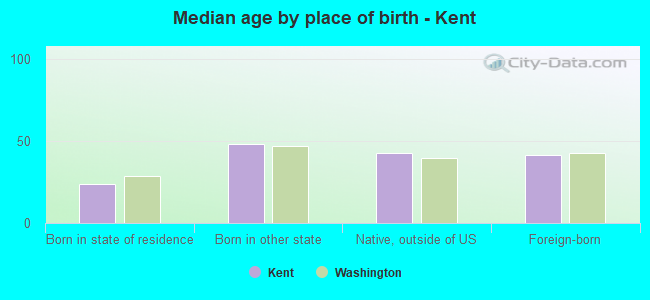
Median age by race in Kent
46.1 Median age for White residents44.4 47.1 32.4 Median age for Black or African American residents31.8 34.1 23.5 Median age for American Indian / Alaska Native residents24.4 20.7 37.0 Median age for Asian residents36.0 40.2 25.7 Median age for Native Hawaiian / Pacific Islander residents30.1 25.2 28.0 Median age for Other race residents28.8 27.4 26.6 Median age for Two or more races residents20.5 27.5 47.4 Median age for White alone residents45.9 49.0 28.4 Median age for Hispanic or Latino residents28.2 28.6
Owner/renter occupied households by race in Kent
House owners and renters - White residents 14,563 64.0% Owner occupied8,192 36.0% Renter occupiedHouse owners and renters - Black or African American residents 1,963 29.9% Owner occupied4,594 70.1% Renter occupiedHouse owners and renters - American Indian / Alaska Native residents 65 28.5% Owner occupied163 71.5% Renter occupiedHouse owners and renters - Asian residents 6,375 79.5% Owner occupied1,642 20.5% Renter occupiedHouse owners and renters - Native Hawaiian / Pacific Islander residents 200 14.9% Owner occupied1,146 85.1% Renter occupiedHouse owners and renters - Other race residents 754 20.5% Owner occupied2,931 79.5% Renter occupiedHouse owners and renters - Two or more races residents 2,199 56.3% Owner occupied1,705 43.7% Renter occupiedHouse owners and renters - White alone residents 14,320 65.0% Owner occupied7,721 35.0% Renter occupiedHouse owners and renters - Hispanic or Latino residents 2,199 35.1% Owner occupied4,060 64.9% Renter occupied
Language usage in Kent
English speakers - Total 56.8% of residents of Kent speak English at home.
12.1% of residents speak Spanish at home 8,859 57.9% Speak English very well6,440 42.1% Speak English less than very well31.1% of residents speak other language at home 19,214 48.7% Speak English very well20,262 51.3% Speak English less than very well
English speakers - Born in the United States 84.0% of residents of Kent speak English at home.
12.4% of residents speak Spanish at home 3,561 89.8% Speak English very well406 10.2% Speak English less than very well3.6% of residents speak other language at home 931 81.3% Speak English very well214 18.7% Speak English less than very well
English speakers - Native, born elsewhere 55.9% of residents of Kent speak English at home.
25.3% of residents speak Spanish at home 539 65.7% Speak English very well282 34.3% Speak English less than very well18.7% of residents speak other language at home 323 53.1% Speak English very well285 46.9% Speak English less than very well
English speakers - Foreign-born 11.1% of residents of Kent speak English at home.
14.7% of residents speak Spanish at home 1,779 28.4% Speak English very well4,486 71.6% Speak English less than very well74.2% of residents speak other language at home 13,642 43.2% Speak English very well17,920 56.8% Speak English less than very well
White (Caucasian) - Speak only English Native:
89.1% (36,162)Foreign-born:
11.4% (1,181)
White (Caucasian) - Speak another language Native:
10.9% (4,406)Foreign-born:
88.6% (9,204)
Black or African American - Speak only English Native:
88.5% (12,966)Foreign-born:
38.1% (1,758)
Black or African American - Speak another language Native:
11.5% (1,688)Foreign-born:
61.9% (2,861)
American Indian / Alaska Native - Speak only English Native:
82.4% (675)Foreign-born:
11.8% (12)
American Indian / Alaska Native - Speak another language Native:
16.8% (138)Foreign-born:
86.5% (91)
Asian - Speak only English Native:
62.3% (4,917)Foreign-born:
6.2% (1,079)
Asian - Speak another language Native:
37.7% (2,972)Foreign-born:
93.8% (16,361)
Native Hawaiian / Pacific Islander - Speak only English Native:
66.2% (1,242)Foreign-born:
17.6% (336)
Native Hawaiian / Pacific Islander - Speak another language Native:
31.1% (584)Foreign-born:
81.2% (1,547)
Other race - Speak only English Native:
28.7% (2,157)Foreign-born:
7.8% (369)
Other race - Speak another language Native:
71.3% (5,369)Foreign-born:
92.2% (4,343)
Two or more races - Speak only English Native:
80.7% (8,258)Foreign-born:
10.7% (245)
Two or more races - Speak another language Native:
19.3% (1,970)Foreign-born:
89.3% (2,047)
White alone - Speak only English Native:
91.4% (35,399)Foreign-born:
11.4% (1,181)
White alone - Speak another language Native:
8.6% (3,324)Foreign-born:
88.6% (9,158)
Hispanic or Latino - Speak only English Native:
40.2% (5,406)Foreign-born:
6.7% (440)
Hispanic or Latino - Speak another language Native:
59.8% (8,033)Foreign-born:
93.3% (6,147)
Foreign-born residents in Kent 45,590 residents are foreign born (17.6% Asia , 6.6% Latin America ).
This city:
33.5%Washington:
14.9%
Marital status for residents in Kent Marital status - White (Caucasian) population 15 years and over
Males 37.3% Never married51.2% Now married0.4% Separated2.0% Widowed9.0% DivorcedFemales 27.9% Never married47.0% Now married2.7% Separated9.5% Widowed12.9% DivorcedWomen who gave birth in the past 12 months Now married:
61.3% (502)Unmarried:
38.7% (317)
Women who did not give birth in the past 12 months Now married:
38.4% (4,026)Unmarried:
61.6% (6,454)
Marital status - Black or African American population 15 years and over
Males 62.2% Never married29.2% Now married1.9% Separated1.5% Widowed5.1% DivorcedFemales 48.4% Never married24.2% Now married7.7% Separated5.2% Widowed14.5% DivorcedWomen who gave birth in the past 12 months Now married:
82.9% (188)Unmarried:
17.1% (39)
Women who did not give birth in the past 12 months Now married:
28.9% (1,302)Unmarried:
71.1% (3,211)
Marital status - American Indian / Alaska Native population 15 years and over
Males 80.4% Never married14.6% Now married5.0% Separated0.0% Widowed0.0% DivorcedFemales 60.3% Never married14.5% Now married0.0% Separated7.4% Widowed17.8% DivorcedWomen who did not give birth in the past 12 months Now married:
13.7% (45)Unmarried:
86.3% (286)
Marital status - Asian population 15 years and over
Males 38.9% Never married55.8% Now married0.0% Separated1.0% Widowed4.3% DivorcedFemales 30.9% Never married56.8% Now married2.1% Separated5.6% Widowed4.5% DivorcedWomen who gave birth in the past 12 months Now married:
100.0% (398)Unmarried:
0.0% (0)
Women who did not give birth in the past 12 months Now married:
47.8% (3,388)Unmarried:
52.2% (3,695)
Marital status - Native Hawaiian / Pacific Islander population 15 years and over
Males 31.1% Never married60.6% Now married1.5% Separated1.0% Widowed5.7% DivorcedFemales 39.1% Never married45.9% Now married2.9% Separated1.0% Widowed11.0% DivorcedWomen who gave birth in the past 12 months Now married:
65.3% (69)Unmarried:
34.7% (37)
Women who did not give birth in the past 12 months Now married:
40.5% (421)Unmarried:
59.5% (619)
Marital status - Other race population 15 years and over
Males 46.6% Never married40.1% Now married5.8% Separated0.0% Widowed7.6% DivorcedFemales 57.5% Never married29.5% Now married4.0% Separated9.1% Widowed0.0% DivorcedWomen who gave birth in the past 12 months Now married:
100.0% (300)Unmarried:
0.0% (0)
Women who did not give birth in the past 12 months Now married:
23.1% (887)Unmarried:
76.9% (2,953)
Marital status - Two or more races population 15 years and over
Males 38.7% Never married48.7% Now married1.3% Separated0.6% Widowed10.7% DivorcedFemales 36.4% Never married32.6% Now married3.4% Separated6.4% Widowed21.2% DivorcedWomen who gave birth in the past 12 months Now married:
58.2% (140)Unmarried:
41.8% (101)
Women who did not give birth in the past 12 months Now married:
40.9% (1,532)Unmarried:
59.1% (2,210)
Marital status - White alone, not Hispanic / Latino population 15 years and over
Males 36.8% Never married51.4% Now married0.5% Separated2.1% Widowed9.2% DivorcedFemales 26.5% Never married47.8% Now married2.8% Separated9.7% Widowed13.2% DivorcedWomen who gave birth in the past 12 months Now married:
61.3% (502)Unmarried:
38.7% (317)
Women who did not give birth in the past 12 months Now married:
39.5% (3,813)Unmarried:
60.5% (5,834)
Marital status - Hispanic or Latino population 15 years and over
Males 42.7% Never married45.5% Now married5.4% Separated0.4% Widowed6.0% DivorcedFemales 44.7% Never married32.9% Now married3.3% Separated8.3% Widowed10.8% DivorcedWomen who gave birth in the past 12 months Now married:
100.0% (300)Unmarried:
0.0% (0)
Women who did not give birth in the past 12 months Now married:
30.9% (1,864)Unmarried:
69.1% (4,171)
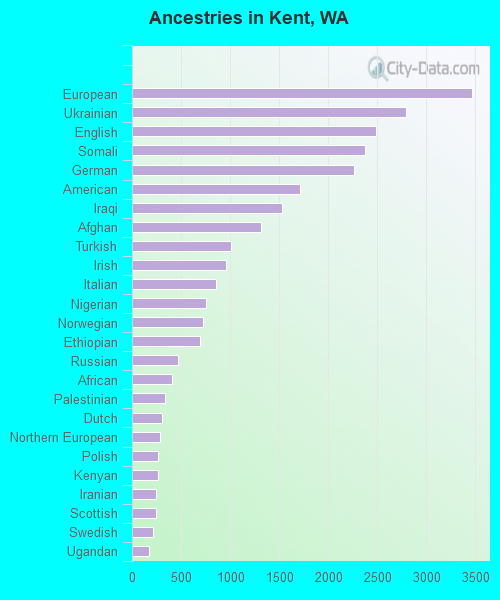
Ancestries in Kent
3,469 4.6% European2,799 3.7% Ukrainian2,486 3.3% English2,380 3.1% Somali2,269 3.0% German1,709 2.3% American1,530 2.0% Iraqi1,312 1.7% Afghan1,006 1.3% Turkish954 1.3% Irish862 1.1% Italian750 1.0% Nigerian727 1.0% Norwegian695 0.9% Ethiopian471 0.6% Russian412 0.5% African340 0.4% Palestinian304 0.4% Dutch286 0.4% Northern European267 0.4% Polish261 0.3% Kenyan246 0.3% Iranian240 0.3% Scottish218 0.3% Swedish176 0.2% Ugandan154 0.2% Ghanaian143 0.2% Haitian141 0.2% British118 0.2% Scotch-Irish112 0.1% Yugoslavian111 0.1% French102 0.1% Welsh99 0.1% Scandinavian88 0.1% French Canadian79 0.1% Bulgarian79 0.1% Lebanese74 0.10% Canadian68 0.09% Czech67 0.09% Danish66 0.09% Romanian59 0.08% Arab55 0.07% Egyptian51 0.07% Finnish50 0.07% Jamaican36 0.05% Portuguese36 0.05% Liberian35 0.05% Slovak31 0.04% Senegalese28 0.04% Icelander26 0.03% Pennsylvania German26 0.03% Swiss25 0.03% Armenian24 0.03% Hungarian21 0.03% Eastern European21 0.03% Brazilian20 0.03% Jordanian17 0.02% Austrian16 0.02% Sudanese10 0.01% Slavic9 0.01% Guyanese9 0.01% Australian9 0.01% West Indian7 0.01% Syrian6 0.01% Belgian5 0.01% Croatian
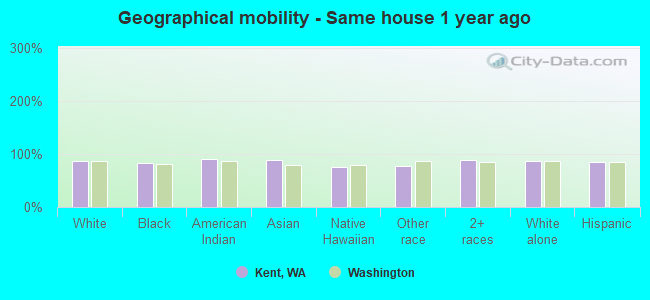
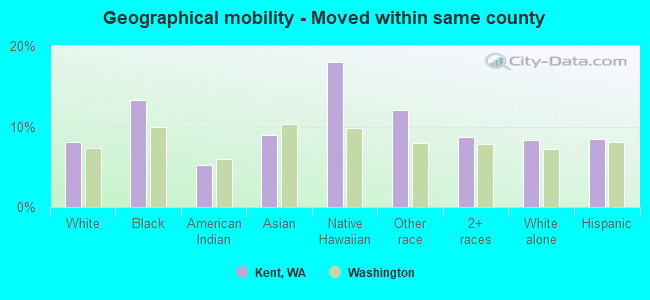
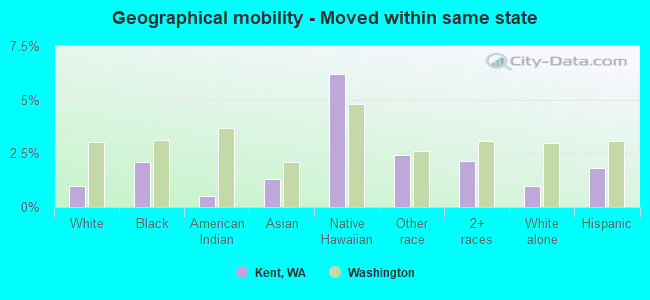
Geographical mobility in Kent Same house 1 year ago 45,132 86.9% White (Caucasian)14,464 82.2% Black or African American919 90.1% American Indian / Alaska Native23,163 88.1% Asian2,964 75.1% Native Hawaiian / Pacific Islander10,153 78.0% Other race14,390 88.3% Two or more races43,241 86.4% White alone, not Hispanic / Latino18,695 85.3% Hispanic or LatinoMoved within same county 4,188 8.1% White / Caucasian2,345 13.3% Black or African American54 5.3% American Indian / Alaska Native2,345 8.9% Asian712 18.0% Native Hawaiian / Pacific Islander1,570 12.1% Other race1,413 8.7% Two or more races4,188 8.4% White alone, not Hispanic / Latino1,856 8.5% Hispanic or LatinoMoved within same state 497 1.0% White / Caucasian369 2.1% Black or African American5 0.5% American Indian / Alaska Native349 1.3% Asian245 6.2% Native Hawaiian / Pacific Islander313 2.4% Other race350 2.1% Two or more races497 1.0% White alone, not Hispanic / Latino394 1.8% Hispanic or LatinoMoved from different state 1,175 2.3% White / Caucasian133 0.8% Black or African American2 0.2% American Indian / Alaska Native199 0.8% Asian954 7.3% Other race217 1.3% Two or more races1,175 2.3% White alone, not Hispanic / Latino954 4.4% Hispanic or LatinoMoved from abroad 947 1.8% White425 2.4% Black or African American19 1.8% American Indian / Alaska Native239 0.9% Asian46 1.2% Native Hawaiian / Pacific Islander21 0.2% Other race58 0.4% Two or more races947 1.9% White alone, not Hispanic / Latino21 0.1% Hispanic or Latino
Children Nativity (place of birth) in Kent
Children under 6 years - Living with two parents Both parents native 1,228 100.0% NativeBoth parents foreign-born 2,935 89.8% Native334 10.2% Foreign-bornOne native, one foreign-born parent 1,365 100.0% NativeChildren under 6 years - Living with one parent Native parent 1,234 94.1% Native78 5.9% Foreign-bornForeign-born parent 1,596 94.3% Native96 5.7% Foreign-bornChildren 6 to 17 years - Living with two parents Both parents native 3,502 100.0% NativeBoth parents foreign-born 3,247 53.5% Native2,825 46.5% Foreign-bornOne native, one foreign-born parent 947 100.0% NativeChildren 6 to 17 years - Living with one parent Native parent 5,188 100.0% NativeForeign-born parent 2,586 52.2% Native2,368 47.8% Foreign-born
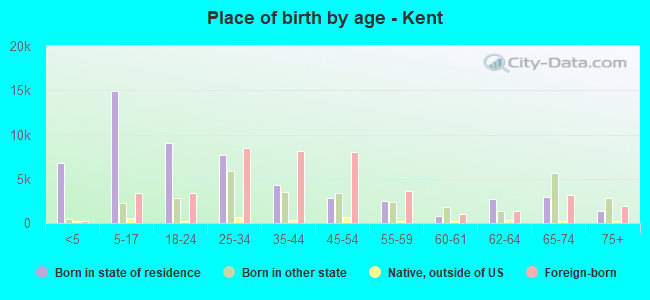
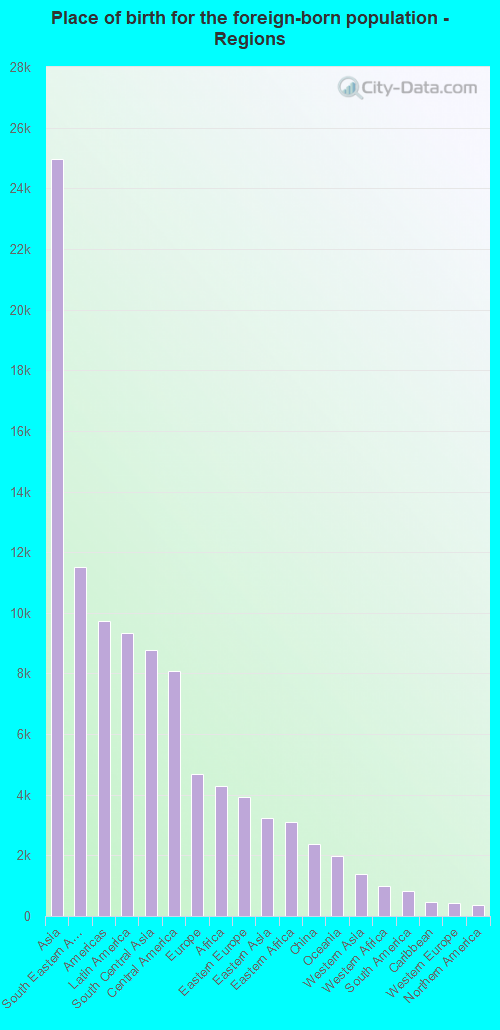
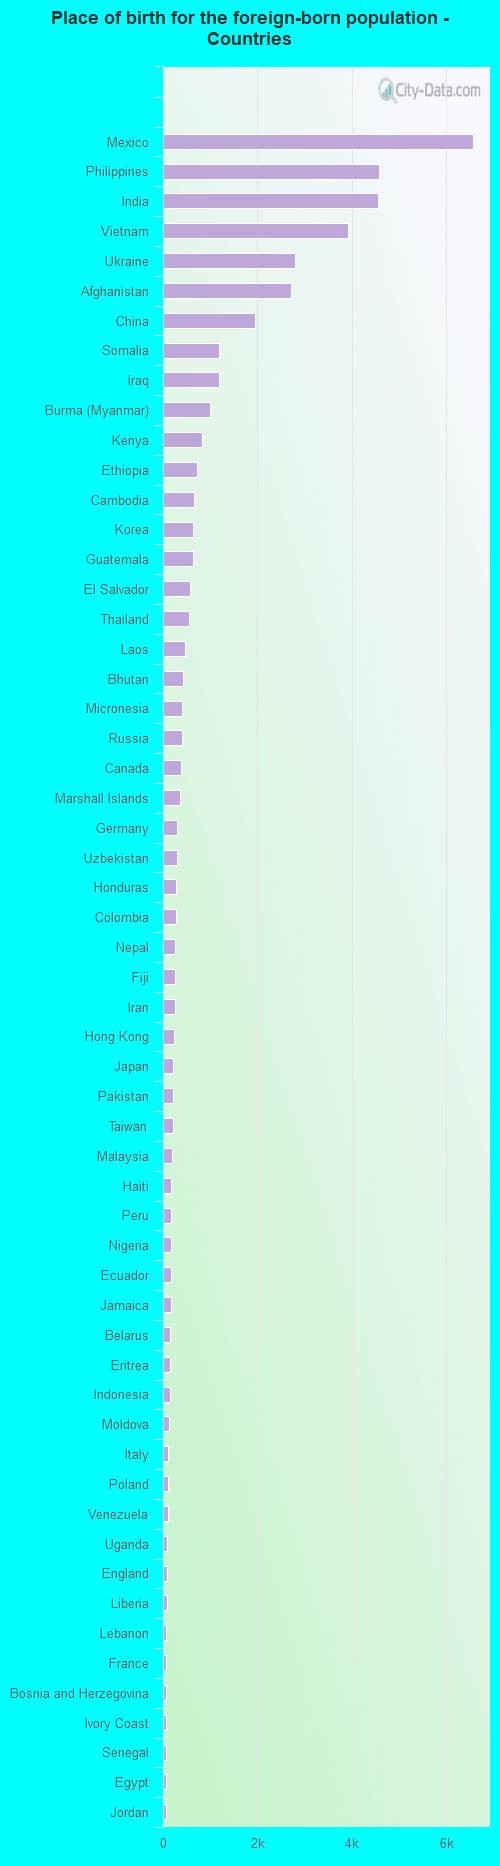
Place of birth for residents in Kent 24,950 Asia11,498 South Eastern Asia9,713 Americas9,335 Latin America8,760 South Central Asia8,064 Central America4,667 Europe4,274 Africa3,913 Eastern Europe3,246 Eastern Asia3,114 Eastern Africa2,380 China1,984 Oceania1,383 Western Asia991 Western Africa814 South America456 Caribbean420 Western Europe378 Northern America205 Northern Europe127 Southern Europe88 Northern Africa60 Middle Africa19 Southern Africa15 Australia and New Zealand Subregion6,578 Mexico4,582 Philippines4,554 India3,919 Vietnam2,802 Ukraine2,709 Afghanistan1,940 China1,193 Somalia1,181 Iraq992 Burma (Myanmar)831 Kenya719 Ethiopia663 Cambodia645 Korea637 Guatemala567 El Salvador554 Thailand459 Laos415 Bhutan408 Micronesia405 Russia378 Canada357 Marshall Islands299 Germany291 Uzbekistan270 Honduras267 Colombia254 Nepal253 Fiji250 Iran233 Hong Kong220 Japan211 Pakistan205 Taiwan181 Malaysia179 Haiti179 Peru176 Nigeria173 Ecuador161 Jamaica155 Belarus152 Eritrea144 Indonesia118 Moldova111 Italy109 Poland109 Venezuela87 Uganda77 England76 Liberia72 Lebanon71 France67 Bosnia and Herzegovina65 Ivory Coast63 Senegal62 Egypt62 Jordan55 Ireland51 Tanzania50 Kazakhstan49 Netherlands41 Czechoslovakia40 Romania39 Bulgaria37 Democratic Republic of Congo (Zaire)33 Dominican Republic32 United Kingdom32 Georgia31 Ghana28 Bahamas28 Brazil26 Hungary25 Kuwait25 Argentina24 Trinidad and Tobago23 Congo23 Uruguay22 Sierra Leone19 South Africa17 Norway16 Spain15 Australia15 Sudan10 Cuba10 Costa Rica9 Guyana9 Morocco8 Israel
Grandparents responsible for own grandchildren in Kent
Grandparents (30 to 59 years) White / Caucasian 115 11.3% Responsible for grandchildren900 88.7% Not responsible for grandchildrenBlack or African American 60 39.3% Responsible for grandchildren92 60.7% Not responsible for grandchildrenAmerican Indian / Alaska Native 11 100.0% Responsible for grandchildrenAsian 26 10.2% Responsible for grandchildren230 89.8% Not responsible for grandchildrenNative Hawaiian / Pacific Islander 181 77.2% Responsible for grandchildren53 22.8% Not responsible for grandchildrenOther race 35 14.1% Responsible for grandchildren213 85.9% Not responsible for grandchildrenTwo or more races 36 78.9% Responsible for grandchildren10 21.1% Not responsible for grandchildrenWhite alone, not Hispanic / Latino 33 7.7% Responsible for grandchildren401 92.3% Not responsible for grandchildrenHispanic or Latino 101 25.2% Responsible for grandchildren299 74.8% Not responsible for grandchildrenGrandparents (60 years and over) White / Caucasian 714 63.0% Responsible for grandchildren420 37.0% Not responsible for grandchildrenBlack or African American 48 31.9% Responsible for grandchildren102 68.1% Not responsible for grandchildrenAsian 83 8.1% Responsible for grandchildren946 91.9% Not responsible for grandchildrenNative Hawaiian / Pacific Islander 87 100.0% Not responsible for grandchildrenOther race 188 100.0% Not responsible for grandchildrenTwo or more races 3 3.0% Responsible for grandchildren89 97.0% Not responsible for grandchildrenWhite alone, not Hispanic / Latino 371 40.5% Responsible for grandchildren544 59.5% Not responsible for grandchildrenHispanic or Latino 303 100.0% Not responsible for grandchildren