Races in Kendall Park, New Jersey (NJ) Detailed Stats
Data:
Races - White alone (%)
Races - White alone (% change since 2000)
Races - Black alone (%)
Races - Black alone (% change since 2000)
Races - American Indian alone (%)
Races - American Indian alone (% change since 2000)
Races - Asian alone (%)
Races - Asian alone (% change since 2000)
Races - Hispanic (%)
Races - Hispanic (% change since 2000)
Races - Native Hawaiian and Other Pacific Islander alone (%)
Races - Native Hawaiian and Other Pacific Islander alone (% change since 2000)
Races - Two or more races(%)
Races - Two or more races(% change since 2000)
Races - Other race alone (%)
Races - Other race alone (% change since 2000)
Racial diversity
Place of birth - Born in state of residence (%)
Place of birth - Born in state of residence (%) - White
Place of birth - Born in state of residence (%) - Black or African American
Place of birth - Born in state of residence (%) - Asian
Place of birth - Born in state of residence (%) - Hispanic or Latino
Place of birth - Born in state of residence (%) - American Indian and Alaska Native
Place of birth - Born in state of residence (%) - Multirace
Place of birth - Born in state of residence (%) - Other Race
Place of birth - Born in other state (%)
Place of birth - Born in other state (%) - White
Place of birth - Born in other state (%) - Black or African American
Place of birth - Born in other state (%) - Asian
Place of birth - Born in other state (%) - Hispanic or Latino
Place of birth - Born in other state (%) - American Indian and Alaska Native
Place of birth - Born in other state (%) - Multirace
Place of birth - Born in other state (%) - Other Race
Place of birth - Native, outside of US (%)
Place of birth - Native, outside of US (%) - White
Place of birth - Native, outside of US (%) - Black or African American
Place of birth - Native, outside of US (%) - Asian
Place of birth - Native, outside of US (%) - Hispanic or Latino
Place of birth - Native, outside of US (%) - American Indian and Alaska Native
Place of birth - Native, outside of US (%) - Multirace
Place of birth - Native, outside of US (%) - Other Race
Place of birth - Foreign born (%)
Place of birth - Foreign born (%) - White
Place of birth - Foreign born (%) - Black or African American
Place of birth - Foreign born (%) - Asian
Place of birth - Foreign born (%) - Hispanic or Latino
Place of birth - Foreign born (%) - American Indian and Alaska Native
Place of birth - Foreign born (%) - Multirace
Place of birth - Foreign born (%) - Other Race
Residents speaking English at home (%)
Residents speaking English at home - Born in the United States (%)
Residents speaking English at home - Native, born elsewhere (%)
Residents speaking English at home - Foreign born (%)
Residents speaking Spanish at home (%)
Residents speaking Spanish at home - Born in the United States (%)
Residents speaking Spanish at home - Native, born elsewhere (%)
Residents speaking Spanish at home - Foreign born (%)
Residents speaking other language at home (%)
Residents speaking other language at home - Born in the United States (%)
Residents speaking other language at home - Native, born elsewhere (%)
Residents speaking other language at home - Foreign born (%)
Marital status - Never married (%)
Marital status - Now married (%)
Marital status - Separated (%)
Marital status - Widowed (%)
Marital status - Divorced (%)
Ancestries Reported - Arab (%)
Ancestries Reported - Czech (%)
Ancestries Reported - Danish (%)
Ancestries Reported - Dutch (%)
Ancestries Reported - English (%)
Ancestries Reported - French (%)
Ancestries Reported - French Canadian (%)
Ancestries Reported - German (%)
Ancestries Reported - Greek (%)
Ancestries Reported - Hungarian (%)
Ancestries Reported - Irish (%)
Ancestries Reported - Italian (%)
Ancestries Reported - Lithuanian (%)
Ancestries Reported - Norwegian (%)
Ancestries Reported - Polish (%)
Ancestries Reported - Portuguese (%)
Ancestries Reported - Russian (%)
Ancestries Reported - Scotch-Irish (%)
Ancestries Reported - Scottish (%)
Ancestries Reported - Slovak (%)
Ancestries Reported - Subsaharan African (%)
Ancestries Reported - Swedish (%)
Ancestries Reported - Swiss (%)
Ancestries Reported - Ukrainian (%)
Ancestries Reported - United States (%)
Ancestries Reported - Welsh (%)
Ancestries Reported - West Indian (%)
Ancestries Reported - Other (%)
Geographical mobility - Same house 1 year ago (%)
Geographical mobility - Same house 1 year ago (%) - White
Geographical mobility - Same house 1 year ago (%) - Black or African American
Geographical mobility - Same house 1 year ago (%) - Asian
Geographical mobility - Same house 1 year ago (%) - Hispanic or Latino
Geographical mobility - Same house 1 year ago (%) - American Indian and Alaska Native
Geographical mobility - Same house 1 year ago (%) - Multirace
Geographical mobility - Same house 1 year ago (%) - Other Race
Geographical mobility - Moved within same county (%)
Geographical mobility - Moved within same county (%) - White
Geographical mobility - Moved within same county (%) - Black or African American
Geographical mobility - Moved within same county (%) - Asian
Geographical mobility - Moved within same county (%) - Hispanic or Latino
Geographical mobility - Moved within same county (%) - American Indian and Alaska Native
Geographical mobility - Moved within same county (%) - Multirace
Geographical mobility - Moved within same county (%) - Other Race
Geographical mobility - Moved from different county within same state (%)
Geographical mobility - Moved from different county within same state (%) - White
Geographical mobility - Moved from different county within same state (%) - Black or African American
Geographical mobility - Moved from different county within same state (%) - Asian
Geographical mobility - Moved from different county within same state (%) - Hispanic or Latino
Geographical mobility - Moved from different county within same state (%) - American Indian and Alaska Native
Geographical mobility - Moved from different county within same state (%) - Multirace
Geographical mobility - Moved from different county within same state (%) - Other Race
Geographical mobility - Moved from different state (%)
Geographical mobility - Moved from different state (%) - White
Geographical mobility - Moved from different state (%) - Black or African American
Geographical mobility - Moved from different state (%) - Asian
Geographical mobility - Moved from different state (%) - Hispanic or Latino
Geographical mobility - Moved from different state (%) - American Indian and Alaska Native
Geographical mobility - Moved from different state (%) - Multirace
Geographical mobility - Moved from different state (%) - Other Race
Geographical mobility - Moved from abroad (%)
Geographical mobility - Moved from abroad (%) - White
Geographical mobility - Moved from abroad (%) - Black or African American
Geographical mobility - Moved from abroad (%) - Asian
Geographical mobility - Moved from abroad (%) - Hispanic or Latino
Geographical mobility - Moved from abroad (%) - American Indian and Alaska Native
Geographical mobility - Moved from abroad (%) - Multirace
Geographical mobility - Moved from abroad (%) - Other Race
Place of birth for the foreign-born population - Ireland (%)
Place of birth for the foreign-born population - Denmark (%)
Place of birth for the foreign-born population - Norway (%)
Place of birth for the foreign-born population - Sweden (%)
Place of birth for the foreign-born population - United Kingdom (%)
Place of birth for the foreign-born population - England (%)
Place of birth for the foreign-born population - Scotland (%)
Place of birth for the foreign-born population - Other Northern Europe (%)
Place of birth for the foreign-born population - Austria (%)
Place of birth for the foreign-born population - Belgium (%)
Place of birth for the foreign-born population - France (%)
Place of birth for the foreign-born population - Germany (%)
Place of birth for the foreign-born population - Netherlands (%)
Place of birth for the foreign-born population - Switzerland (%)
Place of birth for the foreign-born population - Other Western Europe (%)
Place of birth for the foreign-born population - Greece (%)
Place of birth for the foreign-born population - Italy (%)
Place of birth for the foreign-born population - Portugal (%)
Place of birth for the foreign-born population - Spain (%)
Place of birth for the foreign-born population - Other Southern Europe (%)
Place of birth for the foreign-born population - Albania (%)
Place of birth for the foreign-born population - Belarus (%)
Place of birth for the foreign-born population - Bosnia and Herzegovina (%)
Place of birth for the foreign-born population - Bulgaria (%)
Place of birth for the foreign-born population - Croatia (%)
Place of birth for the foreign-born population - Czechoslovakia (%)
Place of birth for the foreign-born population - Hungary (%)
Place of birth for the foreign-born population - Latvia (%)
Place of birth for the foreign-born population - Lithuania (%)
Place of birth for the foreign-born population - North Macedonia (Macedonia) (%)
Place of birth for the foreign-born population - Moldova (%)
Place of birth for the foreign-born population - Poland (%)
Place of birth for the foreign-born population - Romania (%)
Place of birth for the foreign-born population - Russia (%)
Place of birth for the foreign-born population - Serbia (%)
Place of birth for the foreign-born population - Ukraine (%)
Place of birth for the foreign-born population - Other Eastern Europe (%)
Place of birth for the foreign-born population - China (%)
Place of birth for the foreign-born population - Hong Kong (%)
Place of birth for the foreign-born population - Taiwan (%)
Place of birth for the foreign-born population - Japan (%)
Place of birth for the foreign-born population - Korea (%)
Place of birth for the foreign-born population - Other Eastern Asia (%)
Place of birth for the foreign-born population - Afghanistan (%)
Place of birth for the foreign-born population - Bangladesh (%)
Place of birth for the foreign-born population - India (%)
Place of birth for the foreign-born population - Iran (%)
Place of birth for the foreign-born population - Kazakhstan (%)
Place of birth for the foreign-born population - Nepal (%)
Place of birth for the foreign-born population - Pakistan (%)
Place of birth for the foreign-born population - Sri Lanka (%)
Place of birth for the foreign-born population - Uzbekistan (%)
Place of birth for the foreign-born population - Other South Central Asia (%)
Place of birth for the foreign-born population - Burma (%)
Place of birth for the foreign-born population - Cambodia (%)
Place of birth for the foreign-born population - Indonesia (%)
Place of birth for the foreign-born population - Laos (%)
Place of birth for the foreign-born population - Malaysia (%)
Place of birth for the foreign-born population - Philippines (%)
Place of birth for the foreign-born population - Singapore (%)
Place of birth for the foreign-born population - Thailand (%)
Place of birth for the foreign-born population - Vietnam (%)
Place of birth for the foreign-born population - Other South Eastern Asia (%)
Place of birth for the foreign-born population - Armenia (%)
Place of birth for the foreign-born population - Iraq (%)
Place of birth for the foreign-born population - Israel (%)
Place of birth for the foreign-born population - Jordan (%)
Place of birth for the foreign-born population - Kuwait (%)
Place of birth for the foreign-born population - Lebanon (%)
Place of birth for the foreign-born population - Saudi Arabia (%)
Place of birth for the foreign-born population - Syria (%)
Place of birth for the foreign-born population - Turkey (%)
Place of birth for the foreign-born population - Yemen (%)
Place of birth for the foreign-born population - Other Western Asia (%)
Place of birth for the foreign-born population - Eritrea (%)
Place of birth for the foreign-born population - Ethiopia (%)
Place of birth for the foreign-born population - Kenya (%)
Place of birth for the foreign-born population - Somalia (%)
Place of birth for the foreign-born population - Uganda (%)
Place of birth for the foreign-born population - Zimbabwe (%)
Place of birth for the foreign-born population - Other Eastern Africa (%)
Place of birth for the foreign-born population - Cameroon (%)
Place of birth for the foreign-born population - Congo (%)
Place of birth for the foreign-born population - Democratic Republic of Congo (Zaire) (%)
Place of birth for the foreign-born population - Other Middle Africa (%)
Place of birth for the foreign-born population - Egypt (%)
Place of birth for the foreign-born population - Morocco (%)
Place of birth for the foreign-born population - Sudan (%)
Place of birth for the foreign-born population - Other Northern Africa (%)
Place of birth for the foreign-born population - South Africa (%)
Place of birth for the foreign-born population - Other Southern Africa (%)
Place of birth for the foreign-born population - Cabo Verde (%)
Place of birth for the foreign-born population - Ghana (%)
Place of birth for the foreign-born population - Liberia (%)
Place of birth for the foreign-born population - Nigeria (%)
Place of birth for the foreign-born population - Senegal (%)
Place of birth for the foreign-born population - Sierra Leone (%)
Place of birth for the foreign-born population - Other Western Africa (%)
Place of birth for the foreign-born population - Australia (%)
Place of birth for the foreign-born population - New Zealand (%)
Place of birth for the foreign-born population - Fiji (%)
Place of birth for the foreign-born population - Micronesia (%)
Place of birth for the foreign-born population - Bahamas (%)
Place of birth for the foreign-born population - Barbados (%)
Place of birth for the foreign-born population - Cuba (%)
Place of birth for the foreign-born population - Dominica (%)
Place of birth for the foreign-born population - Dominican Republic (%)
Place of birth for the foreign-born population - Grenada (%)
Place of birth for the foreign-born population - Haiti (%)
Place of birth for the foreign-born population - Jamaica (%)
Place of birth for the foreign-born population - St. Vincent and the Grenadines (%)
Place of birth for the foreign-born population - Trinidad and Tobago (%)
Place of birth for the foreign-born population - West Indies (%)
Place of birth for the foreign-born population - Other Caribbean (%)
Place of birth for the foreign-born population - Belize (%)
Place of birth for the foreign-born population - Costa Rica (%)
Place of birth for the foreign-born population - El Salvador (%)
Place of birth for the foreign-born population - Guatemala (%)
Place of birth for the foreign-born population - Honduras (%)
Place of birth for the foreign-born population - Mexico (%)
Place of birth for the foreign-born population - Nicaragua (%)
Place of birth for the foreign-born population - Panama (%)
Place of birth for the foreign-born population - Other Central America (%)
Place of birth for the foreign-born population - Argentina (%)
Place of birth for the foreign-born population - Bolivia (%)
Place of birth for the foreign-born population - Brazil (%)
Place of birth for the foreign-born population - Chile (%)
Place of birth for the foreign-born population - Colombia (%)
Place of birth for the foreign-born population - Ecuador (%)
Place of birth for the foreign-born population - Guyana (%)
Place of birth for the foreign-born population - Peru (%)
Place of birth for the foreign-born population - Uruguay (%)
Place of birth for the foreign-born population - Venezuela (%)
Place of birth for the foreign-born population - Other South America (%)
Place of birth for the foreign-born population - Canada (%)
Place of birth for the foreign-born population - Other Northern America (%)
Place of birth for the foreign-born population - Other (%)
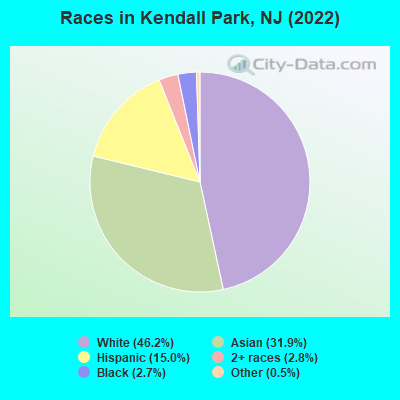
According to 2022 data, the most numerous races in Kendall Park, NJ are White alone (4,919 residents), Hispanic (1,599 residents), and Black alone (287 residents). 58.6% of Kendall Park residents speak English at home. 29.4% of Kendall Park, NJ residents are foreign-born (19.5% born in Asia, 6.3% born in Latin America), which is 21.7% greater than the foreign-born rate of 23.0% across the entire state of New Jersey.
Race distribution in Kendall Park
2000 2022
5,557,209 66.0% White alone 1,117,191 13.3% Hispanic 1,096,171 13.0% Black alone 477,012 5.7% Asian alone 133,689 1.6% Two or more races 19,565 0.2% Other race alone 11,338 0.1% American Indian alone 2,175 0.03% Native Hawaiian and Other
4,766,476 51.5% White alone 2,028,470 21.9% Hispanic 1,111,632 12.0% Black alone 923,546 10.0% Asian alone 332,237 3.6% Two or more races 89,847 1.0% Other race alone 8,557 0.09% American Indian alone 934 0.01% Native Hawaiian and Other
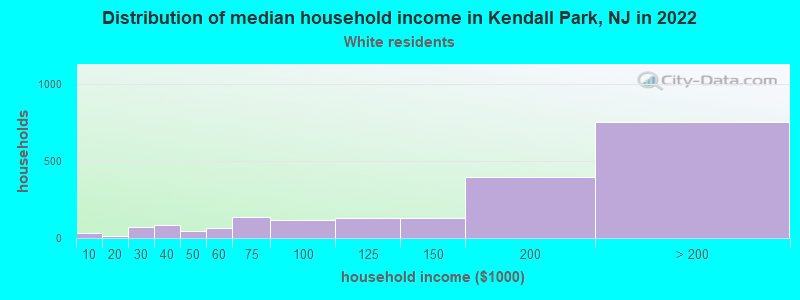
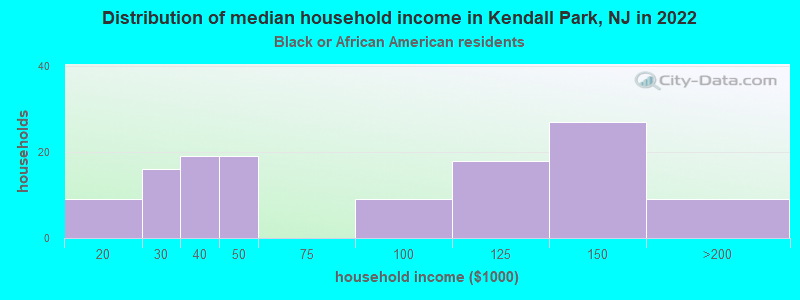
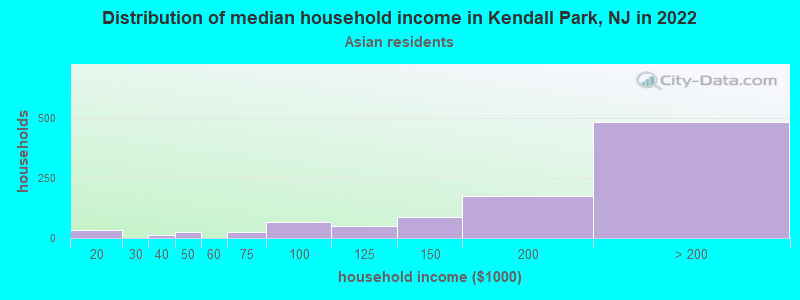
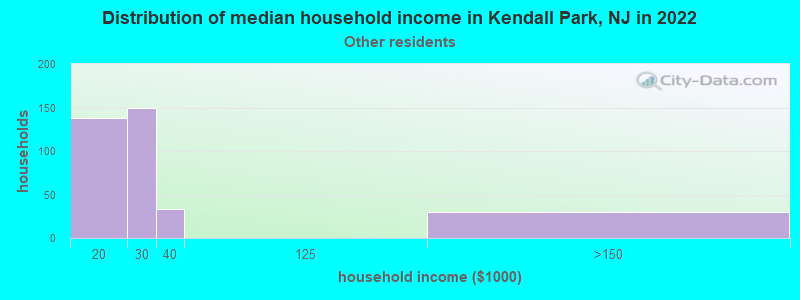
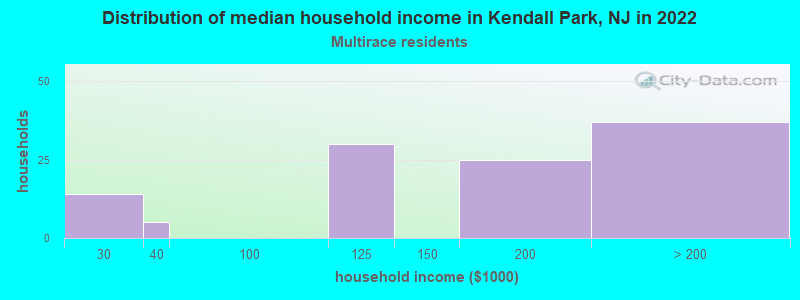
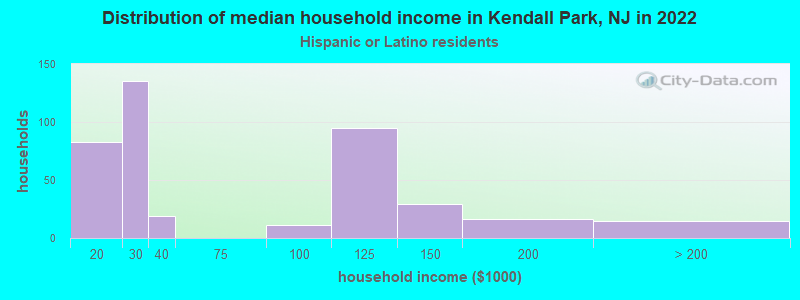
Income and house value in Kendall Park Median household income in 2022 $167,405 White non-Hispanic householders$81,627 Black householders$185,729 Asian householders$21,077 Some other race householders$104,164 Two or more races householdersMedian 2022 house value $565,276 White Non-Hispanic householders$609,304 Black or African American householders$346,370 American Indian or Alaska Native householders $751,239 Asian householders$500,312 Some other race householders$518,786 Two or more races householders$515,707 Hispanic or Latino householders
Median age by race in Kendall Park
51.6 Median age for White residents50.9 52.1 34.8 Median age for Black or African American residents32.3 34.0 -673,036,092.7 Median age for American Indian / Alaska Native residents-624,624,624.0 -739,999,999.3 43.3 Median age for Asian residents44.0 42.3 -939,393,938.5 Median age for Native Hawaiian / Pacific Islander residents-860,335,194.7 -713,070,378.3 35.9 Median age for Other race residents34.6 40.7 23.4 Median age for Two or more races residents23.9 33.4 50.9 Median age for White alone residents51.8 50.2 30.7 Median age for Hispanic or Latino residents27.0 32.7
Owner/renter occupied households by race in Kendall Park
House owners and renters - White residents 1,744 86.9% Owner occupied264 13.1% Renter occupiedHouse owners and renters - Black or African American residents 63 54.7% Owner occupied52 45.3% Renter occupiedHouse owners and renters - American Indian / Alaska Native residents 26 100.0% Renter occupiedHouse owners and renters - Asian residents 959 93.8% Owner occupied64 6.2% Renter occupiedHouse owners and renters - Other race residents 307 77.9% Owner occupied87 22.1% Renter occupiedHouse owners and renters - Two or more races residents 141 92.0% Owner occupied12 8.0% Renter occupiedHouse owners and renters - White alone residents 1,804 87.6% Owner occupied256 12.4% Renter occupiedHouse owners and renters - Hispanic or Latino residents 356 71.0% Owner occupied145 29.0% Renter occupied
Language usage in Kendall Park
English speakers - Total 58.6% of residents of Kendall Park speak English at home.
11.6% of residents speak Spanish at home 377 32.0% Speak English very well800 68.0% Speak English less than very well30.2% of residents speak other language at home 2,668 87.2% Speak English very well391 12.8% Speak English less than very well
English speakers - Born in the United States 92.5% of residents of Kendall Park speak English at home.
3.2% of residents speak Spanish at home 50 100.0% Speak English very well5.2% of residents speak other language at home 80 100.0% Speak English very well
English speakers - Native, born elsewhere 23.5% of residents of Kendall Park speak English at home.
72.5% of residents speak Spanish at home 13 9.0% Speak English very well132 91.0% Speak English less than very well6.5% of residents speak other language at home 13 100.0% Speak English very well
English speakers - Foreign-born 9.3% of residents of Kendall Park speak English at home.
20.4% of residents speak Spanish at home 89 13.5% Speak English very well569 86.5% Speak English less than very well68.5% of residents speak other language at home 1,870 84.8% Speak English very well336 15.2% Speak English less than very well
White (Caucasian) - Speak only English Native:
99.6% (4,304)Foreign-born:
17.3% (80)
White (Caucasian) - Speak another language Native:
3.8% (163)Foreign-born:
81.5% (376)
Black or African American - Speak only English Native:
100.0% (230)Foreign-born:
53.1% (52)
Asian - Speak only English Native:
39.2% (497)Foreign-born:
6.3% (130)
Asian - Speak another language Native:
61.0% (774)Foreign-born:
93.5% (1,918)
Other race - Speak only English Native:
21.8% (78)Foreign-born:
1.7% (7)
Other race - Speak another language Native:
75.8% (270)Foreign-born:
96.3% (387)
Two or more races - Speak only English Native:
68.9% (410)Foreign-born:
24.6% (17)
Two or more races - Speak another language Native:
30.7% (183)Foreign-born:
75.0% (53)
White alone - Speak only English Native:
98.7% (4,380)Foreign-born:
20.6% (87)
White alone - Speak another language Native:
2.5% (109)Foreign-born:
79.2% (333)
Hispanic or Latino - Speak only English Native:
28.9% (197)Foreign-born:
5.0% (31)
Hispanic or Latino - Speak another language Native:
69.9% (478)Foreign-born:
94.2% (589)
Foreign-born residents in Kendall Park 3,124 residents are foreign born (19.5% Asia , 6.3% Latin America ).
This city:
29.4%New Jersey:
23.2%
Marital status for residents in Kendall Park Marital status - White (Caucasian) population 15 years and over
Males 27.8% Never married66.2% Now married2.2% Separated0.8% Widowed3.1% DivorcedFemales 31.0% Never married52.2% Now married0.0% Separated6.6% Widowed10.2% DivorcedWomen who gave birth in the past 12 months Now married:
100.0% (9)Unmarried:
0.0% (0)
Women who did not give birth in the past 12 months Now married:
38.4% (430)Unmarried:
61.6% (691)
Marital status - Black or African American population 15 years and over
Males 48.8% Never married39.0% Now married0.0% Separated0.0% Widowed12.2% DivorcedFemales 72.1% Never married10.1% Now married6.7% Separated7.2% Widowed3.8% DivorcedWomen who did not give birth in the past 12 months Now married:
0.0% (0)Unmarried:
100.0% (160)
Marital status - Asian population 15 years and over
Males 17.0% Never married80.0% Now married0.0% Separated2.1% Widowed0.9% DivorcedFemales 19.7% Never married71.1% Now married0.0% Separated6.3% Widowed3.0% DivorcedWomen who gave birth in the past 12 months Now married:
100.0% (38)Unmarried:
0.0% (0)
Women who did not give birth in the past 12 months Now married:
75.4% (589)Unmarried:
24.6% (192)
Marital status - Other race population 15 years and over
Males 16.9% Never married83.1% Now married0.0% Separated0.0% Widowed0.0% DivorcedFemales 0.0% Never married56.3% Now married0.0% Separated1.2% Widowed42.5% DivorcedWomen who did not give birth in the past 12 months Now married:
42.0% (41)Unmarried:
58.0% (56)
Marital status - Two or more races population 15 years and over
Males 84.9% Never married15.1% Now married0.0% Separated0.0% Widowed0.0% DivorcedFemales 46.3% Never married28.4% Now married18.9% Separated0.0% Widowed6.3% DivorcedWomen who did not give birth in the past 12 months Now married:
10.7% (16)Unmarried:
89.3% (132)
Marital status - White alone, not Hispanic / Latino population 15 years and over
Males 24.5% Never married71.2% Now married0.0% Separated0.8% Widowed3.4% DivorcedFemales 29.7% Never married53.4% Now married0.0% Separated7.0% Widowed9.9% DivorcedWomen who gave birth in the past 12 months Now married:
100.0% (11)Unmarried:
0.0% (0)
Women who did not give birth in the past 12 months Now married:
39.5% (487)Unmarried:
60.5% (744)
Marital status - Hispanic or Latino population 15 years and over
Males 46.6% Never married44.7% Now married8.7% Separated0.0% Widowed0.0% DivorcedFemales 22.4% Never married42.4% Now married7.2% Separated0.6% Widowed27.4% DivorcedWomen who did not give birth in the past 12 months Now married:
27.4% (65)Unmarried:
72.6% (172)
Ancestries in Kendall Park
738 11.8% Italian190 3.0% German175 2.8% Irish133 2.1% American111 1.8% Egyptian105 1.7% Polish103 1.6% Hungarian82 1.3% Turkish70 1.1% English50 0.8% Greek45 0.7% African39 0.6% Guyanese34 0.5% French Canadian31 0.5% French23 0.4% Portuguese23 0.4% Serbian19 0.3% Scottish17 0.3% Scotch-Irish13 0.2% Brazilian10 0.2% Romanian10 0.2% Jamaican9 0.1% European8 0.1% Bulgarian8 0.1% West Indian7 0.1% British
Children Nativity (place of birth) in Kendall Park
Children under 6 years - Living with two parents Both parents native 120 100.0% NativeBoth parents foreign-born 231 100.0% NativeChildren under 6 years - Living with one parent Native parent 22 100.0% NativeForeign-born parent 159 100.0% NativeChildren 6 to 17 years - Living with two parents Both parents native 465 98.6% Native7 1.4% Foreign-bornBoth parents foreign-born 926 93.4% Native66 6.6% Foreign-bornOne native, one foreign-born parent 149 100.0% NativeChildren 6 to 17 years - Living with one parent Native parent 29 100.0% NativeForeign-born parent 43 59.5% Native29 40.5% Foreign-born
Grandparents responsible for own grandchildren in Kendall Park
Grandparents (30 to 59 years) Two or more races 19 100.0% Not responsible for grandchildrenHispanic or Latino 16 100.0% Not responsible for grandchildren
Grandparents (60 years and over)