Races in Irving, Texas (TX) Detailed Stats
Data:
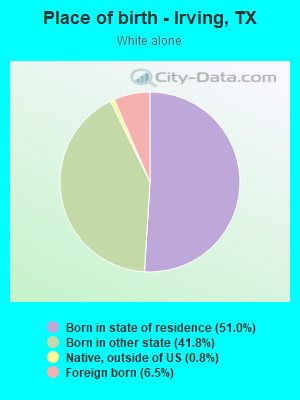
Races - White alone (%)
Races - White alone (% change since 2000)
Races - Black alone (%)
Races - Black alone (% change since 2000)
Races - American Indian alone (%)
Races - American Indian alone (% change since 2000)
Races - Asian alone (%)
Races - Asian alone (% change since 2000)
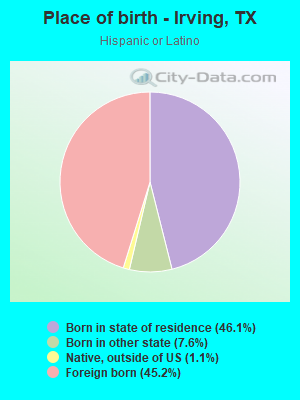
Races - Hispanic (%)
Races - Hispanic (% change since 2000)
Races - Native Hawaiian and Other Pacific Islander alone (%)
Races - Native Hawaiian and Other Pacific Islander alone (% change since 2000)
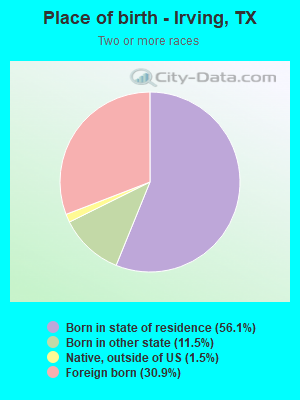
Races - Two or more races(%)
Races - Two or more races(% change since 2000)
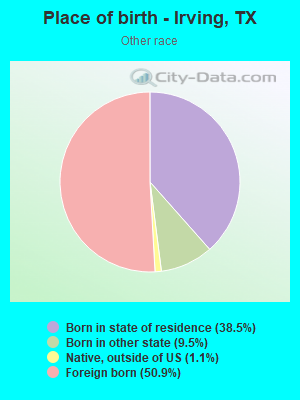
Races - Other race alone (%)
Races - Other race alone (% change since 2000)
Racial diversity
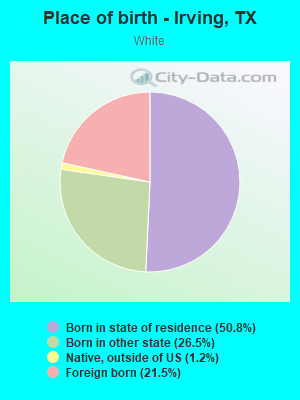
Place of birth - Born in state of residence (%)
Place of birth - Born in state of residence (%) - White
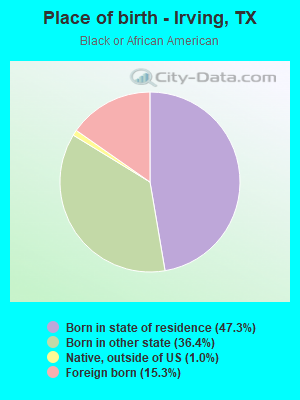
Place of birth - Born in state of residence (%) - Black or African American
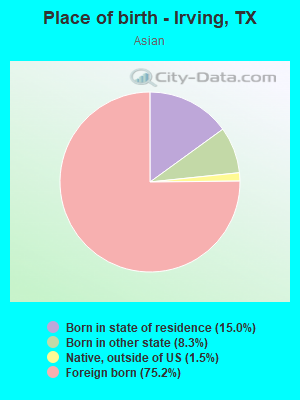
Place of birth - Born in state of residence (%) - Asian
Place of birth - Born in state of residence (%) - Hispanic or Latino
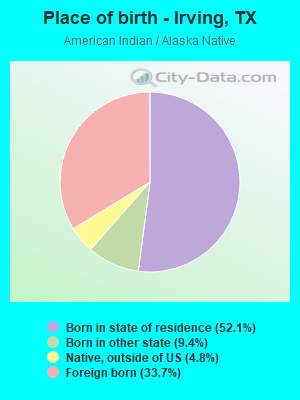
Place of birth - Born in state of residence (%) - American Indian and Alaska Native
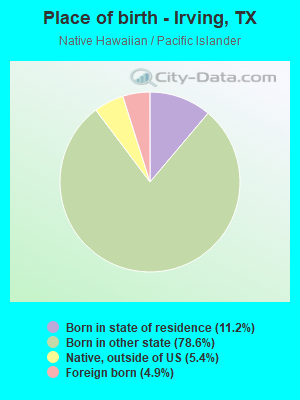
Place of birth - Born in state of residence (%) - Multirace
Place of birth - Born in state of residence (%) - Other Race
Place of birth - Born in other state (%)
Place of birth - Born in other state (%) - White
Place of birth - Born in other state (%) - Black or African American
Place of birth - Born in other state (%) - Asian
Place of birth - Born in other state (%) - Hispanic or Latino
Place of birth - Born in other state (%) - American Indian and Alaska Native
Place of birth - Born in other state (%) - Multirace
Place of birth - Born in other state (%) - Other Race
Place of birth - Native, outside of US (%)
Place of birth - Native, outside of US (%) - White
Place of birth - Native, outside of US (%) - Black or African American
Place of birth - Native, outside of US (%) - Asian
Place of birth - Native, outside of US (%) - Hispanic or Latino
Place of birth - Native, outside of US (%) - American Indian and Alaska Native
Place of birth - Native, outside of US (%) - Multirace
Place of birth - Native, outside of US (%) - Other Race
Place of birth - Foreign born (%)
Place of birth - Foreign born (%) - White
Place of birth - Foreign born (%) - Black or African American
Place of birth - Foreign born (%) - Asian
Place of birth - Foreign born (%) - Hispanic or Latino
Place of birth - Foreign born (%) - American Indian and Alaska Native
Place of birth - Foreign born (%) - Multirace
Place of birth - Foreign born (%) - Other Race
Residents speaking English at home (%)
Residents speaking English at home - Born in the United States (%)
Residents speaking English at home - Native, born elsewhere (%)
Residents speaking English at home - Foreign born (%)
Residents speaking Spanish at home (%)
Residents speaking Spanish at home - Born in the United States (%)
Residents speaking Spanish at home - Native, born elsewhere (%)
Residents speaking Spanish at home - Foreign born (%)
Residents speaking other language at home (%)
Residents speaking other language at home - Born in the United States (%)
Residents speaking other language at home - Native, born elsewhere (%)
Residents speaking other language at home - Foreign born (%)
Marital status - Never married (%)
Marital status - Now married (%)
Marital status - Separated (%)
Marital status - Widowed (%)
Marital status - Divorced (%)
Ancestries Reported - Arab (%)
Ancestries Reported - Czech (%)
Ancestries Reported - Danish (%)
Ancestries Reported - Dutch (%)
Ancestries Reported - English (%)
Ancestries Reported - French (%)
Ancestries Reported - French Canadian (%)
Ancestries Reported - German (%)
Ancestries Reported - Greek (%)
Ancestries Reported - Hungarian (%)
Ancestries Reported - Irish (%)
Ancestries Reported - Italian (%)
Ancestries Reported - Lithuanian (%)
Ancestries Reported - Norwegian (%)
Ancestries Reported - Polish (%)
Ancestries Reported - Portuguese (%)
Ancestries Reported - Russian (%)
Ancestries Reported - Scotch-Irish (%)
Ancestries Reported - Scottish (%)
Ancestries Reported - Slovak (%)
Ancestries Reported - Subsaharan African (%)
Ancestries Reported - Swedish (%)
Ancestries Reported - Swiss (%)
Ancestries Reported - Ukrainian (%)
Ancestries Reported - United States (%)
Ancestries Reported - Welsh (%)
Ancestries Reported - West Indian (%)
Ancestries Reported - Other (%)
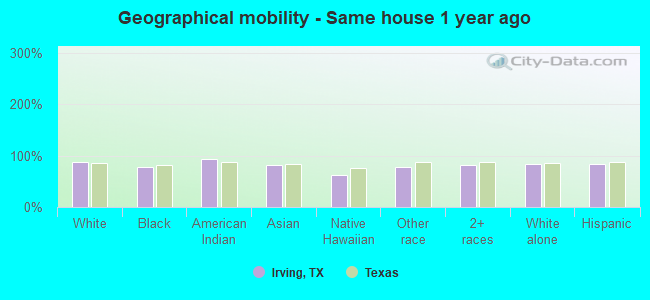
Geographical mobility - Same house 1 year ago (%)
Geographical mobility - Same house 1 year ago (%) - White
Geographical mobility - Same house 1 year ago (%) - Black or African American
Geographical mobility - Same house 1 year ago (%) - Asian
Geographical mobility - Same house 1 year ago (%) - Hispanic or Latino
Geographical mobility - Same house 1 year ago (%) - American Indian and Alaska Native
Geographical mobility - Same house 1 year ago (%) - Multirace
Geographical mobility - Same house 1 year ago (%) - Other Race
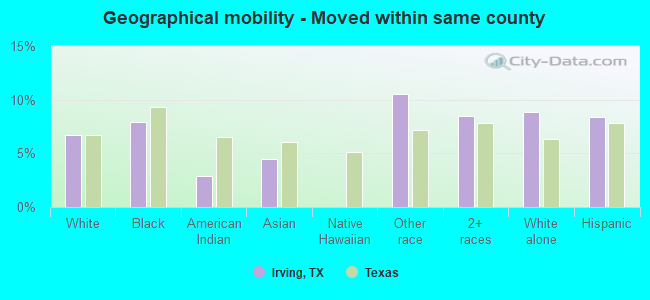
Geographical mobility - Moved within same county (%)
Geographical mobility - Moved within same county (%) - White
Geographical mobility - Moved within same county (%) - Black or African American
Geographical mobility - Moved within same county (%) - Asian
Geographical mobility - Moved within same county (%) - Hispanic or Latino
Geographical mobility - Moved within same county (%) - American Indian and Alaska Native
Geographical mobility - Moved within same county (%) - Multirace
Geographical mobility - Moved within same county (%) - Other Race
Geographical mobility - Moved from different county within same state (%)
Geographical mobility - Moved from different county within same state (%) - White
Geographical mobility - Moved from different county within same state (%) - Black or African American
Geographical mobility - Moved from different county within same state (%) - Asian
Geographical mobility - Moved from different county within same state (%) - Hispanic or Latino
Geographical mobility - Moved from different county within same state (%) - American Indian and Alaska Native
Geographical mobility - Moved from different county within same state (%) - Multirace
Geographical mobility - Moved from different county within same state (%) - Other Race
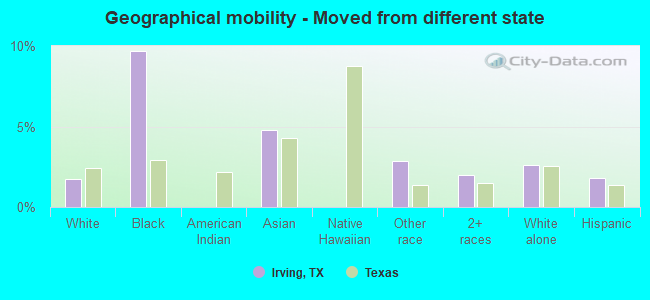
Geographical mobility - Moved from different state (%)
Geographical mobility - Moved from different state (%) - White
Geographical mobility - Moved from different state (%) - Black or African American
Geographical mobility - Moved from different state (%) - Asian
Geographical mobility - Moved from different state (%) - Hispanic or Latino
Geographical mobility - Moved from different state (%) - American Indian and Alaska Native
Geographical mobility - Moved from different state (%) - Multirace
Geographical mobility - Moved from different state (%) - Other Race
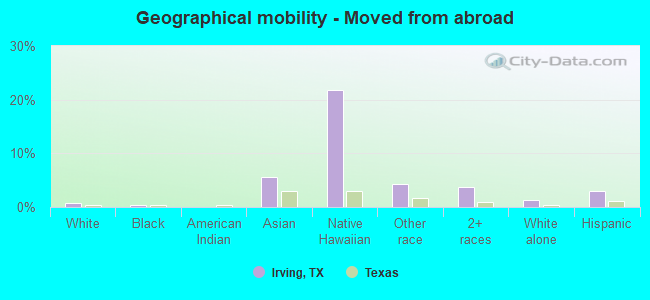
Geographical mobility - Moved from abroad (%)
Geographical mobility - Moved from abroad (%) - White
Geographical mobility - Moved from abroad (%) - Black or African American
Geographical mobility - Moved from abroad (%) - Asian
Geographical mobility - Moved from abroad (%) - Hispanic or Latino
Geographical mobility - Moved from abroad (%) - American Indian and Alaska Native
Geographical mobility - Moved from abroad (%) - Multirace
Geographical mobility - Moved from abroad (%) - Other Race
Place of birth for the foreign-born population - Ireland (%)
Place of birth for the foreign-born population - Denmark (%)
Place of birth for the foreign-born population - Norway (%)
Place of birth for the foreign-born population - Sweden (%)
Place of birth for the foreign-born population - United Kingdom (%)
Place of birth for the foreign-born population - England (%)
Place of birth for the foreign-born population - Scotland (%)
Place of birth for the foreign-born population - Other Northern Europe (%)
Place of birth for the foreign-born population - Austria (%)
Place of birth for the foreign-born population - Belgium (%)
Place of birth for the foreign-born population - France (%)
Place of birth for the foreign-born population - Germany (%)
Place of birth for the foreign-born population - Netherlands (%)
Place of birth for the foreign-born population - Switzerland (%)
Place of birth for the foreign-born population - Other Western Europe (%)
Place of birth for the foreign-born population - Greece (%)
Place of birth for the foreign-born population - Italy (%)
Place of birth for the foreign-born population - Portugal (%)
Place of birth for the foreign-born population - Spain (%)
Place of birth for the foreign-born population - Other Southern Europe (%)
Place of birth for the foreign-born population - Albania (%)
Place of birth for the foreign-born population - Belarus (%)
Place of birth for the foreign-born population - Bosnia and Herzegovina (%)
Place of birth for the foreign-born population - Bulgaria (%)
Place of birth for the foreign-born population - Croatia (%)
Place of birth for the foreign-born population - Czechoslovakia (%)
Place of birth for the foreign-born population - Hungary (%)
Place of birth for the foreign-born population - Latvia (%)
Place of birth for the foreign-born population - Lithuania (%)
Place of birth for the foreign-born population - North Macedonia (Macedonia) (%)
Place of birth for the foreign-born population - Moldova (%)
Place of birth for the foreign-born population - Poland (%)
Place of birth for the foreign-born population - Romania (%)
Place of birth for the foreign-born population - Russia (%)
Place of birth for the foreign-born population - Serbia (%)
Place of birth for the foreign-born population - Ukraine (%)
Place of birth for the foreign-born population - Other Eastern Europe (%)
Place of birth for the foreign-born population - China (%)
Place of birth for the foreign-born population - Hong Kong (%)
Place of birth for the foreign-born population - Taiwan (%)
Place of birth for the foreign-born population - Japan (%)
Place of birth for the foreign-born population - Korea (%)
Place of birth for the foreign-born population - Other Eastern Asia (%)
Place of birth for the foreign-born population - Afghanistan (%)
Place of birth for the foreign-born population - Bangladesh (%)
Place of birth for the foreign-born population - India (%)
Place of birth for the foreign-born population - Iran (%)
Place of birth for the foreign-born population - Kazakhstan (%)
Place of birth for the foreign-born population - Nepal (%)
Place of birth for the foreign-born population - Pakistan (%)
Place of birth for the foreign-born population - Sri Lanka (%)
Place of birth for the foreign-born population - Uzbekistan (%)
Place of birth for the foreign-born population - Other South Central Asia (%)
Place of birth for the foreign-born population - Burma (%)
Place of birth for the foreign-born population - Cambodia (%)
Place of birth for the foreign-born population - Indonesia (%)
Place of birth for the foreign-born population - Laos (%)
Place of birth for the foreign-born population - Malaysia (%)
Place of birth for the foreign-born population - Philippines (%)
Place of birth for the foreign-born population - Singapore (%)
Place of birth for the foreign-born population - Thailand (%)
Place of birth for the foreign-born population - Vietnam (%)
Place of birth for the foreign-born population - Other South Eastern Asia (%)
Place of birth for the foreign-born population - Armenia (%)
Place of birth for the foreign-born population - Iraq (%)
Place of birth for the foreign-born population - Israel (%)
Place of birth for the foreign-born population - Jordan (%)
Place of birth for the foreign-born population - Kuwait (%)
Place of birth for the foreign-born population - Lebanon (%)
Place of birth for the foreign-born population - Saudi Arabia (%)
Place of birth for the foreign-born population - Syria (%)
Place of birth for the foreign-born population - Turkey (%)
Place of birth for the foreign-born population - Yemen (%)
Place of birth for the foreign-born population - Other Western Asia (%)
Place of birth for the foreign-born population - Eritrea (%)
Place of birth for the foreign-born population - Ethiopia (%)
Place of birth for the foreign-born population - Kenya (%)
Place of birth for the foreign-born population - Somalia (%)
Place of birth for the foreign-born population - Uganda (%)
Place of birth for the foreign-born population - Zimbabwe (%)
Place of birth for the foreign-born population - Other Eastern Africa (%)
Place of birth for the foreign-born population - Cameroon (%)
Place of birth for the foreign-born population - Congo (%)
Place of birth for the foreign-born population - Democratic Republic of Congo (Zaire) (%)
Place of birth for the foreign-born population - Other Middle Africa (%)
Place of birth for the foreign-born population - Egypt (%)
Place of birth for the foreign-born population - Morocco (%)
Place of birth for the foreign-born population - Sudan (%)
Place of birth for the foreign-born population - Other Northern Africa (%)
Place of birth for the foreign-born population - South Africa (%)
Place of birth for the foreign-born population - Other Southern Africa (%)
Place of birth for the foreign-born population - Cabo Verde (%)
Place of birth for the foreign-born population - Ghana (%)
Place of birth for the foreign-born population - Liberia (%)
Place of birth for the foreign-born population - Nigeria (%)
Place of birth for the foreign-born population - Senegal (%)
Place of birth for the foreign-born population - Sierra Leone (%)
Place of birth for the foreign-born population - Other Western Africa (%)
Place of birth for the foreign-born population - Australia (%)
Place of birth for the foreign-born population - New Zealand (%)
Place of birth for the foreign-born population - Fiji (%)
Place of birth for the foreign-born population - Micronesia (%)
Place of birth for the foreign-born population - Bahamas (%)
Place of birth for the foreign-born population - Barbados (%)
Place of birth for the foreign-born population - Cuba (%)
Place of birth for the foreign-born population - Dominica (%)
Place of birth for the foreign-born population - Dominican Republic (%)
Place of birth for the foreign-born population - Grenada (%)
Place of birth for the foreign-born population - Haiti (%)
Place of birth for the foreign-born population - Jamaica (%)
Place of birth for the foreign-born population - St. Vincent and the Grenadines (%)
Place of birth for the foreign-born population - Trinidad and Tobago (%)
Place of birth for the foreign-born population - West Indies (%)
Place of birth for the foreign-born population - Other Caribbean (%)
Place of birth for the foreign-born population - Belize (%)
Place of birth for the foreign-born population - Costa Rica (%)
Place of birth for the foreign-born population - El Salvador (%)
Place of birth for the foreign-born population - Guatemala (%)
Place of birth for the foreign-born population - Honduras (%)
Place of birth for the foreign-born population - Mexico (%)
Place of birth for the foreign-born population - Nicaragua (%)
Place of birth for the foreign-born population - Panama (%)
Place of birth for the foreign-born population - Other Central America (%)
Place of birth for the foreign-born population - Argentina (%)
Place of birth for the foreign-born population - Bolivia (%)
Place of birth for the foreign-born population - Brazil (%)
Place of birth for the foreign-born population - Chile (%)
Place of birth for the foreign-born population - Colombia (%)
Place of birth for the foreign-born population - Ecuador (%)
Place of birth for the foreign-born population - Guyana (%)
Place of birth for the foreign-born population - Peru (%)
Place of birth for the foreign-born population - Uruguay (%)
Place of birth for the foreign-born population - Venezuela (%)
Place of birth for the foreign-born population - Other South America (%)
Place of birth for the foreign-born population - Canada (%)
Place of birth for the foreign-born population - Other Northern America (%)
Place of birth for the foreign-born population - Other (%)
Latest news about races in Irving, TX collected exclusively by city-data.com from local newspapers, TV, and radio stations
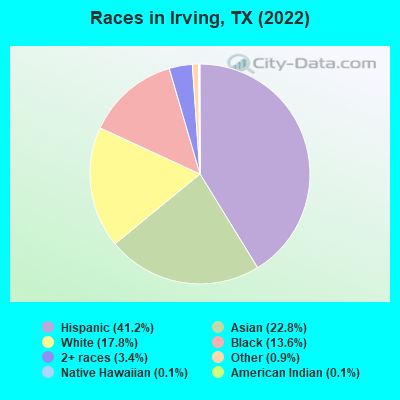
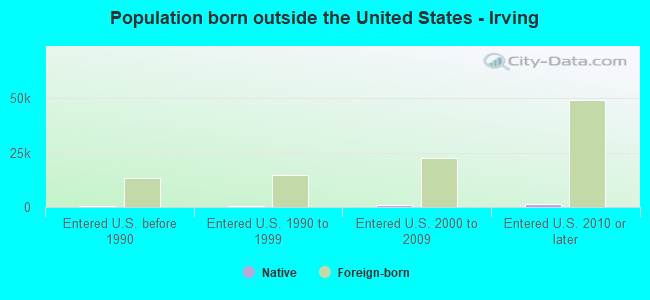
According to 2022 data, the most numerous races in Irving, TX are Hispanic (104,928 residents), White alone (45,437 residents), and Black alone (34,572 residents). 42.8% of Irving residents speak English at home. 42.6% of Irving, TX residents are foreign-born (20.6% born in Latin America, 16.9% born in Asia), which is 60.1% greater than the foreign-born rate of 17.0% across the entire state of Texas.
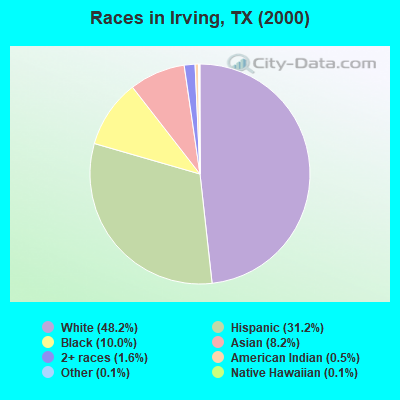
Race distribution in Irving
2000 2022
92,445 48.2% White alone 59,838 31.2% Hispanic 19,254 10.0% Black alone 15,674 8.2% Asian alone 3,053 1.6% Two or more races 905 0.5% American Indian alone 247 0.1% Other race alone 199 0.1% Native Hawaiian and Other
104,928 41.2% Hispanic 57,965 22.8% Asian alone 45,437 17.8% White alone 34,572 13.6% Black alone 8,785 3.4% Two or more races 2,367 0.9% Other race alone 316 0.1% American Indian alone 342 0.1% Native Hawaiian and Other
2000 2022
10,933,313 52.4% White alone 6,669,666 32.0% Hispanic 2,364,255 11.3% Black alone 554,445 2.7% Asian alone 230,567 1.1% Two or more races 68,859 0.3% American Indian alone 19,958 0.10% Other race alone 10,757 0.05% Native Hawaiian and Other
12,070,642 40.2% Hispanic 11,683,430 38.9% White alone 3,508,706 11.7% Black alone 1,608,173 5.4% Asian alone 956,560 3.2% Two or more races 125,763 0.4% Other race alone 47,023 0.2% American Indian alone 29,275 0.10% Native Hawaiian and Other
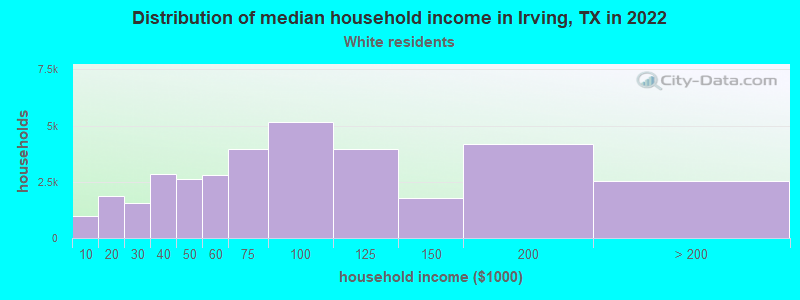
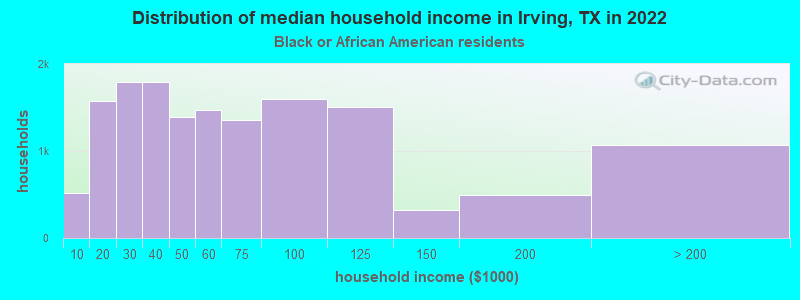
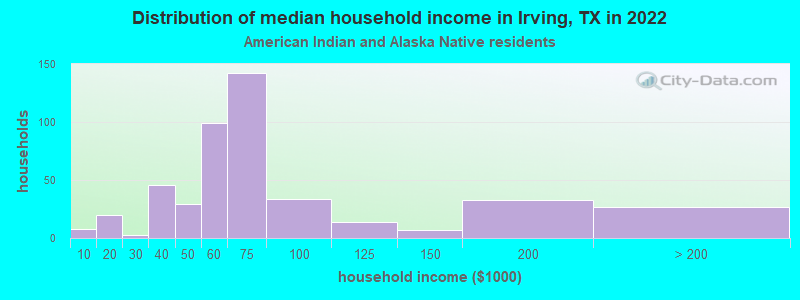
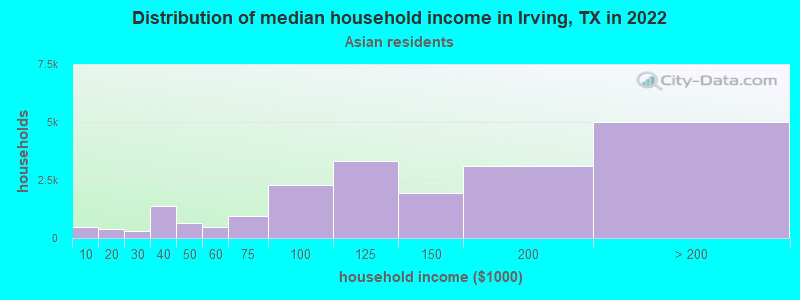
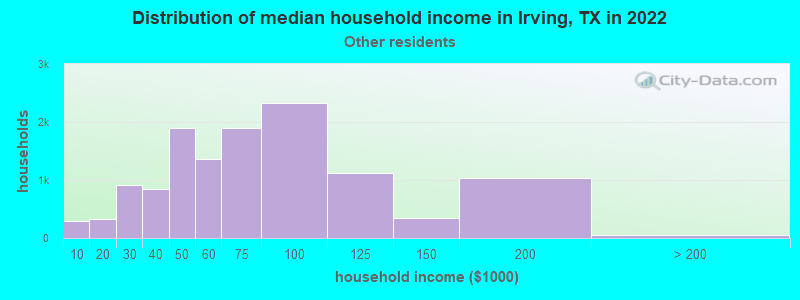
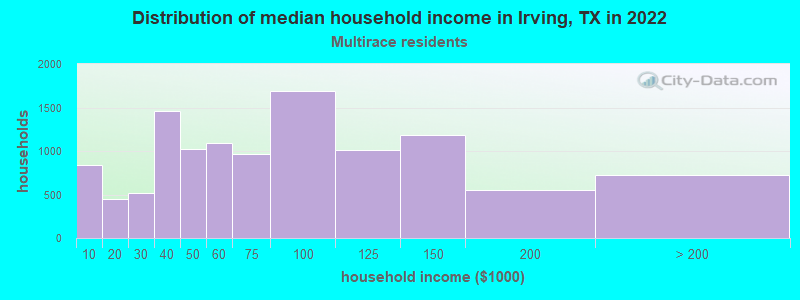
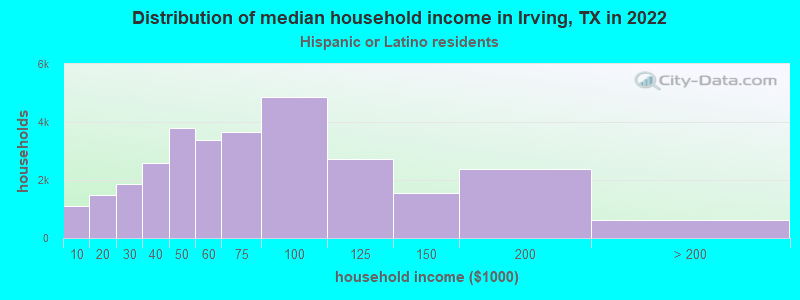
Income and house value in Irving Median household income in 2022 $83,463 White non-Hispanic householders$51,844 Black householders$98,000 American Indian and Alaska Native householders$123,195 Asian householders$63,789 Some other race householders$69,686 Two or more races householders$63,496 Hispanic or Latino race householdersMedian 2022 house value $304,607 White Non-Hispanic householders$280,908 Black or African American householders$289,440 American Indian or Alaska Native householders $393,398 Asian householders$268,585 Native Hawaiian and other Pacific Islander householders$239,830 Some other race householders$274,904 Two or more races householders$254,682 Hispanic or Latino householders
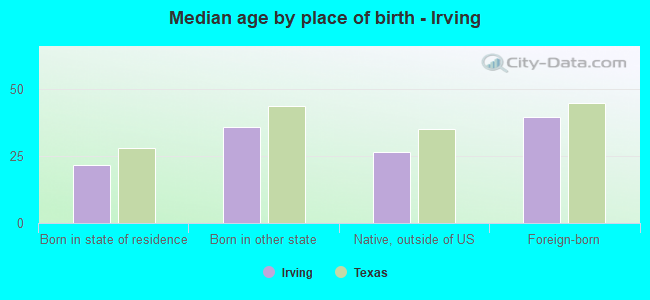
Median age by race in Irving
35.0 Median age for White residents33.8 36.8 32.1 Median age for Black or African American residents31.9 32.6 36.4 Median age for American Indian / Alaska Native residents36.5 33.5 34.2 Median age for Asian residents35.0 33.6 26.7 Median age for Native Hawaiian / Pacific Islander residents-666,666,666.0 26.2 31.7 Median age for Other race residents29.1 34.4 28.2 Median age for Two or more races residents26.7 30.0 51.3 Median age for White alone residents46.8 53.1 28.2 Median age for Hispanic or Latino residents27.5 28.8
Owner/renter occupied households by race in Irving
House owners and renters - White residents 15,933 46.5% Owner occupied18,321 53.5% Renter occupiedHouse owners and renters - Black or African American residents 2,071 13.9% Owner occupied12,804 86.1% Renter occupiedHouse owners and renters - American Indian / Alaska Native residents 243 51.9% Owner occupied226 48.1% Renter occupiedHouse owners and renters - Asian residents 9,114 44.8% Owner occupied11,220 55.2% Renter occupiedHouse owners and renters - Native Hawaiian / Pacific Islander residents 15 40.7% Owner occupied23 59.3% Renter occupiedHouse owners and renters - Other race residents 5,254 42.3% Owner occupied7,155 57.7% Renter occupiedHouse owners and renters - Two or more races residents 3,782 32.9% Owner occupied7,699 67.1% Renter occupiedHouse owners and renters - White alone residents 13,485 55.2% Owner occupied10,955 44.8% Renter occupiedHouse owners and renters - Hispanic or Latino residents 10,304 34.3% Owner occupied19,750 65.7% Renter occupied
Language usage in Irving
English speakers - Total 42.8% of residents of Irving speak English at home.
33.1% of residents speak Spanish at home 42,192 54.3% Speak English very well35,550 45.7% Speak English less than very well24.1% of residents speak other language at home 44,741 79.0% Speak English very well11,929 21.0% Speak English less than very well
English speakers - Born in the United States 81.1% of residents of Irving speak English at home.
11.1% of residents speak Spanish at home 4,632 88.3% Speak English very well614 11.7% Speak English less than very well7.8% of residents speak other language at home 3,548 96.0% Speak English very well148 4.0% Speak English less than very well
English speakers - Native, born elsewhere 62.6% of residents of Irving speak English at home.
13.9% of residents speak Spanish at home 199 47.8% Speak English very well217 52.2% Speak English less than very well23.5% of residents speak other language at home 706 100.0% Speak English very well
English speakers - Foreign-born 5.4% of residents of Irving speak English at home.
46.5% of residents speak Spanish at home 14,286 31.0% Speak English very well31,770 69.0% Speak English less than very well48.1% of residents speak other language at home 36,789 77.2% Speak English very well10,888 22.8% Speak English less than very well
White (Caucasian) - Speak only English Native:
81.3% (47,322)Foreign-born:
6.8% (1,182)
White (Caucasian) - Speak another language Native:
18.7% (10,877)Foreign-born:
93.2% (16,099)
Black or African American - Speak only English Native:
96.2% (26,950)Foreign-born:
15.9% (844)
Black or African American - Speak another language Native:
3.8% (1,050)Foreign-born:
84.1% (4,455)
American Indian / Alaska Native - Speak only English Native:
57.6% (475)Foreign-born:
1.6% (8)
American Indian / Alaska Native - Speak another language Native:
41.4% (341)Foreign-born:
99.1% (492)
Asian - Speak only English Native:
37.5% (4,092)Foreign-born:
5.3% (2,300)
Asian - Speak another language Native:
62.5% (6,807)Foreign-born:
94.7% (40,767)
Native Hawaiian / Pacific Islander - Speak another language Native:
42.9% (84)Foreign-born:
100.0% (12)
Other race - Speak only English Native:
24.4% (4,590)Foreign-born:
1.4% (322)
Other race - Speak another language Native:
75.6% (14,238)Foreign-born:
98.6% (22,586)
Two or more races - Speak only English Native:
61.7% (11,955)Foreign-born:
7.3% (731)
Two or more races - Speak another language Native:
38.3% (7,422)Foreign-born:
92.7% (9,314)
White alone - Speak only English Native:
97.9% (40,279)Foreign-born:
38.7% (1,139)
White alone - Speak another language Native:
2.1% (846)Foreign-born:
61.3% (1,806)
Hispanic or Latino - Speak only English Native:
34.0% (15,974)Foreign-born:
2.0% (909)
Hispanic or Latino - Speak another language Native:
66.0% (31,010)Foreign-born:
98.0% (45,686)
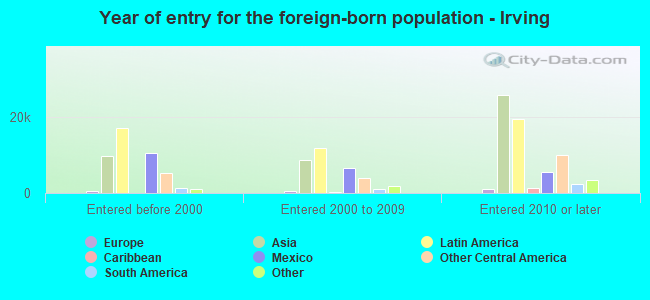
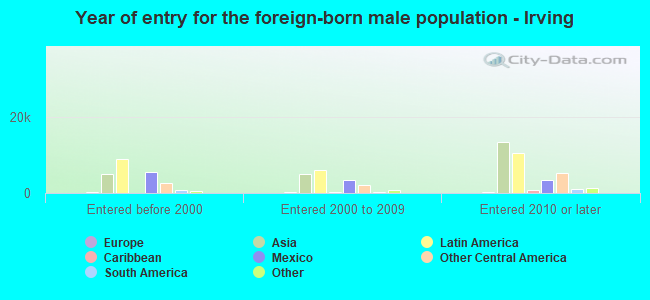
Foreign-born residents in Irving 108,526 residents are foreign born (20.6% Latin America , 16.9% Asia ).
This city:
42.6%Texas:
17.1%
Marital status for residents in Irving Marital status - White (Caucasian) population 15 years and over
Males 35.1% Never married54.5% Now married0.9% Separated1.9% Widowed7.5% DivorcedFemales 28.5% Never married46.7% Now married1.2% Separated8.8% Widowed14.8% DivorcedWomen who gave birth in the past 12 months Now married:
74.8% (1,425)Unmarried:
25.2% (479)
Women who did not give birth in the past 12 months Now married:
46.3% (7,691)Unmarried:
53.7% (8,919)
Marital status - Black or African American population 15 years and over
Males 62.5% Never married30.3% Now married1.2% Separated0.0% Widowed5.9% DivorcedFemales 56.8% Never married21.2% Now married2.7% Separated2.5% Widowed16.8% DivorcedWomen who gave birth in the past 12 months Now married:
100.0% (497)Unmarried:
0.0% (0)
Women who did not give birth in the past 12 months Now married:
19.5% (2,124)Unmarried:
80.5% (8,793)
Marital status - American Indian / Alaska Native population 15 years and over
Males 43.4% Never married42.4% Now married3.2% Separated2.0% Widowed9.0% DivorcedFemales 45.2% Never married44.6% Now married0.0% Separated7.2% Widowed3.1% DivorcedWomen who gave birth in the past 12 months Now married:
100.0% (16)Unmarried:
0.0% (0)
Women who did not give birth in the past 12 months Now married:
42.5% (158)Unmarried:
57.5% (214)
Marital status - Asian population 15 years and over
Males 27.4% Never married71.0% Now married0.0% Separated0.4% Widowed1.2% DivorcedFemales 20.9% Never married72.7% Now married1.3% Separated2.5% Widowed2.5% DivorcedWomen who gave birth in the past 12 months Now married:
93.5% (785)Unmarried:
6.5% (55)
Women who did not give birth in the past 12 months Now married:
70.7% (10,837)Unmarried:
29.3% (4,486)
Marital status - Native Hawaiian / Pacific Islander population 15 years and over
Males 13.2% Never married72.6% Now married0.0% Separated0.0% Widowed14.2% DivorcedFemales 66.7% Never married0.0% Now married33.3% Separated0.0% Widowed0.0% DivorcedWomen who did not give birth in the past 12 months Now married:
33.3% (12)Unmarried:
66.7% (24)
Marital status - Other race population 15 years and over
Males 45.1% Never married49.2% Now married1.5% Separated1.2% Widowed3.1% DivorcedFemales 41.1% Never married43.1% Now married3.4% Separated5.0% Widowed7.3% DivorcedWomen who gave birth in the past 12 months Now married:
74.1% (958)Unmarried:
25.9% (335)
Women who did not give birth in the past 12 months Now married:
38.8% (4,269)Unmarried:
61.2% (6,741)
Marital status - Two or more races population 15 years and over
Males 50.8% Never married35.9% Now married1.8% Separated4.1% Widowed7.4% DivorcedFemales 45.3% Never married42.3% Now married1.5% Separated2.6% Widowed8.3% DivorcedWomen who gave birth in the past 12 months Now married:
70.4% (404)Unmarried:
29.6% (170)
Women who did not give birth in the past 12 months Now married:
37.9% (3,158)Unmarried:
62.1% (5,177)
Marital status - White alone, not Hispanic / Latino population 15 years and over
Males 33.2% Never married53.5% Now married0.2% Separated2.6% Widowed10.5% DivorcedFemales 25.7% Never married43.2% Now married1.0% Separated13.0% Widowed17.1% DivorcedWomen who gave birth in the past 12 months Now married:
100.0% (425)Unmarried:
0.0% (0)
Women who did not give birth in the past 12 months Now married:
41.5% (3,796)Unmarried:
58.5% (5,351)
Marital status - Hispanic or Latino population 15 years and over
Males 41.0% Never married50.4% Now married2.0% Separated2.0% Widowed4.5% DivorcedFemales 38.7% Never married47.9% Now married2.6% Separated3.4% Widowed7.4% DivorcedWomen who gave birth in the past 12 months Now married:
70.6% (2,362)Unmarried:
29.4% (984)
Women who did not give birth in the past 12 months Now married:
46.2% (11,188)Unmarried:
53.8% (13,010)
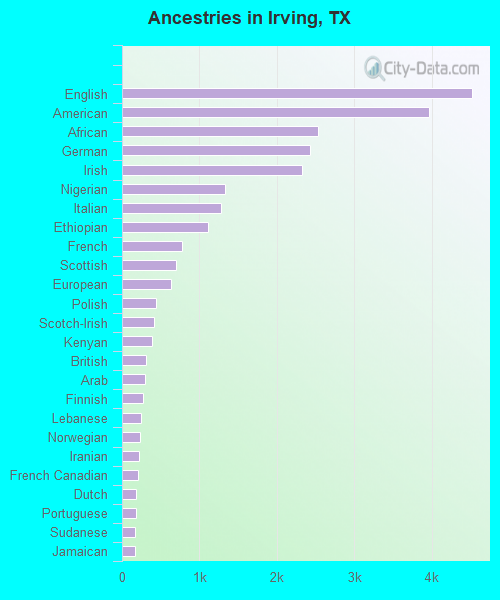
Ancestries in Irving
4,516 2.5% English3,969 2.2% American2,534 1.4% African2,431 1.4% German2,332 1.3% Irish1,332 0.7% Nigerian1,282 0.7% Italian1,109 0.6% Ethiopian772 0.4% French696 0.4% Scottish629 0.4% European439 0.2% Polish412 0.2% Scotch-Irish393 0.2% Kenyan304 0.2% British298 0.2% Arab266 0.1% Finnish242 0.1% Lebanese228 0.1% Norwegian220 0.1% Iranian201 0.1% French Canadian180 0.1% Dutch177 0.10% Portuguese169 0.09% Sudanese168 0.09% Jamaican165 0.09% Welsh162 0.09% Czech147 0.08% Brazilian144 0.08% Greek126 0.07% Egyptian117 0.07% Sierra Leonean110 0.06% Israeli100 0.06% Russian95 0.05% South African94 0.05% Ugandan88 0.05% U.S. Virgin Islander81 0.05% Palestinian79 0.04% Ukrainian72 0.04% Somali71 0.04% Swedish63 0.04% Turkish61 0.03% Hungarian56 0.03% Danish53 0.03% Haitian52 0.03% Scandinavian45 0.03% Jordanian36 0.02% Northern European36 0.02% Czechoslovakian36 0.02% Slavic36 0.02% Syrian31 0.02% Guyanese30 0.02% Canadian26 0.01% Eastern European25 0.01% Celtic25 0.01% Lithuanian22 0.01% Romanian22 0.01% Australian22 0.01% Barbadian19 0.01% Slovak17 0.01% Estonian16 0.01% Serbian16 0.01% German Russian15 0.01% Belgian14 0.01% Armenian13 0.01% Cypriot9 0.01% Austrian
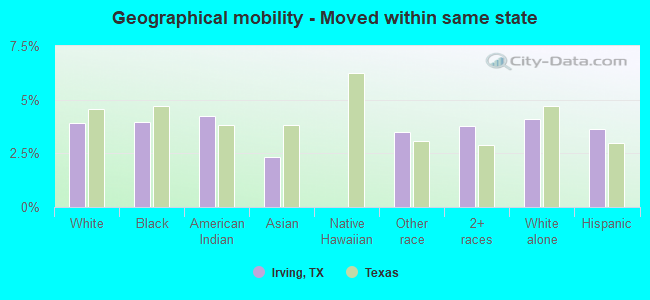
Geographical mobility in Irving Same house 1 year ago 69,850 86.9% White (Caucasian)26,770 78.0% Black or African American1,363 93.2% American Indian / Alaska Native47,684 82.9% Asian128 61.8% Native Hawaiian / Pacific Islander34,984 78.7% Other race26,417 82.1% Two or more races37,558 83.2% White alone, not Hispanic / Latino84,525 83.1% Hispanic or LatinoMoved within same county 5,429 6.8% White / Caucasian2,731 8.0% Black or African American42 2.9% American Indian / Alaska Native2,584 4.5% Asian4,676 10.5% Other race2,725 8.5% Two or more races4,000 8.9% White alone, not Hispanic / Latino8,573 8.4% Hispanic or LatinoMoved within same state 3,141 3.9% White / Caucasian1,353 3.9% Black or African American62 4.2% American Indian / Alaska Native1,343 2.3% Asian1,561 3.5% Other race1,207 3.8% Two or more races1,853 4.1% White alone, not Hispanic / Latino3,689 3.6% Hispanic or LatinoMoved from different state 1,411 1.8% White / Caucasian3,333 9.7% Black or African American2,748 4.8% Asian1,281 2.9% Other race638 2.0% Two or more races1,182 2.6% White alone, not Hispanic / Latino1,833 1.8% Hispanic or LatinoMoved from abroad 557 0.7% White154 0.4% Black or African American3,194 5.5% Asian45 21.8% Native Hawaiian / Pacific Islander1,933 4.4% Other race1,175 3.7% Two or more races557 1.2% White alone, not Hispanic / Latino3,108 3.1% Hispanic or Latino
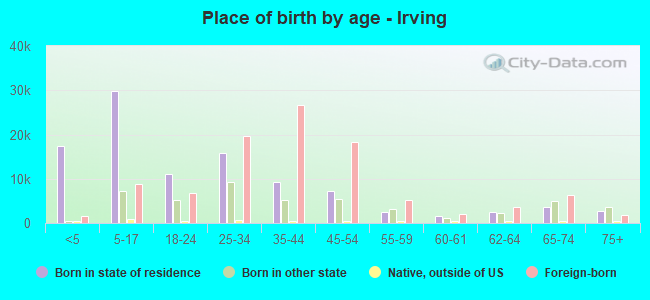
Children Nativity (place of birth) in Irving
Children under 6 years - Living with two parents Both parents native 3,429 100.0% NativeBoth parents foreign-born 9,591 88.0% Native1,305 12.0% Foreign-bornOne native, one foreign-born parent 1,995 100.0% NativeChildren under 6 years - Living with one parent Native parent 4,625 97.8% Native106 2.2% Foreign-bornForeign-born parent 1,363 64.1% Native764 35.9% Foreign-bornChildren 6 to 17 years - Living with two parents Both parents native 3,616 100.0% NativeBoth parents foreign-born 13,367 66.5% Native6,739 33.5% Foreign-bornOne native, one foreign-born parent 3,878 98.0% Native80 2.0% Foreign-bornChildren 6 to 17 years - Living with one parent Native parent 6,772 100.0% NativeForeign-born parent 5,669 56.7% Native4,332 43.3% Foreign-born
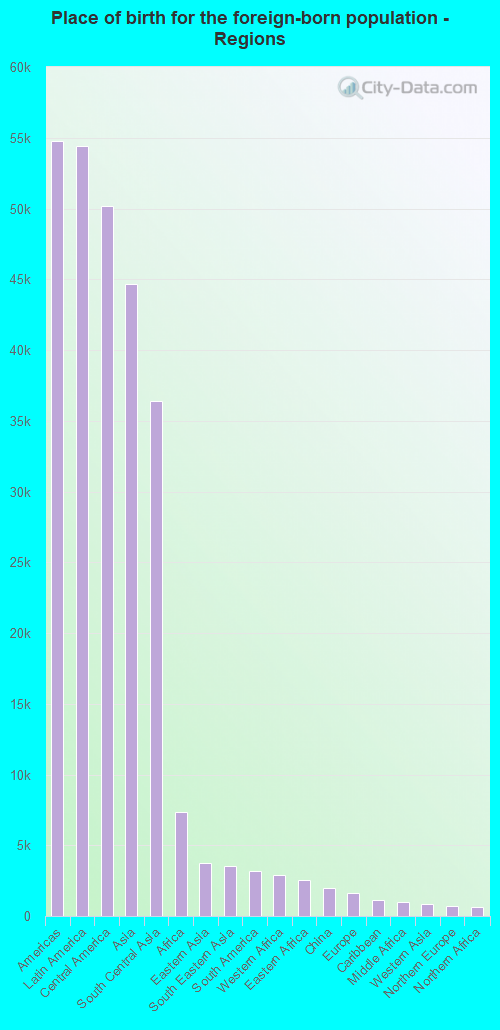
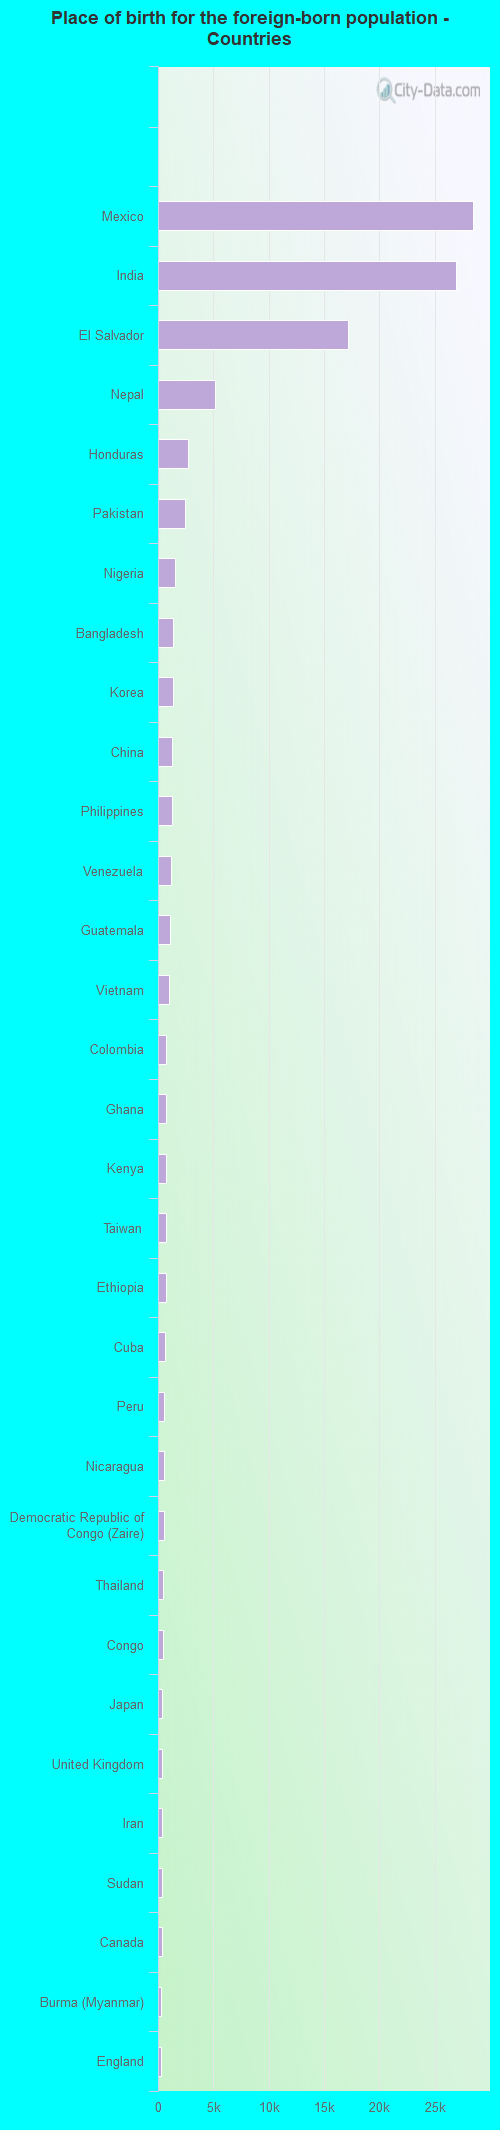
Place of birth for residents in Irving 54,788 Americas54,439 Latin America50,163 Central America44,668 Asia36,378 South Central Asia7,373 Africa3,732 Eastern Asia3,565 South Eastern Asia3,147 South America2,867 Western Africa2,511 Eastern Africa2,013 China1,629 Europe1,128 Caribbean1,007 Middle Africa878 Western Asia710 Northern Europe641 Northern Africa478 Eastern Europe349 Northern America255 Southern Europe183 Western Europe169 Southern Africa67 Oceania47 Australia and New Zealand Subregion28,469 Mexico26,930 India17,170 El Salvador5,175 Nepal2,743 Honduras2,407 Pakistan1,514 Nigeria1,380 Bangladesh1,354 Korea1,265 China1,248 Philippines1,134 Venezuela1,100 Guatemala1,020 Vietnam763 Colombia757 Ghana719 Kenya709 Taiwan691 Ethiopia645 Cuba558 Peru533 Nicaragua504 Democratic Republic of Congo (Zaire)433 Thailand432 Congo364 Japan362 United Kingdom356 Iran335 Sudan328 Canada305 Burma (Myanmar)277 England255 Argentina211 Egypt184 Brazil179 Russia169 South Africa166 Syria165 Dominican Republic165 Eritrea159 Ivory Coast157 Jamaica145 Israel145 Cambodia136 Saudi Arabia131 Singapore131 Panama130 Laos119 Greece115 Italy108 Uganda98 Jordan94 Zimbabwe92 Somalia86 Indonesia82 Kuwait81 Afghanistan78 Lebanon76 Germany72 France72 Ukraine70 Cameroon70 Ecuador68 Poland68 Bolivia63 Malaysia60 Trinidad and Tobago58 Guyana51 Haiti47 Australia44 Czechoslovakia42 Morocco39 Tanzania39 Sierra Leone38 Hong Kong34 Algeria34 Uruguay29 Iraq29 Bhutan25 Barbados24 Belgium24 Liberia24 Ireland23 Scotland21 Portugal21 West Indies19 Senegal19 Lithuania19 Romania18 Turkey18 Chile16 Hungary15 Sweden12 Yemen10 Sri Lanka9 Netherlands9 Fiji9 Costa Rica7 Kazakhstan5 Belize
Grandparents responsible for own grandchildren in Irving
Grandparents (30 to 59 years) White / Caucasian 744 61.2% Responsible for grandchildren472 38.8% Not responsible for grandchildrenBlack or African American 152 54.8% Responsible for grandchildren125 45.2% Not responsible for grandchildrenAmerican Indian / Alaska Native 7 12.5% Responsible for grandchildren53 87.5% Not responsible for grandchildrenAsian 9 4.9% Responsible for grandchildren167 95.1% Not responsible for grandchildrenOther race 462 29.0% Responsible for grandchildren1,129 71.0% Not responsible for grandchildrenTwo or more races 63 25.2% Responsible for grandchildren187 74.8% Not responsible for grandchildrenWhite alone, not Hispanic / Latino 427 60.1% Responsible for grandchildren283 39.9% Not responsible for grandchildrenHispanic or Latino 459 32.2% Responsible for grandchildren967 67.8% Not responsible for grandchildrenGrandparents (60 years and over) White / Caucasian 898 80.3% Responsible for grandchildren220 19.7% Not responsible for grandchildrenBlack or African American 140 43.6% Responsible for grandchildren181 56.4% Not responsible for grandchildrenAsian 184 28.1% Responsible for grandchildren471 71.9% Not responsible for grandchildrenOther race 766 49.4% Responsible for grandchildren786 50.6% Not responsible for grandchildrenTwo or more races 24 6.9% Responsible for grandchildren321 93.1% Not responsible for grandchildrenWhite alone, not Hispanic / Latino 688 75.8% Responsible for grandchildren220 24.2% Not responsible for grandchildrenHispanic or Latino 713 43.6% Responsible for grandchildren922 56.4% Not responsible for grandchildren