Races in Hyrum, Utah (UT) Detailed Stats
Data:
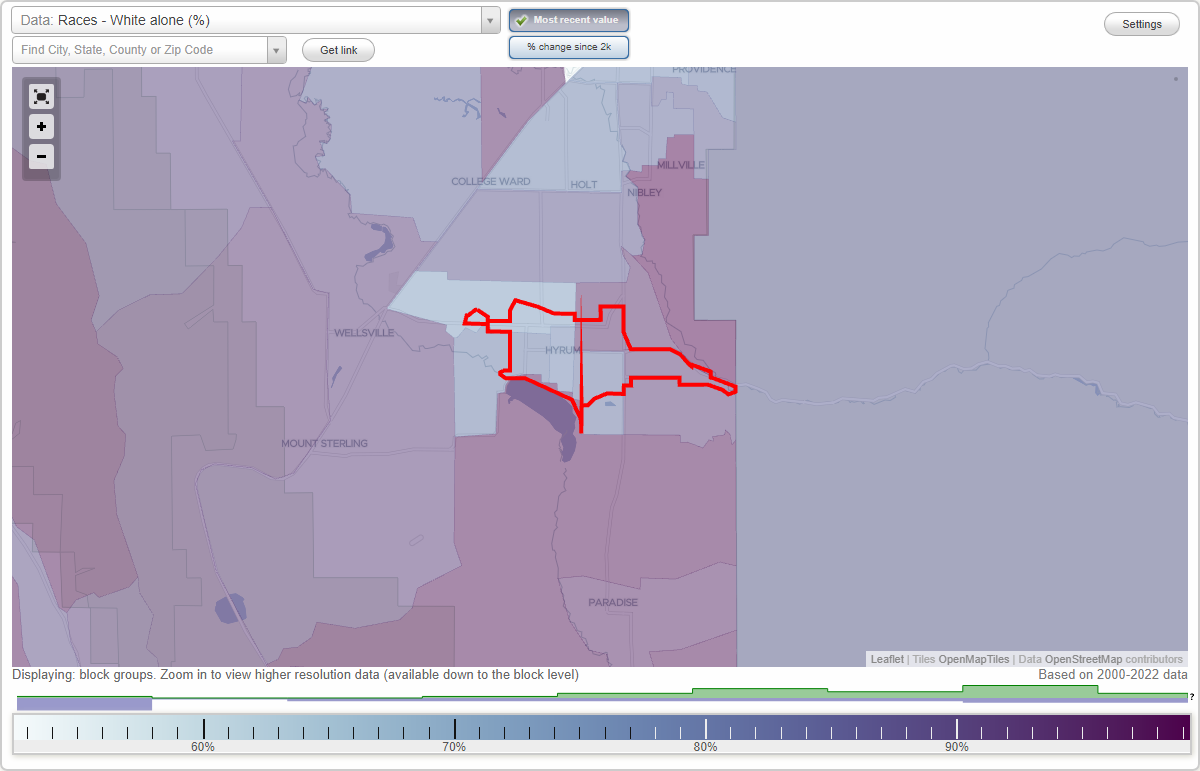
Races - White alone (%)
Races - White alone (% change since 2000)
Races - Black alone (%)
Races - Black alone (% change since 2000)
Races - American Indian alone (%)
Races - American Indian alone (% change since 2000)
Races - Asian alone (%)
Races - Asian alone (% change since 2000)
Races - Hispanic (%)
Races - Hispanic (% change since 2000)
Races - Native Hawaiian and Other Pacific Islander alone (%)
Races - Native Hawaiian and Other Pacific Islander alone (% change since 2000)
Races - Two or more races(%)
Races - Two or more races(% change since 2000)
Races - Other race alone (%)
Races - Other race alone (% change since 2000)
Racial diversity
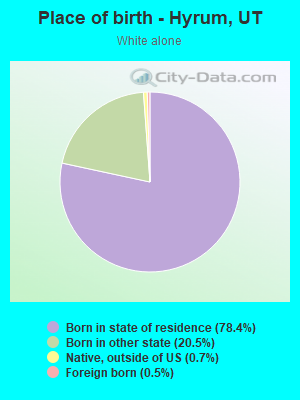
Place of birth - Born in state of residence (%)
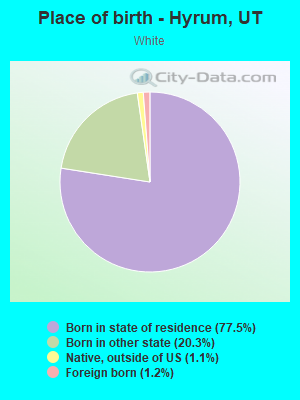
Place of birth - Born in state of residence (%) - White
Place of birth - Born in state of residence (%) - Black or African American
Place of birth - Born in state of residence (%) - Asian
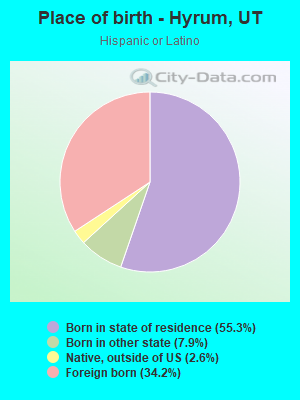
Place of birth - Born in state of residence (%) - Hispanic or Latino
Place of birth - Born in state of residence (%) - American Indian and Alaska Native
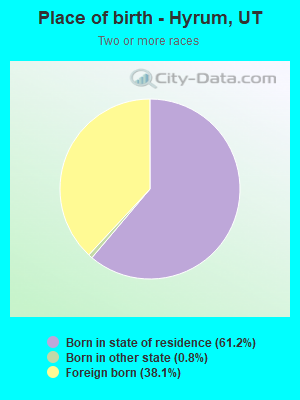
Place of birth - Born in state of residence (%) - Multirace
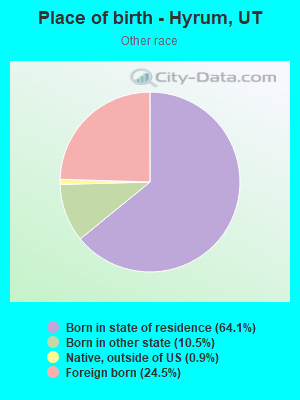
Place of birth - Born in state of residence (%) - Other Race
Place of birth - Born in other state (%)
Place of birth - Born in other state (%) - White
Place of birth - Born in other state (%) - Black or African American
Place of birth - Born in other state (%) - Asian
Place of birth - Born in other state (%) - Hispanic or Latino
Place of birth - Born in other state (%) - American Indian and Alaska Native
Place of birth - Born in other state (%) - Multirace
Place of birth - Born in other state (%) - Other Race
Place of birth - Native, outside of US (%)
Place of birth - Native, outside of US (%) - White
Place of birth - Native, outside of US (%) - Black or African American
Place of birth - Native, outside of US (%) - Asian
Place of birth - Native, outside of US (%) - Hispanic or Latino
Place of birth - Native, outside of US (%) - American Indian and Alaska Native
Place of birth - Native, outside of US (%) - Multirace
Place of birth - Native, outside of US (%) - Other Race
Place of birth - Foreign born (%)
Place of birth - Foreign born (%) - White
Place of birth - Foreign born (%) - Black or African American
Place of birth - Foreign born (%) - Asian
Place of birth - Foreign born (%) - Hispanic or Latino
Place of birth - Foreign born (%) - American Indian and Alaska Native
Place of birth - Foreign born (%) - Multirace
Place of birth - Foreign born (%) - Other Race
Residents speaking English at home (%)
Residents speaking English at home - Born in the United States (%)
Residents speaking English at home - Native, born elsewhere (%)
Residents speaking English at home - Foreign born (%)
Residents speaking Spanish at home (%)
Residents speaking Spanish at home - Born in the United States (%)
Residents speaking Spanish at home - Native, born elsewhere (%)
Residents speaking Spanish at home - Foreign born (%)
Residents speaking other language at home (%)
Residents speaking other language at home - Born in the United States (%)
Residents speaking other language at home - Native, born elsewhere (%)
Residents speaking other language at home - Foreign born (%)
Marital status - Never married (%)
Marital status - Now married (%)
Marital status - Separated (%)
Marital status - Widowed (%)
Marital status - Divorced (%)
Ancestries Reported - Arab (%)
Ancestries Reported - Czech (%)
Ancestries Reported - Danish (%)
Ancestries Reported - Dutch (%)
Ancestries Reported - English (%)
Ancestries Reported - French (%)
Ancestries Reported - French Canadian (%)
Ancestries Reported - German (%)
Ancestries Reported - Greek (%)
Ancestries Reported - Hungarian (%)
Ancestries Reported - Irish (%)
Ancestries Reported - Italian (%)
Ancestries Reported - Lithuanian (%)
Ancestries Reported - Norwegian (%)
Ancestries Reported - Polish (%)
Ancestries Reported - Portuguese (%)
Ancestries Reported - Russian (%)
Ancestries Reported - Scotch-Irish (%)
Ancestries Reported - Scottish (%)
Ancestries Reported - Slovak (%)
Ancestries Reported - Subsaharan African (%)
Ancestries Reported - Swedish (%)
Ancestries Reported - Swiss (%)
Ancestries Reported - Ukrainian (%)
Ancestries Reported - United States (%)
Ancestries Reported - Welsh (%)
Ancestries Reported - West Indian (%)
Ancestries Reported - Other (%)
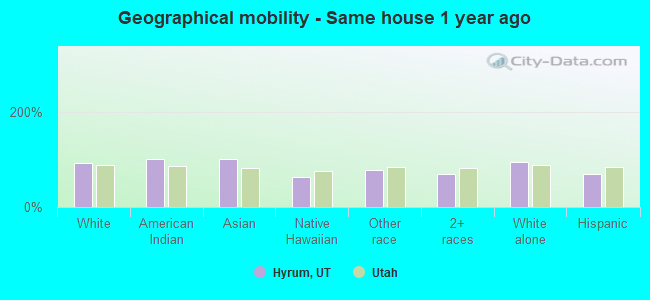
Geographical mobility - Same house 1 year ago (%)
Geographical mobility - Same house 1 year ago (%) - White
Geographical mobility - Same house 1 year ago (%) - Black or African American
Geographical mobility - Same house 1 year ago (%) - Asian
Geographical mobility - Same house 1 year ago (%) - Hispanic or Latino
Geographical mobility - Same house 1 year ago (%) - American Indian and Alaska Native
Geographical mobility - Same house 1 year ago (%) - Multirace
Geographical mobility - Same house 1 year ago (%) - Other Race
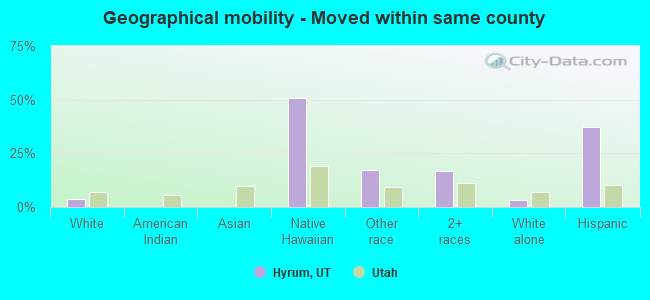
Geographical mobility - Moved within same county (%)
Geographical mobility - Moved within same county (%) - White
Geographical mobility - Moved within same county (%) - Black or African American
Geographical mobility - Moved within same county (%) - Asian
Geographical mobility - Moved within same county (%) - Hispanic or Latino
Geographical mobility - Moved within same county (%) - American Indian and Alaska Native
Geographical mobility - Moved within same county (%) - Multirace
Geographical mobility - Moved within same county (%) - Other Race
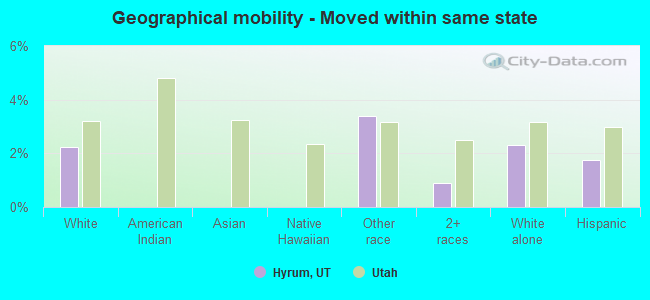
Geographical mobility - Moved from different county within same state (%)
Geographical mobility - Moved from different county within same state (%) - White
Geographical mobility - Moved from different county within same state (%) - Black or African American
Geographical mobility - Moved from different county within same state (%) - Asian
Geographical mobility - Moved from different county within same state (%) - Hispanic or Latino
Geographical mobility - Moved from different county within same state (%) - American Indian and Alaska Native
Geographical mobility - Moved from different county within same state (%) - Multirace
Geographical mobility - Moved from different county within same state (%) - Other Race
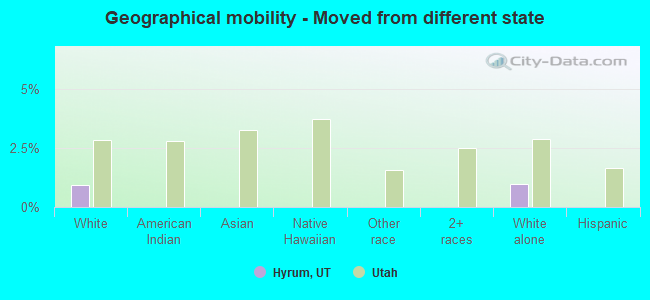
Geographical mobility - Moved from different state (%)
Geographical mobility - Moved from different state (%) - White
Geographical mobility - Moved from different state (%) - Black or African American
Geographical mobility - Moved from different state (%) - Asian
Geographical mobility - Moved from different state (%) - Hispanic or Latino
Geographical mobility - Moved from different state (%) - American Indian and Alaska Native
Geographical mobility - Moved from different state (%) - Multirace
Geographical mobility - Moved from different state (%) - Other Race
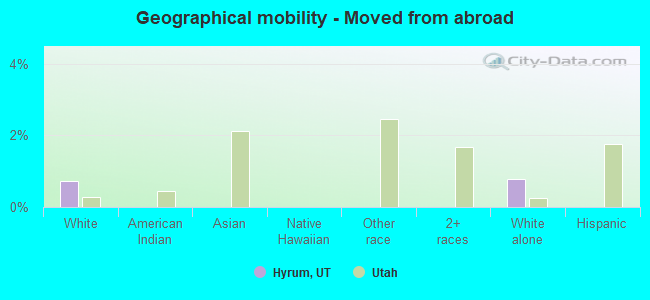
Geographical mobility - Moved from abroad (%)
Geographical mobility - Moved from abroad (%) - White
Geographical mobility - Moved from abroad (%) - Black or African American
Geographical mobility - Moved from abroad (%) - Asian
Geographical mobility - Moved from abroad (%) - Hispanic or Latino
Geographical mobility - Moved from abroad (%) - American Indian and Alaska Native
Geographical mobility - Moved from abroad (%) - Multirace
Geographical mobility - Moved from abroad (%) - Other Race
Place of birth for the foreign-born population - Ireland (%)
Place of birth for the foreign-born population - Denmark (%)
Place of birth for the foreign-born population - Norway (%)
Place of birth for the foreign-born population - Sweden (%)
Place of birth for the foreign-born population - United Kingdom (%)
Place of birth for the foreign-born population - England (%)
Place of birth for the foreign-born population - Scotland (%)
Place of birth for the foreign-born population - Other Northern Europe (%)
Place of birth for the foreign-born population - Austria (%)
Place of birth for the foreign-born population - Belgium (%)
Place of birth for the foreign-born population - France (%)
Place of birth for the foreign-born population - Germany (%)
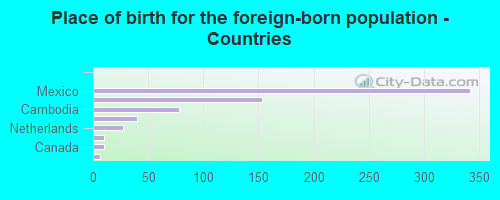
Place of birth for the foreign-born population - Netherlands (%)
Place of birth for the foreign-born population - Switzerland (%)
Place of birth for the foreign-born population - Other Western Europe (%)
Place of birth for the foreign-born population - Greece (%)
Place of birth for the foreign-born population - Italy (%)
Place of birth for the foreign-born population - Portugal (%)
Place of birth for the foreign-born population - Spain (%)
Place of birth for the foreign-born population - Other Southern Europe (%)
Place of birth for the foreign-born population - Albania (%)
Place of birth for the foreign-born population - Belarus (%)
Place of birth for the foreign-born population - Bosnia and Herzegovina (%)
Place of birth for the foreign-born population - Bulgaria (%)
Place of birth for the foreign-born population - Croatia (%)
Place of birth for the foreign-born population - Czechoslovakia (%)
Place of birth for the foreign-born population - Hungary (%)
Place of birth for the foreign-born population - Latvia (%)
Place of birth for the foreign-born population - Lithuania (%)
Place of birth for the foreign-born population - North Macedonia (Macedonia) (%)
Place of birth for the foreign-born population - Moldova (%)
Place of birth for the foreign-born population - Poland (%)
Place of birth for the foreign-born population - Romania (%)
Place of birth for the foreign-born population - Russia (%)
Place of birth for the foreign-born population - Serbia (%)
Place of birth for the foreign-born population - Ukraine (%)
Place of birth for the foreign-born population - Other Eastern Europe (%)
Place of birth for the foreign-born population - China (%)
Place of birth for the foreign-born population - Hong Kong (%)
Place of birth for the foreign-born population - Taiwan (%)
Place of birth for the foreign-born population - Japan (%)
Place of birth for the foreign-born population - Korea (%)
Place of birth for the foreign-born population - Other Eastern Asia (%)
Place of birth for the foreign-born population - Afghanistan (%)
Place of birth for the foreign-born population - Bangladesh (%)
Place of birth for the foreign-born population - India (%)
Place of birth for the foreign-born population - Iran (%)
Place of birth for the foreign-born population - Kazakhstan (%)
Place of birth for the foreign-born population - Nepal (%)
Place of birth for the foreign-born population - Pakistan (%)
Place of birth for the foreign-born population - Sri Lanka (%)
Place of birth for the foreign-born population - Uzbekistan (%)
Place of birth for the foreign-born population - Other South Central Asia (%)
Place of birth for the foreign-born population - Burma (%)
Place of birth for the foreign-born population - Cambodia (%)
Place of birth for the foreign-born population - Indonesia (%)
Place of birth for the foreign-born population - Laos (%)
Place of birth for the foreign-born population - Malaysia (%)
Place of birth for the foreign-born population - Philippines (%)
Place of birth for the foreign-born population - Singapore (%)
Place of birth for the foreign-born population - Thailand (%)
Place of birth for the foreign-born population - Vietnam (%)
Place of birth for the foreign-born population - Other South Eastern Asia (%)
Place of birth for the foreign-born population - Armenia (%)
Place of birth for the foreign-born population - Iraq (%)
Place of birth for the foreign-born population - Israel (%)
Place of birth for the foreign-born population - Jordan (%)
Place of birth for the foreign-born population - Kuwait (%)
Place of birth for the foreign-born population - Lebanon (%)
Place of birth for the foreign-born population - Saudi Arabia (%)
Place of birth for the foreign-born population - Syria (%)
Place of birth for the foreign-born population - Turkey (%)
Place of birth for the foreign-born population - Yemen (%)
Place of birth for the foreign-born population - Other Western Asia (%)
Place of birth for the foreign-born population - Eritrea (%)
Place of birth for the foreign-born population - Ethiopia (%)
Place of birth for the foreign-born population - Kenya (%)
Place of birth for the foreign-born population - Somalia (%)
Place of birth for the foreign-born population - Uganda (%)
Place of birth for the foreign-born population - Zimbabwe (%)
Place of birth for the foreign-born population - Other Eastern Africa (%)
Place of birth for the foreign-born population - Cameroon (%)
Place of birth for the foreign-born population - Congo (%)
Place of birth for the foreign-born population - Democratic Republic of Congo (Zaire) (%)
Place of birth for the foreign-born population - Other Middle Africa (%)
Place of birth for the foreign-born population - Egypt (%)
Place of birth for the foreign-born population - Morocco (%)
Place of birth for the foreign-born population - Sudan (%)
Place of birth for the foreign-born population - Other Northern Africa (%)
Place of birth for the foreign-born population - South Africa (%)
Place of birth for the foreign-born population - Other Southern Africa (%)
Place of birth for the foreign-born population - Cabo Verde (%)
Place of birth for the foreign-born population - Ghana (%)
Place of birth for the foreign-born population - Liberia (%)
Place of birth for the foreign-born population - Nigeria (%)
Place of birth for the foreign-born population - Senegal (%)
Place of birth for the foreign-born population - Sierra Leone (%)
Place of birth for the foreign-born population - Other Western Africa (%)
Place of birth for the foreign-born population - Australia (%)
Place of birth for the foreign-born population - New Zealand (%)
Place of birth for the foreign-born population - Fiji (%)
Place of birth for the foreign-born population - Micronesia (%)
Place of birth for the foreign-born population - Bahamas (%)
Place of birth for the foreign-born population - Barbados (%)
Place of birth for the foreign-born population - Cuba (%)
Place of birth for the foreign-born population - Dominica (%)
Place of birth for the foreign-born population - Dominican Republic (%)
Place of birth for the foreign-born population - Grenada (%)
Place of birth for the foreign-born population - Haiti (%)
Place of birth for the foreign-born population - Jamaica (%)
Place of birth for the foreign-born population - St. Vincent and the Grenadines (%)
Place of birth for the foreign-born population - Trinidad and Tobago (%)
Place of birth for the foreign-born population - West Indies (%)
Place of birth for the foreign-born population - Other Caribbean (%)
Place of birth for the foreign-born population - Belize (%)
Place of birth for the foreign-born population - Costa Rica (%)
Place of birth for the foreign-born population - El Salvador (%)
Place of birth for the foreign-born population - Guatemala (%)
Place of birth for the foreign-born population - Honduras (%)
Place of birth for the foreign-born population - Mexico (%)
Place of birth for the foreign-born population - Nicaragua (%)
Place of birth for the foreign-born population - Panama (%)
Place of birth for the foreign-born population - Other Central America (%)
Place of birth for the foreign-born population - Argentina (%)
Place of birth for the foreign-born population - Bolivia (%)
Place of birth for the foreign-born population - Brazil (%)
Place of birth for the foreign-born population - Chile (%)
Place of birth for the foreign-born population - Colombia (%)
Place of birth for the foreign-born population - Ecuador (%)
Place of birth for the foreign-born population - Guyana (%)
Place of birth for the foreign-born population - Peru (%)
Place of birth for the foreign-born population - Uruguay (%)
Place of birth for the foreign-born population - Venezuela (%)
Place of birth for the foreign-born population - Other South America (%)
Place of birth for the foreign-born population - Canada (%)
Place of birth for the foreign-born population - Other Northern America (%)
Place of birth for the foreign-born population - Other (%)
Latest news about races in Hyrum, UT collected exclusively by city-data.com from local newspapers, TV, and radio stations
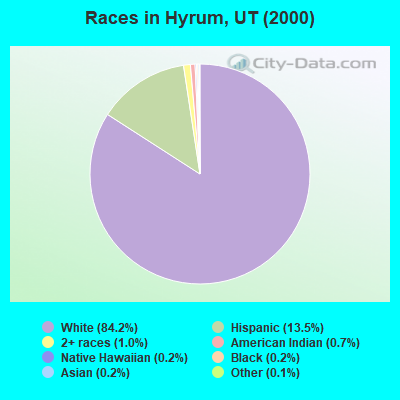
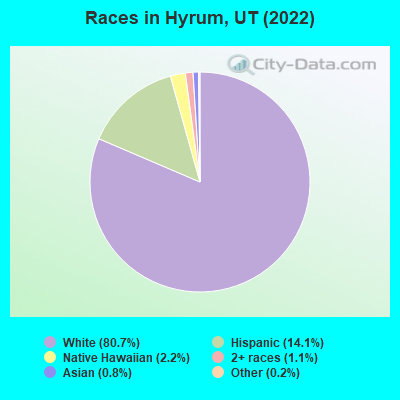
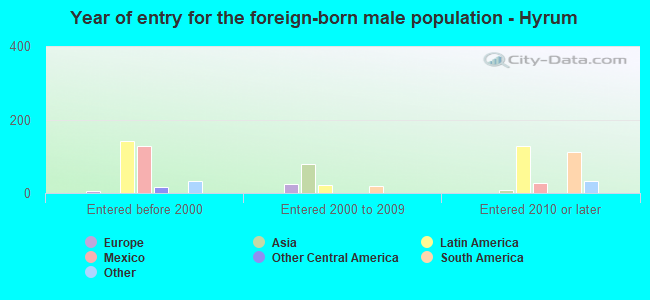
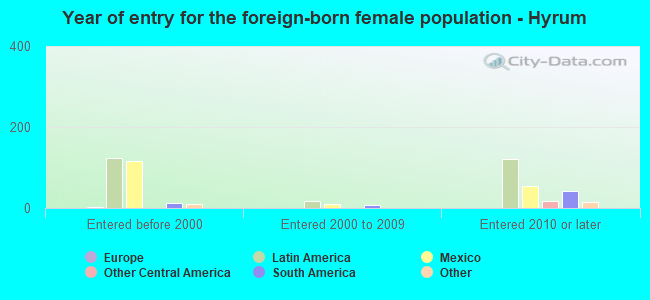
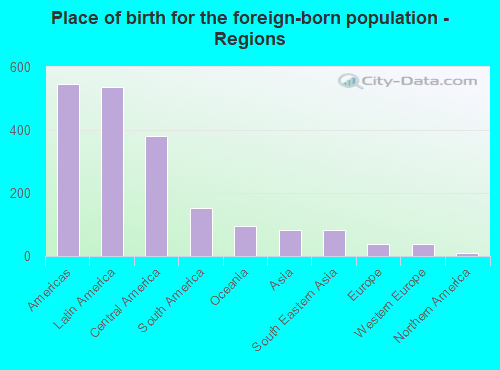
According to 2022 data, the most numerous races in Hyrum, UT are White alone (8,142 residents), Hispanic (1,421 residents), and Two or more races (111 residents). 88.5% of Hyrum residents speak English at home. 7.6% of Hyrum, UT residents are foreign-born (5.2% born in Latin America, 0.9% born in Oceania, 0.8% born in Asia), which is 5.8% less than the foreign-born rate of 8.0% across the entire state of Utah.
Race distribution in Hyrum
2000 2022
1,904,265 85.3% White alone 201,559 9.0% Hispanic 36,483 1.6% Asian alone 31,308 1.4% Two or more races 26,663 1.2% American Indian alone 14,806 0.7% Native Hawaiian and Other 16,137 0.7% Black alone 1,948 0.09% Other race alone
2,557,466 75.6% White alone 512,086 15.1% Hispanic 119,308 3.5% Two or more races 82,388 2.4% Asian alone 36,978 1.1% Native Hawaiian and Other 34,873 1.0% Black alone 22,803 0.7% American Indian alone 14,898 0.4% Other race alone
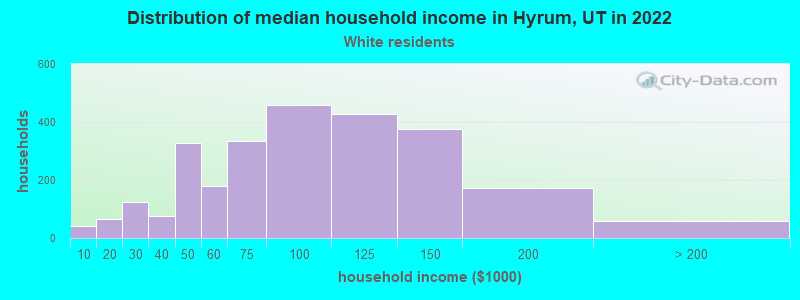
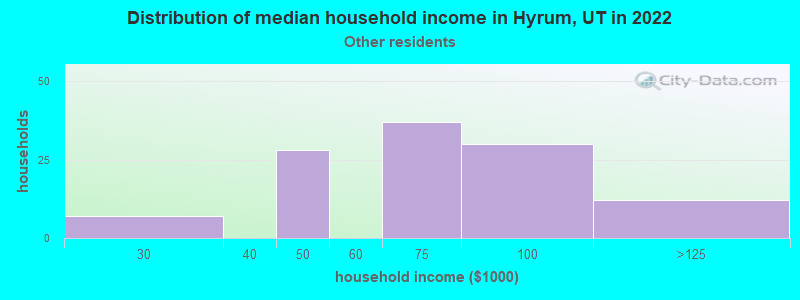
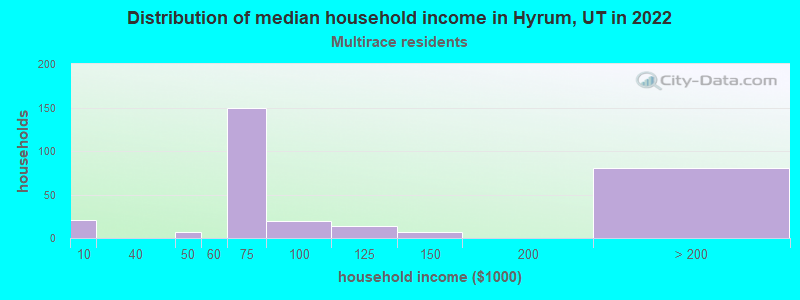
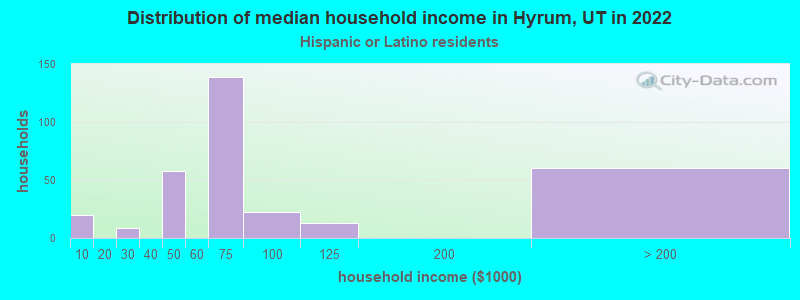
Income and house value in Hyrum Median household income in 2022 $85,409 White non-Hispanic householders$70,235 Some other race householders$54,638 Two or more races householders$51,844 Hispanic or Latino race householdersMedian 2022 house value $422,758 White Non-Hispanic householders$495,983 Native Hawaiian and other Pacific Islander householders$464,240 Some other race householders$568,847 Two or more races householders$450,893 Hispanic or Latino householders
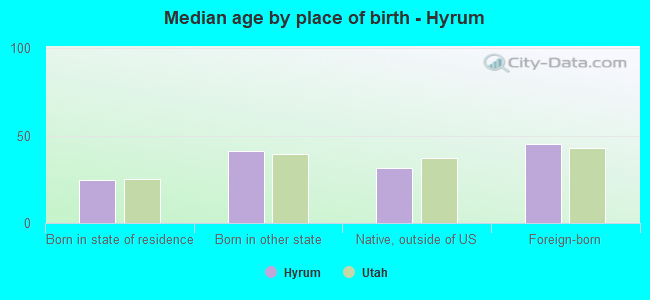
Median age by race in Hyrum
30.8 Median age for White residents31.4 30.3 -503,105,589.6 Median age for Black or African American residents-656,596,172.6 -661,040,787.0 -1,054,970,759.2 Median age for American Indian / Alaska Native residents-720,955,482.4 -1,202,099,736.3 -642,066,420.0 Median age for Asian residents-894,117,646.2 -528,258,361.6 15.1 Median age for Native Hawaiian / Pacific Islander residents26.5 -664,285,713.6 20.0 Median age for Other race residents17.4 26.8 45.8 Median age for Two or more races residents27.7 50.9 31.3 Median age for White alone residents32.9 30.3 28.2 Median age for Hispanic or Latino residents24.3 38.9
Owner/renter occupied households by race in Hyrum
House owners and renters - White residents 2,416 90.7% Owner occupied247 9.3% Renter occupiedHouse owners and renters - American Indian / Alaska Native residents 9 100.0% Renter occupiedHouse owners and renters - Native Hawaiian / Pacific Islander residents 13 28.8% Owner occupied31 71.2% Renter occupiedHouse owners and renters - Other race residents 87 70.8% Owner occupied36 29.2% Renter occupiedHouse owners and renters - Two or more races residents 154 44.6% Owner occupied192 55.4% Renter occupiedHouse owners and renters - White alone residents 2,466 92.3% Owner occupied206 7.7% Renter occupiedHouse owners and renters - Hispanic or Latino residents 115 35.3% Owner occupied210 64.7% Renter occupied
Language usage in Hyrum
English speakers - Total 88.5% of residents of Hyrum speak English at home.
10.1% of residents speak Spanish at home 609 64.7% Speak English very well332 35.3% Speak English less than very well1.3% of residents speak other language at home 109 88.6% Speak English very well14 11.4% Speak English less than very well
English speakers - Born in the United States 95.5% of residents of Hyrum speak English at home.
4.1% of residents speak Spanish at home 72 100.0% Speak English very well0.5% of residents speak other language at home 9 100.0% Speak English very well
English speakers - Native, born elsewhere 81.1% of residents of Hyrum speak English at home.
31.1% of residents speak Spanish at home 23 100.0% Speak English very well
English speakers - Foreign-born 20.2% of residents of Hyrum speak English at home.
65.4% of residents speak Spanish at home 153 35.2% Speak English very well282 64.8% Speak English less than very well17.0% of residents speak other language at home 100 88.5% Speak English very well13 11.5% Speak English less than very well
White (Caucasian) - Speak only English Native:
97.7% (7,364)Foreign-born:
72.4% (71)
White (Caucasian) - Speak another language Native:
2.3% (175)Foreign-born:
57.8% (57)
Other race - Speak another language Native:
37.3% (124)Foreign-born:
93.1% (139)
Two or more races - Speak another language Native:
50.1% (273)Foreign-born:
100.0% (383)
White alone - Speak only English Native:
98.6% (7,409)Foreign-born:
94.5% (38)
White alone - Speak another language Native:
1.1% (79)Foreign-born:
10.9% (4)
Hispanic or Latino - Speak only English Native:
43.6% (315)Foreign-born:
8.6% (43)
Hispanic or Latino - Speak another language Native:
54.3% (393)Foreign-born:
92.6% (463)
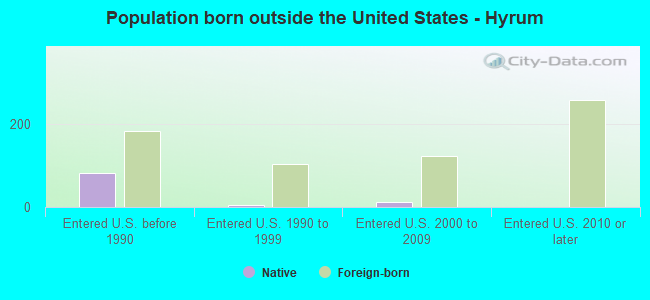
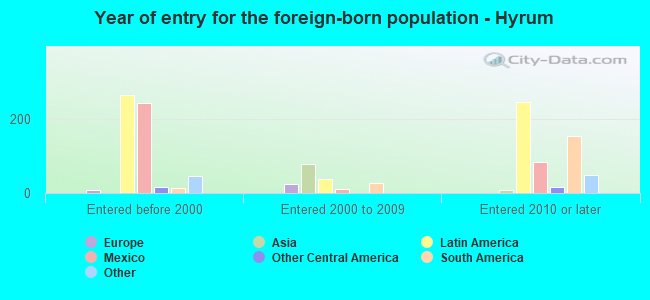
Foreign-born residents in Hyrum 763 residents are foreign born (5.2% Latin America , 0.9% Oceania , 0.8% Asia ).
Marital status for residents in Hyrum Marital status - White (Caucasian) population 15 years and over
Males 19.9% Never married72.1% Now married0.0% Separated2.0% Widowed6.1% DivorcedFemales 22.8% Never married66.4% Now married1.2% Separated5.3% Widowed4.3% DivorcedWomen who gave birth in the past 12 months Now married:
74.6% (50)Unmarried:
25.4% (17)
Women who did not give birth in the past 12 months Now married:
65.1% (1,348)Unmarried:
34.9% (724)
Marital status - Native Hawaiian / Pacific Islander population 15 years and over
Males 64.0% Never married12.9% Now married0.0% Separated0.0% Widowed23.0% DivorcedFemales 50.0% Never married50.0% Now married0.0% Separated0.0% Widowed0.0% DivorcedWomen who did not give birth in the past 12 months Now married:
50.0% (12)Unmarried:
50.0% (12)
Marital status - Other race population 15 years and over
Males 42.3% Never married57.7% Now married0.0% Separated0.0% Widowed0.0% DivorcedFemales 24.1% Never married58.6% Now married0.0% Separated0.0% Widowed17.3% DivorcedWomen who did not give birth in the past 12 months Now married:
63.2% (83)Unmarried:
36.8% (48)
Marital status - Two or more races population 15 years and over
Males 31.1% Never married59.1% Now married9.8% Separated0.0% Widowed0.0% DivorcedFemales 47.9% Never married52.1% Now married0.0% Separated0.0% Widowed0.0% DivorcedWomen who did not give birth in the past 12 months Now married:
79.2% (126)Unmarried:
20.8% (33)
Marital status - White alone, not Hispanic / Latino population 15 years and over
Males 19.0% Never married72.6% Now married0.0% Separated2.1% Widowed6.3% DivorcedFemales 23.8% Never married64.9% Now married1.3% Separated5.5% Widowed4.5% DivorcedWomen who gave birth in the past 12 months Now married:
74.6% (51)Unmarried:
25.4% (17)
Women who did not give birth in the past 12 months Now married:
63.4% (1,276)Unmarried:
36.6% (736)
Marital status - Hispanic or Latino population 15 years and over
Males 39.2% Never married55.9% Now married4.9% Separated0.0% Widowed0.0% DivorcedFemales 30.5% Never married64.4% Now married0.0% Separated0.0% Widowed5.1% DivorcedWomen who did not give birth in the past 12 months Now married:
77.1% (250)Unmarried:
22.9% (74)
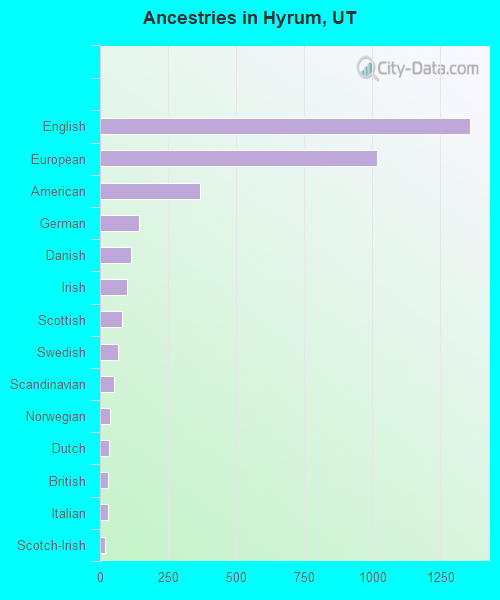
Ancestries in Hyrum
1,361 26.7% English1,016 20.0% European366 7.2% American143 2.8% German113 2.2% Danish99 1.9% Irish81 1.6% Scottish67 1.3% Swedish50 1.0% Scandinavian37 0.7% Norwegian32 0.6% Dutch30 0.6% British29 0.6% Italian19 0.4% Scotch-Irish9 0.2% Canadian7 0.1% Welsh5 0.10% Polish4 0.08% French
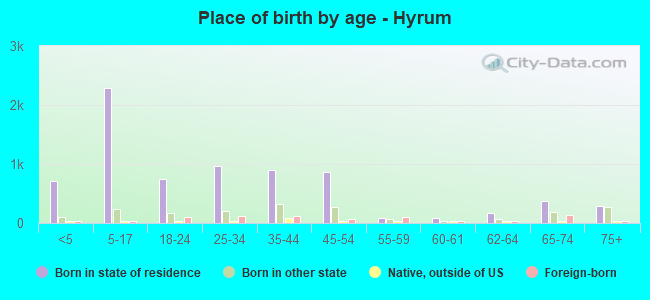
Children Nativity (place of birth) in Hyrum
Children under 6 years - Living with two parents Both parents native 812 100.0% NativeBoth parents foreign-born 9 100.0% NativeOne native, one foreign-born parent 47 100.0% NativeChildren under 6 years - Living with one parent Native parent 59 100.0% NativeChildren 6 to 17 years - Living with two parents Both parents native 1,941 100.0% NativeBoth parents foreign-born 52 64.3% Native29 35.7% Foreign-bornOne native, one foreign-born parent 87 100.0% NativeChildren 6 to 17 years - Living with one parent Native parent 39 100.0% NativeForeign-born parent 128 52.3% Native117 47.7% Foreign-born
Grandparents responsible for own grandchildren in Hyrum
Grandparents (30 to 59 years) White / Caucasian 29 79.5% Responsible for grandchildren8 20.5% Not responsible for grandchildrenOther race 17 100.0% Not responsible for grandchildrenWhite alone, not Hispanic / Latino 32 80.3% Responsible for grandchildren8 19.7% Not responsible for grandchildrenHispanic or Latino 18 100.0% Not responsible for grandchildrenGrandparents (60 years and over) White / Caucasian 15 53.8% Responsible for grandchildren13 46.2% Not responsible for grandchildrenWhite alone, not Hispanic / Latino 15 52.9% Responsible for grandchildren13 47.1% Not responsible for grandchildren