Races in Hendersonville, North Carolina (NC) Detailed Stats
Data:
Races - White alone (%)
Races - White alone (% change since 2000)
Races - Black alone (%)
Races - Black alone (% change since 2000)
Races - American Indian alone (%)
Races - American Indian alone (% change since 2000)
Races - Asian alone (%)
Races - Asian alone (% change since 2000)
Races - Hispanic (%)
Races - Hispanic (% change since 2000)
Races - Native Hawaiian and Other Pacific Islander alone (%)
Races - Native Hawaiian and Other Pacific Islander alone (% change since 2000)
Races - Two or more races(%)
Races - Two or more races(% change since 2000)
Races - Other race alone (%)
Races - Other race alone (% change since 2000)
Racial diversity
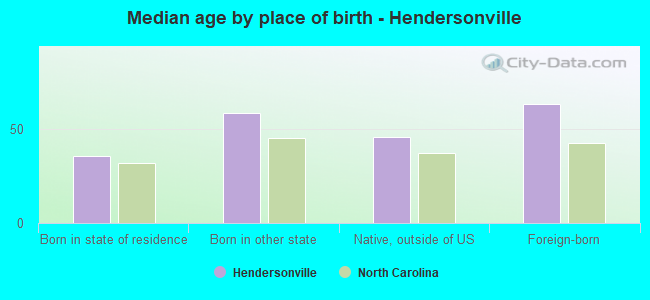
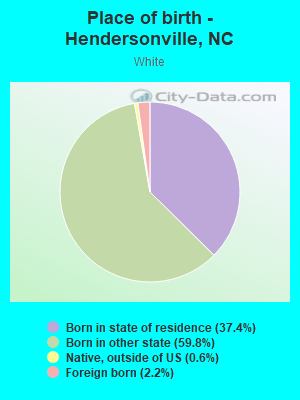
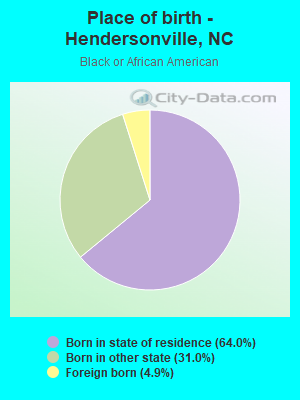
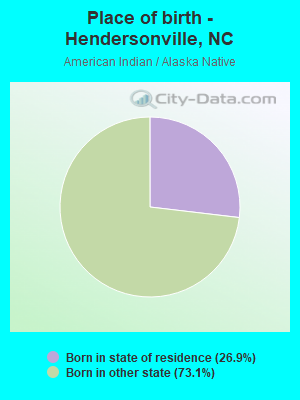
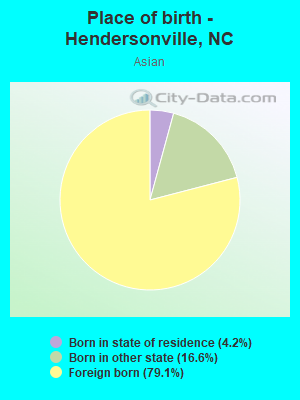
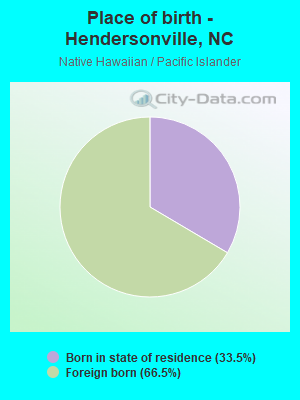
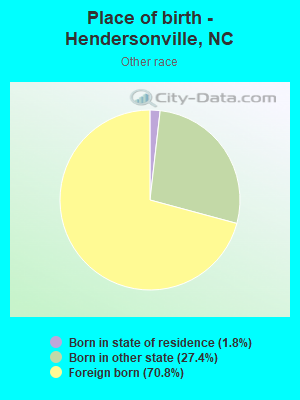
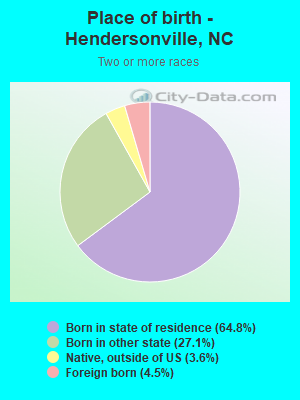
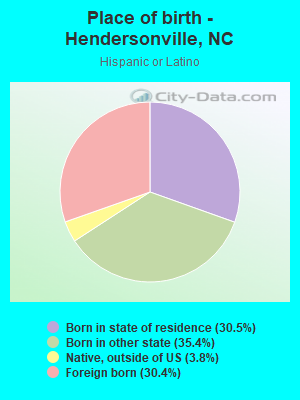
Place of birth - Born in state of residence (%)
Place of birth - Born in state of residence (%) - White
Place of birth - Born in state of residence (%) - Black or African American
Place of birth - Born in state of residence (%) - Asian
Place of birth - Born in state of residence (%) - Hispanic or Latino
Place of birth - Born in state of residence (%) - American Indian and Alaska Native
Place of birth - Born in state of residence (%) - Multirace
Place of birth - Born in state of residence (%) - Other Race
Place of birth - Born in other state (%)
Place of birth - Born in other state (%) - White
Place of birth - Born in other state (%) - Black or African American
Place of birth - Born in other state (%) - Asian
Place of birth - Born in other state (%) - Hispanic or Latino
Place of birth - Born in other state (%) - American Indian and Alaska Native
Place of birth - Born in other state (%) - Multirace
Place of birth - Born in other state (%) - Other Race
Place of birth - Native, outside of US (%)
Place of birth - Native, outside of US (%) - White
Place of birth - Native, outside of US (%) - Black or African American
Place of birth - Native, outside of US (%) - Asian
Place of birth - Native, outside of US (%) - Hispanic or Latino
Place of birth - Native, outside of US (%) - American Indian and Alaska Native
Place of birth - Native, outside of US (%) - Multirace
Place of birth - Native, outside of US (%) - Other Race
Place of birth - Foreign born (%)
Place of birth - Foreign born (%) - White
Place of birth - Foreign born (%) - Black or African American
Place of birth - Foreign born (%) - Asian
Place of birth - Foreign born (%) - Hispanic or Latino
Place of birth - Foreign born (%) - American Indian and Alaska Native
Place of birth - Foreign born (%) - Multirace
Place of birth - Foreign born (%) - Other Race
Residents speaking English at home (%)
Residents speaking English at home - Born in the United States (%)
Residents speaking English at home - Native, born elsewhere (%)
Residents speaking English at home - Foreign born (%)
Residents speaking Spanish at home (%)
Residents speaking Spanish at home - Born in the United States (%)
Residents speaking Spanish at home - Native, born elsewhere (%)
Residents speaking Spanish at home - Foreign born (%)
Residents speaking other language at home (%)
Residents speaking other language at home - Born in the United States (%)
Residents speaking other language at home - Native, born elsewhere (%)
Residents speaking other language at home - Foreign born (%)
Marital status - Never married (%)
Marital status - Now married (%)
Marital status - Separated (%)
Marital status - Widowed (%)
Marital status - Divorced (%)
Ancestries Reported - Arab (%)
Ancestries Reported - Czech (%)
Ancestries Reported - Danish (%)
Ancestries Reported - Dutch (%)
Ancestries Reported - English (%)
Ancestries Reported - French (%)
Ancestries Reported - French Canadian (%)
Ancestries Reported - German (%)
Ancestries Reported - Greek (%)
Ancestries Reported - Hungarian (%)
Ancestries Reported - Irish (%)
Ancestries Reported - Italian (%)
Ancestries Reported - Lithuanian (%)
Ancestries Reported - Norwegian (%)
Ancestries Reported - Polish (%)
Ancestries Reported - Portuguese (%)
Ancestries Reported - Russian (%)
Ancestries Reported - Scotch-Irish (%)
Ancestries Reported - Scottish (%)
Ancestries Reported - Slovak (%)
Ancestries Reported - Subsaharan African (%)
Ancestries Reported - Swedish (%)
Ancestries Reported - Swiss (%)
Ancestries Reported - Ukrainian (%)
Ancestries Reported - United States (%)
Ancestries Reported - Welsh (%)
Ancestries Reported - West Indian (%)
Ancestries Reported - Other (%)
Geographical mobility - Same house 1 year ago (%)
Geographical mobility - Same house 1 year ago (%) - White
Geographical mobility - Same house 1 year ago (%) - Black or African American
Geographical mobility - Same house 1 year ago (%) - Asian
Geographical mobility - Same house 1 year ago (%) - Hispanic or Latino
Geographical mobility - Same house 1 year ago (%) - American Indian and Alaska Native
Geographical mobility - Same house 1 year ago (%) - Multirace
Geographical mobility - Same house 1 year ago (%) - Other Race
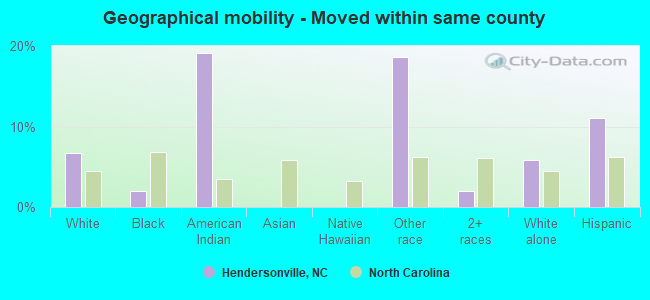
Geographical mobility - Moved within same county (%)
Geographical mobility - Moved within same county (%) - White
Geographical mobility - Moved within same county (%) - Black or African American
Geographical mobility - Moved within same county (%) - Asian
Geographical mobility - Moved within same county (%) - Hispanic or Latino
Geographical mobility - Moved within same county (%) - American Indian and Alaska Native
Geographical mobility - Moved within same county (%) - Multirace
Geographical mobility - Moved within same county (%) - Other Race
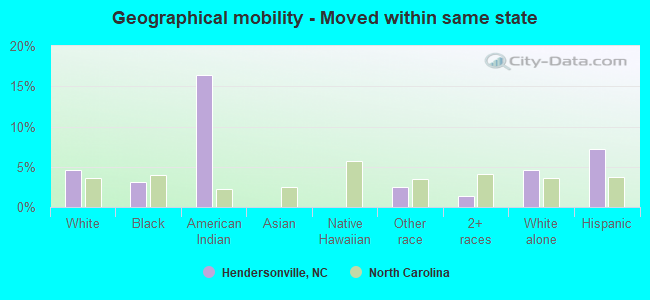
Geographical mobility - Moved from different county within same state (%)
Geographical mobility - Moved from different county within same state (%) - White
Geographical mobility - Moved from different county within same state (%) - Black or African American
Geographical mobility - Moved from different county within same state (%) - Asian
Geographical mobility - Moved from different county within same state (%) - Hispanic or Latino
Geographical mobility - Moved from different county within same state (%) - American Indian and Alaska Native
Geographical mobility - Moved from different county within same state (%) - Multirace
Geographical mobility - Moved from different county within same state (%) - Other Race
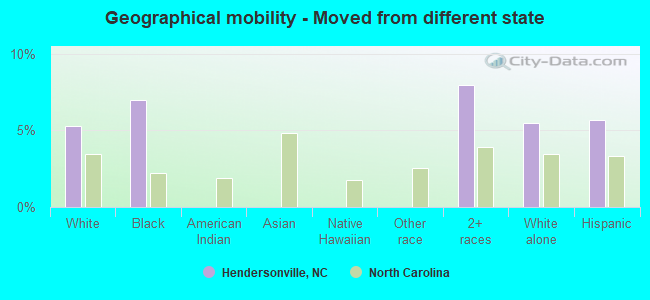
Geographical mobility - Moved from different state (%)
Geographical mobility - Moved from different state (%) - White
Geographical mobility - Moved from different state (%) - Black or African American
Geographical mobility - Moved from different state (%) - Asian
Geographical mobility - Moved from different state (%) - Hispanic or Latino
Geographical mobility - Moved from different state (%) - American Indian and Alaska Native
Geographical mobility - Moved from different state (%) - Multirace
Geographical mobility - Moved from different state (%) - Other Race
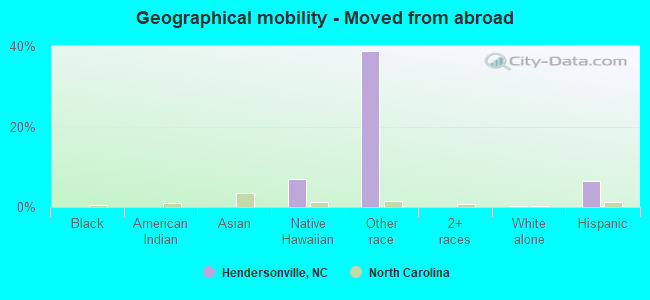
Geographical mobility - Moved from abroad (%)
Geographical mobility - Moved from abroad (%) - White
Geographical mobility - Moved from abroad (%) - Black or African American
Geographical mobility - Moved from abroad (%) - Asian
Geographical mobility - Moved from abroad (%) - Hispanic or Latino
Geographical mobility - Moved from abroad (%) - American Indian and Alaska Native
Geographical mobility - Moved from abroad (%) - Multirace
Geographical mobility - Moved from abroad (%) - Other Race
Place of birth for the foreign-born population - Ireland (%)
Place of birth for the foreign-born population - Denmark (%)
Place of birth for the foreign-born population - Norway (%)
Place of birth for the foreign-born population - Sweden (%)
Place of birth for the foreign-born population - United Kingdom (%)
Place of birth for the foreign-born population - England (%)
Place of birth for the foreign-born population - Scotland (%)
Place of birth for the foreign-born population - Other Northern Europe (%)
Place of birth for the foreign-born population - Austria (%)
Place of birth for the foreign-born population - Belgium (%)
Place of birth for the foreign-born population - France (%)
Place of birth for the foreign-born population - Germany (%)
Place of birth for the foreign-born population - Netherlands (%)
Place of birth for the foreign-born population - Switzerland (%)
Place of birth for the foreign-born population - Other Western Europe (%)
Place of birth for the foreign-born population - Greece (%)
Place of birth for the foreign-born population - Italy (%)
Place of birth for the foreign-born population - Portugal (%)
Place of birth for the foreign-born population - Spain (%)
Place of birth for the foreign-born population - Other Southern Europe (%)
Place of birth for the foreign-born population - Albania (%)
Place of birth for the foreign-born population - Belarus (%)
Place of birth for the foreign-born population - Bosnia and Herzegovina (%)
Place of birth for the foreign-born population - Bulgaria (%)
Place of birth for the foreign-born population - Croatia (%)
Place of birth for the foreign-born population - Czechoslovakia (%)
Place of birth for the foreign-born population - Hungary (%)
Place of birth for the foreign-born population - Latvia (%)
Place of birth for the foreign-born population - Lithuania (%)
Place of birth for the foreign-born population - North Macedonia (Macedonia) (%)
Place of birth for the foreign-born population - Moldova (%)
Place of birth for the foreign-born population - Poland (%)
Place of birth for the foreign-born population - Romania (%)
Place of birth for the foreign-born population - Russia (%)
Place of birth for the foreign-born population - Serbia (%)
Place of birth for the foreign-born population - Ukraine (%)
Place of birth for the foreign-born population - Other Eastern Europe (%)
Place of birth for the foreign-born population - China (%)
Place of birth for the foreign-born population - Hong Kong (%)
Place of birth for the foreign-born population - Taiwan (%)
Place of birth for the foreign-born population - Japan (%)
Place of birth for the foreign-born population - Korea (%)
Place of birth for the foreign-born population - Other Eastern Asia (%)
Place of birth for the foreign-born population - Afghanistan (%)
Place of birth for the foreign-born population - Bangladesh (%)
Place of birth for the foreign-born population - India (%)
Place of birth for the foreign-born population - Iran (%)
Place of birth for the foreign-born population - Kazakhstan (%)
Place of birth for the foreign-born population - Nepal (%)
Place of birth for the foreign-born population - Pakistan (%)
Place of birth for the foreign-born population - Sri Lanka (%)
Place of birth for the foreign-born population - Uzbekistan (%)
Place of birth for the foreign-born population - Other South Central Asia (%)
Place of birth for the foreign-born population - Burma (%)
Place of birth for the foreign-born population - Cambodia (%)
Place of birth for the foreign-born population - Indonesia (%)
Place of birth for the foreign-born population - Laos (%)
Place of birth for the foreign-born population - Malaysia (%)
Place of birth for the foreign-born population - Philippines (%)
Place of birth for the foreign-born population - Singapore (%)
Place of birth for the foreign-born population - Thailand (%)
Place of birth for the foreign-born population - Vietnam (%)
Place of birth for the foreign-born population - Other South Eastern Asia (%)
Place of birth for the foreign-born population - Armenia (%)
Place of birth for the foreign-born population - Iraq (%)
Place of birth for the foreign-born population - Israel (%)
Place of birth for the foreign-born population - Jordan (%)
Place of birth for the foreign-born population - Kuwait (%)
Place of birth for the foreign-born population - Lebanon (%)
Place of birth for the foreign-born population - Saudi Arabia (%)
Place of birth for the foreign-born population - Syria (%)
Place of birth for the foreign-born population - Turkey (%)
Place of birth for the foreign-born population - Yemen (%)
Place of birth for the foreign-born population - Other Western Asia (%)
Place of birth for the foreign-born population - Eritrea (%)
Place of birth for the foreign-born population - Ethiopia (%)
Place of birth for the foreign-born population - Kenya (%)
Place of birth for the foreign-born population - Somalia (%)
Place of birth for the foreign-born population - Uganda (%)
Place of birth for the foreign-born population - Zimbabwe (%)
Place of birth for the foreign-born population - Other Eastern Africa (%)
Place of birth for the foreign-born population - Cameroon (%)
Place of birth for the foreign-born population - Congo (%)
Place of birth for the foreign-born population - Democratic Republic of Congo (Zaire) (%)
Place of birth for the foreign-born population - Other Middle Africa (%)
Place of birth for the foreign-born population - Egypt (%)
Place of birth for the foreign-born population - Morocco (%)
Place of birth for the foreign-born population - Sudan (%)
Place of birth for the foreign-born population - Other Northern Africa (%)
Place of birth for the foreign-born population - South Africa (%)
Place of birth for the foreign-born population - Other Southern Africa (%)
Place of birth for the foreign-born population - Cabo Verde (%)
Place of birth for the foreign-born population - Ghana (%)
Place of birth for the foreign-born population - Liberia (%)
Place of birth for the foreign-born population - Nigeria (%)
Place of birth for the foreign-born population - Senegal (%)
Place of birth for the foreign-born population - Sierra Leone (%)
Place of birth for the foreign-born population - Other Western Africa (%)
Place of birth for the foreign-born population - Australia (%)
Place of birth for the foreign-born population - New Zealand (%)
Place of birth for the foreign-born population - Fiji (%)
Place of birth for the foreign-born population - Micronesia (%)
Place of birth for the foreign-born population - Bahamas (%)
Place of birth for the foreign-born population - Barbados (%)
Place of birth for the foreign-born population - Cuba (%)
Place of birth for the foreign-born population - Dominica (%)
Place of birth for the foreign-born population - Dominican Republic (%)
Place of birth for the foreign-born population - Grenada (%)
Place of birth for the foreign-born population - Haiti (%)
Place of birth for the foreign-born population - Jamaica (%)
Place of birth for the foreign-born population - St. Vincent and the Grenadines (%)
Place of birth for the foreign-born population - Trinidad and Tobago (%)
Place of birth for the foreign-born population - West Indies (%)
Place of birth for the foreign-born population - Other Caribbean (%)
Place of birth for the foreign-born population - Belize (%)
Place of birth for the foreign-born population - Costa Rica (%)
Place of birth for the foreign-born population - El Salvador (%)
Place of birth for the foreign-born population - Guatemala (%)
Place of birth for the foreign-born population - Honduras (%)
Place of birth for the foreign-born population - Mexico (%)
Place of birth for the foreign-born population - Nicaragua (%)
Place of birth for the foreign-born population - Panama (%)
Place of birth for the foreign-born population - Other Central America (%)
Place of birth for the foreign-born population - Argentina (%)
Place of birth for the foreign-born population - Bolivia (%)
Place of birth for the foreign-born population - Brazil (%)
Place of birth for the foreign-born population - Chile (%)
Place of birth for the foreign-born population - Colombia (%)
Place of birth for the foreign-born population - Ecuador (%)
Place of birth for the foreign-born population - Guyana (%)
Place of birth for the foreign-born population - Peru (%)
Place of birth for the foreign-born population - Uruguay (%)
Place of birth for the foreign-born population - Venezuela (%)
Place of birth for the foreign-born population - Other South America (%)
Place of birth for the foreign-born population - Canada (%)
Place of birth for the foreign-born population - Other Northern America (%)
Place of birth for the foreign-born population - Other (%)
Latest news about races in Hendersonville, NC collected exclusively by city-data.com from local newspapers, TV, and radio stations
According to 2022 data, the most numerous races in Hendersonville, NC are White alone (12,335 residents), Black alone (975 residents), and Hispanic (1,100 residents). 94.0% of Hendersonville residents speak English at home. 5.0% of Hendersonville, NC residents are foreign-born (2.1% born in Latin America, 1.2% born in Europe, 0.7% born in Oceania), which is 61.0% less than the foreign-born rate of 8.0% across the entire state of North Carolina.
Race distribution in Hendersonville
2000 2022
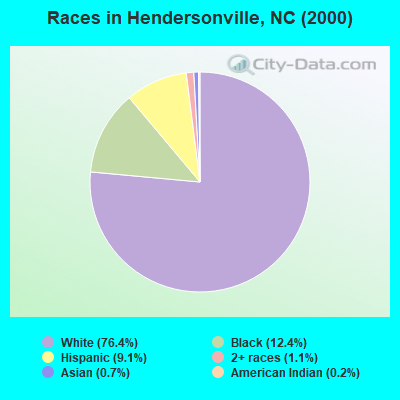
5,647,155 70.2% White alone 1,723,301 21.4% Black alone 378,963 4.7% Hispanic 112,416 1.4% Asian alone 95,333 1.2% American Indian alone 79,965 1.0% Two or more races 9,015 0.1% Other race alone 3,165 0.04% Native Hawaiian and Other
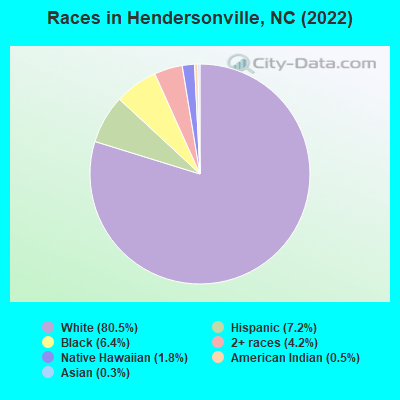
6,497,519 60.7% White alone 2,155,650 20.1% Black alone 1,114,799 10.4% Hispanic 438,061 4.1% Two or more races 341,052 3.2% Asian alone 91,758 0.9% American Indian alone 50,180 0.5% Other race alone 9,954 0.09% Native Hawaiian and Other
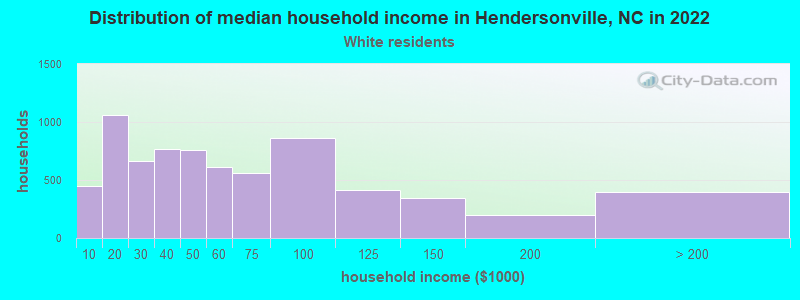
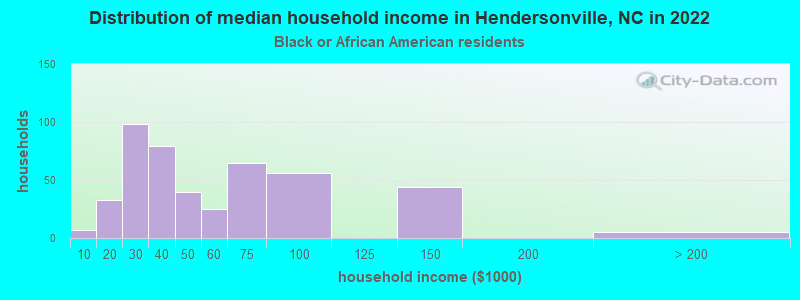
Income and house value in Hendersonville Median household income in 2022 $49,278 White non-Hispanic householders$41,770 Black householders$32,548 Hispanic or Latino race householdersMedian 2022 house value $325,635 White Non-Hispanic householders$187,288 Black or African American householders$362,273 Some other race householders$295,286 Two or more races householders$222,285 Hispanic or Latino householders
Median age by race in Hendersonville
56.9 Median age for White residents52.1 59.6 40.4 Median age for Black or African American residents43.2 36.1 23.2 Median age for American Indian / Alaska Native residents-668,604,650.5 28.8 61.3 Median age for Asian residents-672,796,934.2 -789,321,788.5 24.2 Median age for Native Hawaiian / Pacific Islander residents21.6 -666,666,666.0 36.2 Median age for Other race residents38.2 42.8 21.0 Median age for Two or more races residents12.8 33.2 56.6 Median age for White alone residents51.8 60.1 36.0 Median age for Hispanic or Latino residents38.4 29.6
Owner/renter occupied households by race in Hendersonville
House owners and renters - White residents 3,543 49.9% Owner occupied3,564 50.1% Renter occupiedHouse owners and renters - Black or African American residents 94 33.0% Owner occupied191 67.0% Renter occupiedHouse owners and renters - American Indian / Alaska Native residents 8 100.0% Owner occupiedHouse owners and renters - Asian residents 37 100.0% Owner occupiedHouse owners and renters - Native Hawaiian / Pacific Islander residents 27 100.0% Renter occupiedHouse owners and renters - Other race residents 17 10.6% Owner occupied140 89.4% Renter occupiedHouse owners and renters - Two or more races residents 59 26.4% Owner occupied165 73.6% Renter occupiedHouse owners and renters - White alone residents 3,447 49.4% Owner occupied3,529 50.6% Renter occupiedHouse owners and renters - Hispanic or Latino residents 199 33.3% Owner occupied399 66.7% Renter occupied
Language usage in Hendersonville
English speakers - Total 94.0% of residents of Hendersonville speak English at home.
3.6% of residents speak Spanish at home 318 60.0% Speak English very well212 40.0% Speak English less than very well2.4% of residents speak other language at home 242 69.9% Speak English very well104 30.1% Speak English less than very well
English speakers - Born in the United States 98.7% of residents of Hendersonville speak English at home.
0.9% of residents speak Spanish at home 71 100.0% Speak English very well0.8% of residents speak other language at home 40 62.5% Speak English very well24 37.5% Speak English less than very well
English speakers - Native, born elsewhere 56.7% of residents of Hendersonville speak English at home.
69.2% of residents speak Spanish at home 60 83.3% Speak English very well12 16.7% Speak English less than very well
English speakers - Foreign-born 44.3% of residents of Hendersonville speak English at home.
28.5% of residents speak Spanish at home 80 34.6% Speak English very well151 65.4% Speak English less than very well32.4% of residents speak other language at home 181 68.8% Speak English very well82 31.2% Speak English less than very well
White (Caucasian) - Speak only English Native:
98.6% (11,565)Foreign-born:
94.2% (256)
White (Caucasian) - Speak another language Native:
1.5% (177)Foreign-born:
31.5% (86)
Black or African American - Speak only English Native:
96.7% (862)Foreign-born:
16.7% (8)
Black or African American - Speak another language Native:
1.8% (16)Foreign-born:
100.0% (48)
Asian - Speak another language Native:
14.8% (2)Foreign-born:
63.3% (18)
Native Hawaiian / Pacific Islander - Speak another language Native:
22.6% (22)Foreign-born:
71.9% (121)
Other race - Speak only English Native:
72.6% (46)Foreign-born:
35.7% (72)
Other race - Speak another language Native:
28.4% (18)Foreign-born:
61.0% (123)
Two or more races - Speak another language Native:
20.9% (245)Foreign-born:
97.9% (61)
White alone - Speak only English Native:
98.5% (11,441)Foreign-born:
66.7% (231)
White alone - Speak another language Native:
1.4% (159)Foreign-born:
34.8% (121)
Hispanic or Latino - Speak only English Native:
77.5% (464)Foreign-born:
37.5% (121)
Hispanic or Latino - Speak another language Native:
29.4% (176)Foreign-born:
70.1% (227)
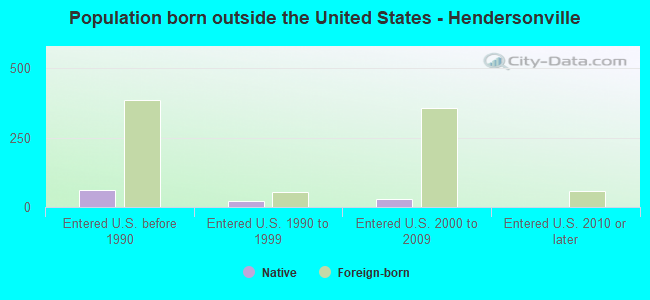
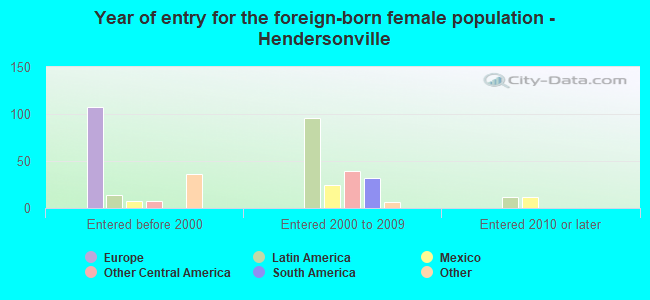
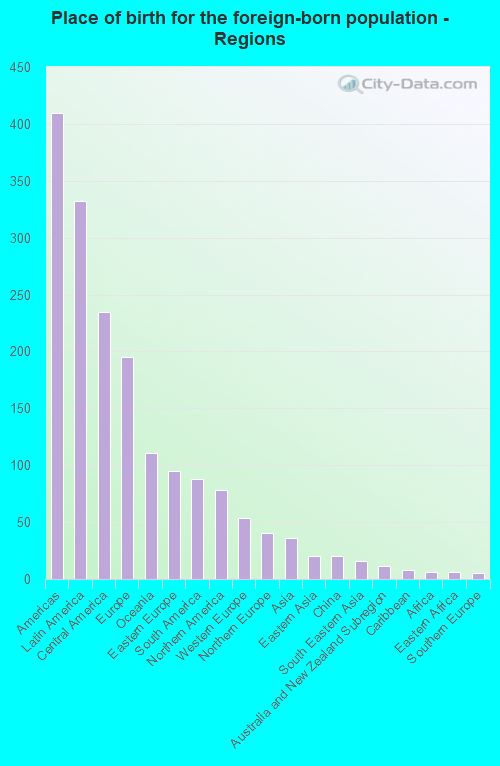
Foreign-born residents in Hendersonville 761 residents are foreign born (2.1% Latin America , 1.2% Europe , 0.7% Oceania ).
This city:
5.0%North Carolina:
8.3%
Marital status for residents in Hendersonville Marital status - White (Caucasian) population 15 years and over
Males 31.9% Never married47.7% Now married1.9% Separated6.4% Widowed12.2% DivorcedFemales 17.3% Never married43.4% Now married1.2% Separated17.8% Widowed20.2% DivorcedWomen who gave birth in the past 12 months Now married:
97.1% (127)Unmarried:
2.9% (4)
Women who did not give birth in the past 12 months Now married:
42.1% (781)Unmarried:
57.9% (1,076)
Marital status - Black or African American population 15 years and over
Males 31.0% Never married35.0% Now married1.4% Separated15.6% Widowed17.0% DivorcedFemales 61.9% Never married8.1% Now married0.0% Separated8.4% Widowed21.6% DivorcedWomen who did not give birth in the past 12 months Now married:
3.8% (7)Unmarried:
96.2% (176)
Marital status - American Indian / Alaska Native population 15 years and over
Males 50.0% Never married50.0% Now married0.0% Separated0.0% Widowed0.0% DivorcedFemales 0.0% Never married65.0% Now married0.0% Separated0.0% Widowed35.0% DivorcedWomen who did not give birth in the past 12 months Now married:
100.0% (14)Unmarried:
0.0% (0)
Marital status - Asian population 15 years and over
Males 0.0% Never married0.0% Now married0.0% Separated0.0% Widowed100.0% DivorcedFemales 0.0% Never married93.3% Now married0.0% Separated6.7% Widowed0.0% DivorcedMarital status - Native Hawaiian / Pacific Islander population 15 years and over
Males 55.9% Never married28.3% Now married0.0% Separated0.0% Widowed15.7% DivorcedFemales 0.0% Never married0.0% Now married0.0% Separated0.0% Widowed100.0% DivorcedMarital status - Other race population 15 years and over
Males 52.5% Never married47.5% Now married0.0% Separated0.0% Widowed0.0% DivorcedFemales 17.9% Never married57.7% Now married0.0% Separated0.0% Widowed24.4% DivorcedWomen who did not give birth in the past 12 months Now married:
52.2% (49)Unmarried:
47.8% (45)
Marital status - Two or more races population 15 years and over
Males 65.9% Never married25.1% Now married0.0% Separated0.0% Widowed8.9% DivorcedFemales 54.4% Never married19.8% Now married16.8% Separated0.0% Widowed9.0% DivorcedWomen who gave birth in the past 12 months Now married:
0.0% (0)Unmarried:
100.0% (7)
Women who did not give birth in the past 12 months Now married:
40.6% (181)Unmarried:
59.4% (264)
Marital status - White alone, not Hispanic / Latino population 15 years and over
Males 32.4% Never married46.8% Now married1.9% Separated6.5% Widowed12.4% DivorcedFemales 15.9% Never married44.2% Now married1.1% Separated17.8% Widowed21.0% DivorcedWomen who gave birth in the past 12 months Now married:
97.1% (133)Unmarried:
2.9% (4)
Women who did not give birth in the past 12 months Now married:
43.5% (763)Unmarried:
56.5% (993)
Marital status - Hispanic or Latino population 15 years and over
Males 30.8% Never married58.5% Now married0.0% Separated0.0% Widowed10.7% DivorcedFemales 50.3% Never married28.0% Now married1.4% Separated9.1% Widowed11.2% DivorcedWomen who did not give birth in the past 12 months Now married:
30.5% (127)Unmarried:
69.5% (291)
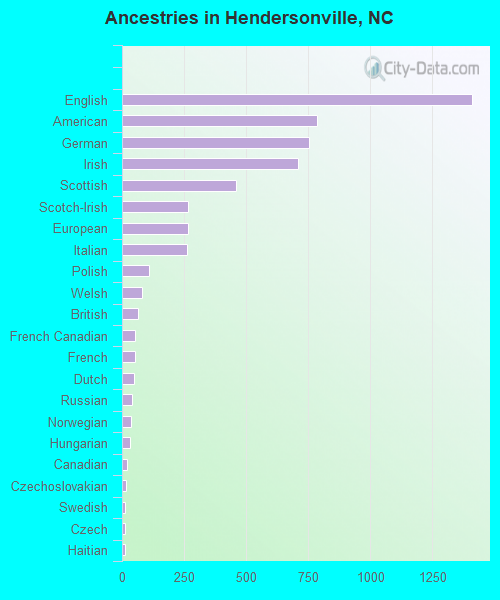
Ancestries in Hendersonville
1,408 19.3% English785 10.8% American754 10.3% German711 9.8% Irish458 6.3% Scottish266 3.6% Scotch-Irish265 3.6% European261 3.6% Italian107 1.5% Polish79 1.1% Welsh63 0.9% British53 0.7% French Canadian52 0.7% French47 0.6% Dutch41 0.6% Russian36 0.5% Norwegian34 0.5% Hungarian20 0.3% Canadian16 0.2% Czechoslovakian14 0.2% Swedish13 0.2% Czech13 0.2% Haitian10 0.1% Eastern European10 0.1% Swiss9 0.1% Northern European6 0.08% Slovak4 0.05% Portuguese4 0.05% Kenyan
Children Nativity (place of birth) in Hendersonville
Children under 6 years - Living with two parents Both parents native 255 100.0% NativeChildren under 6 years - Living with one parent Native parent 598 100.0% NativeForeign-born parent 15 100.0% NativeChildren 6 to 17 years - Living with two parents Both parents native 793 100.0% NativeBoth parents foreign-born 14 100.0% NativeChildren 6 to 17 years - Living with one parent Native parent 773 100.0% NativeForeign-born parent 38 51.0% Native37 49.0% Foreign-born
Grandparents responsible for own grandchildren in Hendersonville
Grandparents (30 to 59 years) White / Caucasian 34 56.3% Responsible for grandchildren27 43.7% Not responsible for grandchildrenTwo or more races 6 100.0% Responsible for grandchildrenWhite alone, not Hispanic / Latino 34 51.0% Responsible for grandchildren33 49.0% Not responsible for grandchildrenGrandparents (60 years and over) White / Caucasian 33 70.4% Responsible for grandchildren14 29.6% Not responsible for grandchildrenWhite alone, not Hispanic / Latino 36 70.4% Responsible for grandchildren15 29.6% Not responsible for grandchildren