Races in Harrisonburg, Virginia (VA) Detailed Stats
Data:
Races - White alone (%)
Races - White alone (% change since 2000)
Races - Black alone (%)
Races - Black alone (% change since 2000)
Races - American Indian alone (%)
Races - American Indian alone (% change since 2000)
Races - Asian alone (%)
Races - Asian alone (% change since 2000)
Races - Hispanic (%)
Races - Hispanic (% change since 2000)
Races - Native Hawaiian and Other Pacific Islander alone (%)
Races - Native Hawaiian and Other Pacific Islander alone (% change since 2000)
Races - Two or more races(%)
Races - Two or more races(% change since 2000)
Races - Other race alone (%)
Races - Other race alone (% change since 2000)
Racial diversity
Place of birth - Born in state of residence (%)
Place of birth - Born in state of residence (%) - White
Place of birth - Born in state of residence (%) - Black or African American
Place of birth - Born in state of residence (%) - Asian
Place of birth - Born in state of residence (%) - Hispanic or Latino
Place of birth - Born in state of residence (%) - American Indian and Alaska Native
Place of birth - Born in state of residence (%) - Multirace
Place of birth - Born in state of residence (%) - Other Race
Place of birth - Born in other state (%)
Place of birth - Born in other state (%) - White
Place of birth - Born in other state (%) - Black or African American
Place of birth - Born in other state (%) - Asian
Place of birth - Born in other state (%) - Hispanic or Latino
Place of birth - Born in other state (%) - American Indian and Alaska Native
Place of birth - Born in other state (%) - Multirace
Place of birth - Born in other state (%) - Other Race
Place of birth - Native, outside of US (%)
Place of birth - Native, outside of US (%) - White
Place of birth - Native, outside of US (%) - Black or African American
Place of birth - Native, outside of US (%) - Asian
Place of birth - Native, outside of US (%) - Hispanic or Latino
Place of birth - Native, outside of US (%) - American Indian and Alaska Native
Place of birth - Native, outside of US (%) - Multirace
Place of birth - Native, outside of US (%) - Other Race
Place of birth - Foreign born (%)
Place of birth - Foreign born (%) - White
Place of birth - Foreign born (%) - Black or African American
Place of birth - Foreign born (%) - Asian
Place of birth - Foreign born (%) - Hispanic or Latino
Place of birth - Foreign born (%) - American Indian and Alaska Native
Place of birth - Foreign born (%) - Multirace
Place of birth - Foreign born (%) - Other Race
Residents speaking English at home (%)
Residents speaking English at home - Born in the United States (%)
Residents speaking English at home - Native, born elsewhere (%)
Residents speaking English at home - Foreign born (%)
Residents speaking Spanish at home (%)
Residents speaking Spanish at home - Born in the United States (%)
Residents speaking Spanish at home - Native, born elsewhere (%)
Residents speaking Spanish at home - Foreign born (%)
Residents speaking other language at home (%)
Residents speaking other language at home - Born in the United States (%)
Residents speaking other language at home - Native, born elsewhere (%)
Residents speaking other language at home - Foreign born (%)
Marital status - Never married (%)
Marital status - Now married (%)
Marital status - Separated (%)
Marital status - Widowed (%)
Marital status - Divorced (%)
Ancestries Reported - Arab (%)
Ancestries Reported - Czech (%)
Ancestries Reported - Danish (%)
Ancestries Reported - Dutch (%)
Ancestries Reported - English (%)
Ancestries Reported - French (%)
Ancestries Reported - French Canadian (%)
Ancestries Reported - German (%)
Ancestries Reported - Greek (%)
Ancestries Reported - Hungarian (%)
Ancestries Reported - Irish (%)
Ancestries Reported - Italian (%)
Ancestries Reported - Lithuanian (%)
Ancestries Reported - Norwegian (%)
Ancestries Reported - Polish (%)
Ancestries Reported - Portuguese (%)
Ancestries Reported - Russian (%)
Ancestries Reported - Scotch-Irish (%)
Ancestries Reported - Scottish (%)
Ancestries Reported - Slovak (%)
Ancestries Reported - Subsaharan African (%)
Ancestries Reported - Swedish (%)
Ancestries Reported - Swiss (%)
Ancestries Reported - Ukrainian (%)
Ancestries Reported - United States (%)
Ancestries Reported - Welsh (%)
Ancestries Reported - West Indian (%)
Ancestries Reported - Other (%)
Geographical mobility - Same house 1 year ago (%)
Geographical mobility - Same house 1 year ago (%) - White
Geographical mobility - Same house 1 year ago (%) - Black or African American
Geographical mobility - Same house 1 year ago (%) - Asian
Geographical mobility - Same house 1 year ago (%) - Hispanic or Latino
Geographical mobility - Same house 1 year ago (%) - American Indian and Alaska Native
Geographical mobility - Same house 1 year ago (%) - Multirace
Geographical mobility - Same house 1 year ago (%) - Other Race
Geographical mobility - Moved within same county (%)
Geographical mobility - Moved within same county (%) - White
Geographical mobility - Moved within same county (%) - Black or African American
Geographical mobility - Moved within same county (%) - Asian
Geographical mobility - Moved within same county (%) - Hispanic or Latino
Geographical mobility - Moved within same county (%) - American Indian and Alaska Native
Geographical mobility - Moved within same county (%) - Multirace
Geographical mobility - Moved within same county (%) - Other Race
Geographical mobility - Moved from different county within same state (%)
Geographical mobility - Moved from different county within same state (%) - White
Geographical mobility - Moved from different county within same state (%) - Black or African American
Geographical mobility - Moved from different county within same state (%) - Asian
Geographical mobility - Moved from different county within same state (%) - Hispanic or Latino
Geographical mobility - Moved from different county within same state (%) - American Indian and Alaska Native
Geographical mobility - Moved from different county within same state (%) - Multirace
Geographical mobility - Moved from different county within same state (%) - Other Race
Geographical mobility - Moved from different state (%)
Geographical mobility - Moved from different state (%) - White
Geographical mobility - Moved from different state (%) - Black or African American
Geographical mobility - Moved from different state (%) - Asian
Geographical mobility - Moved from different state (%) - Hispanic or Latino
Geographical mobility - Moved from different state (%) - American Indian and Alaska Native
Geographical mobility - Moved from different state (%) - Multirace
Geographical mobility - Moved from different state (%) - Other Race
Geographical mobility - Moved from abroad (%)
Geographical mobility - Moved from abroad (%) - White
Geographical mobility - Moved from abroad (%) - Black or African American
Geographical mobility - Moved from abroad (%) - Asian
Geographical mobility - Moved from abroad (%) - Hispanic or Latino
Geographical mobility - Moved from abroad (%) - American Indian and Alaska Native
Geographical mobility - Moved from abroad (%) - Multirace
Geographical mobility - Moved from abroad (%) - Other Race
Place of birth for the foreign-born population - Ireland (%)
Place of birth for the foreign-born population - Denmark (%)
Place of birth for the foreign-born population - Norway (%)
Place of birth for the foreign-born population - Sweden (%)
Place of birth for the foreign-born population - United Kingdom (%)
Place of birth for the foreign-born population - England (%)
Place of birth for the foreign-born population - Scotland (%)
Place of birth for the foreign-born population - Other Northern Europe (%)
Place of birth for the foreign-born population - Austria (%)
Place of birth for the foreign-born population - Belgium (%)
Place of birth for the foreign-born population - France (%)
Place of birth for the foreign-born population - Germany (%)
Place of birth for the foreign-born population - Netherlands (%)
Place of birth for the foreign-born population - Switzerland (%)
Place of birth for the foreign-born population - Other Western Europe (%)
Place of birth for the foreign-born population - Greece (%)
Place of birth for the foreign-born population - Italy (%)
Place of birth for the foreign-born population - Portugal (%)
Place of birth for the foreign-born population - Spain (%)
Place of birth for the foreign-born population - Other Southern Europe (%)
Place of birth for the foreign-born population - Albania (%)
Place of birth for the foreign-born population - Belarus (%)
Place of birth for the foreign-born population - Bosnia and Herzegovina (%)
Place of birth for the foreign-born population - Bulgaria (%)
Place of birth for the foreign-born population - Croatia (%)
Place of birth for the foreign-born population - Czechoslovakia (%)
Place of birth for the foreign-born population - Hungary (%)
Place of birth for the foreign-born population - Latvia (%)
Place of birth for the foreign-born population - Lithuania (%)
Place of birth for the foreign-born population - North Macedonia (Macedonia) (%)
Place of birth for the foreign-born population - Moldova (%)
Place of birth for the foreign-born population - Poland (%)
Place of birth for the foreign-born population - Romania (%)
Place of birth for the foreign-born population - Russia (%)
Place of birth for the foreign-born population - Serbia (%)
Place of birth for the foreign-born population - Ukraine (%)
Place of birth for the foreign-born population - Other Eastern Europe (%)
Place of birth for the foreign-born population - China (%)
Place of birth for the foreign-born population - Hong Kong (%)
Place of birth for the foreign-born population - Taiwan (%)
Place of birth for the foreign-born population - Japan (%)
Place of birth for the foreign-born population - Korea (%)
Place of birth for the foreign-born population - Other Eastern Asia (%)
Place of birth for the foreign-born population - Afghanistan (%)
Place of birth for the foreign-born population - Bangladesh (%)
Place of birth for the foreign-born population - India (%)
Place of birth for the foreign-born population - Iran (%)
Place of birth for the foreign-born population - Kazakhstan (%)
Place of birth for the foreign-born population - Nepal (%)
Place of birth for the foreign-born population - Pakistan (%)
Place of birth for the foreign-born population - Sri Lanka (%)
Place of birth for the foreign-born population - Uzbekistan (%)
Place of birth for the foreign-born population - Other South Central Asia (%)
Place of birth for the foreign-born population - Burma (%)
Place of birth for the foreign-born population - Cambodia (%)
Place of birth for the foreign-born population - Indonesia (%)
Place of birth for the foreign-born population - Laos (%)
Place of birth for the foreign-born population - Malaysia (%)
Place of birth for the foreign-born population - Philippines (%)
Place of birth for the foreign-born population - Singapore (%)
Place of birth for the foreign-born population - Thailand (%)
Place of birth for the foreign-born population - Vietnam (%)
Place of birth for the foreign-born population - Other South Eastern Asia (%)
Place of birth for the foreign-born population - Armenia (%)
Place of birth for the foreign-born population - Iraq (%)
Place of birth for the foreign-born population - Israel (%)
Place of birth for the foreign-born population - Jordan (%)
Place of birth for the foreign-born population - Kuwait (%)
Place of birth for the foreign-born population - Lebanon (%)
Place of birth for the foreign-born population - Saudi Arabia (%)
Place of birth for the foreign-born population - Syria (%)
Place of birth for the foreign-born population - Turkey (%)
Place of birth for the foreign-born population - Yemen (%)
Place of birth for the foreign-born population - Other Western Asia (%)
Place of birth for the foreign-born population - Eritrea (%)
Place of birth for the foreign-born population - Ethiopia (%)
Place of birth for the foreign-born population - Kenya (%)
Place of birth for the foreign-born population - Somalia (%)
Place of birth for the foreign-born population - Uganda (%)
Place of birth for the foreign-born population - Zimbabwe (%)
Place of birth for the foreign-born population - Other Eastern Africa (%)
Place of birth for the foreign-born population - Cameroon (%)
Place of birth for the foreign-born population - Congo (%)
Place of birth for the foreign-born population - Democratic Republic of Congo (Zaire) (%)
Place of birth for the foreign-born population - Other Middle Africa (%)
Place of birth for the foreign-born population - Egypt (%)
Place of birth for the foreign-born population - Morocco (%)
Place of birth for the foreign-born population - Sudan (%)
Place of birth for the foreign-born population - Other Northern Africa (%)
Place of birth for the foreign-born population - South Africa (%)
Place of birth for the foreign-born population - Other Southern Africa (%)
Place of birth for the foreign-born population - Cabo Verde (%)
Place of birth for the foreign-born population - Ghana (%)
Place of birth for the foreign-born population - Liberia (%)
Place of birth for the foreign-born population - Nigeria (%)
Place of birth for the foreign-born population - Senegal (%)
Place of birth for the foreign-born population - Sierra Leone (%)
Place of birth for the foreign-born population - Other Western Africa (%)
Place of birth for the foreign-born population - Australia (%)
Place of birth for the foreign-born population - New Zealand (%)
Place of birth for the foreign-born population - Fiji (%)
Place of birth for the foreign-born population - Micronesia (%)
Place of birth for the foreign-born population - Bahamas (%)
Place of birth for the foreign-born population - Barbados (%)
Place of birth for the foreign-born population - Cuba (%)
Place of birth for the foreign-born population - Dominica (%)
Place of birth for the foreign-born population - Dominican Republic (%)
Place of birth for the foreign-born population - Grenada (%)
Place of birth for the foreign-born population - Haiti (%)
Place of birth for the foreign-born population - Jamaica (%)
Place of birth for the foreign-born population - St. Vincent and the Grenadines (%)
Place of birth for the foreign-born population - Trinidad and Tobago (%)
Place of birth for the foreign-born population - West Indies (%)
Place of birth for the foreign-born population - Other Caribbean (%)
Place of birth for the foreign-born population - Belize (%)
Place of birth for the foreign-born population - Costa Rica (%)
Place of birth for the foreign-born population - El Salvador (%)
Place of birth for the foreign-born population - Guatemala (%)
Place of birth for the foreign-born population - Honduras (%)
Place of birth for the foreign-born population - Mexico (%)
Place of birth for the foreign-born population - Nicaragua (%)
Place of birth for the foreign-born population - Panama (%)
Place of birth for the foreign-born population - Other Central America (%)
Place of birth for the foreign-born population - Argentina (%)
Place of birth for the foreign-born population - Bolivia (%)
Place of birth for the foreign-born population - Brazil (%)
Place of birth for the foreign-born population - Chile (%)
Place of birth for the foreign-born population - Colombia (%)
Place of birth for the foreign-born population - Ecuador (%)
Place of birth for the foreign-born population - Guyana (%)
Place of birth for the foreign-born population - Peru (%)
Place of birth for the foreign-born population - Uruguay (%)
Place of birth for the foreign-born population - Venezuela (%)
Place of birth for the foreign-born population - Other South America (%)
Place of birth for the foreign-born population - Canada (%)
Place of birth for the foreign-born population - Other Northern America (%)
Place of birth for the foreign-born population - Other (%)
Latest news about races in Harrisonburg, VA collected exclusively by city-data.com from local newspapers, TV, and radio stations
According to 2022 data, the most numerous races in Harrisonburg, VA are White alone (32,904 residents), Black alone (2,194 residents), and Hispanic (11,920 residents). 71.7% of Harrisonburg residents speak English at home. 17.5% of Harrisonburg, VA residents are foreign-born (9.4% born in Latin America, 4.3% born in Asia, 1.9% born in Africa), which is 31.5% greater than the foreign-born rate of 12.0% across the entire state of Virginia.
Race distribution in Harrisonburg
2000 2022
4,965,637 70.2% White alone 1,376,378 19.4% Black alone 329,540 4.7% Hispanic 259,277 3.7% Asian alone 114,022 1.6% Two or more races 18,596 0.3% American Indian alone 11,685 0.2% Other race alone 3,380 0.05% Native Hawaiian and Other
5,095,130 58.7% White alone 1,594,785 18.4% Black alone 905,750 10.4% Hispanic 602,881 6.9% Asian alone 406,047 4.7% Two or more races 60,419 0.7% Other race alone 11,738 0.1% American Indian alone 6,869 0.08% Native Hawaiian and Other
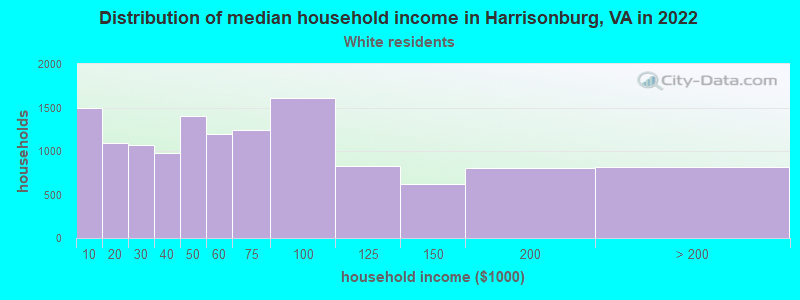
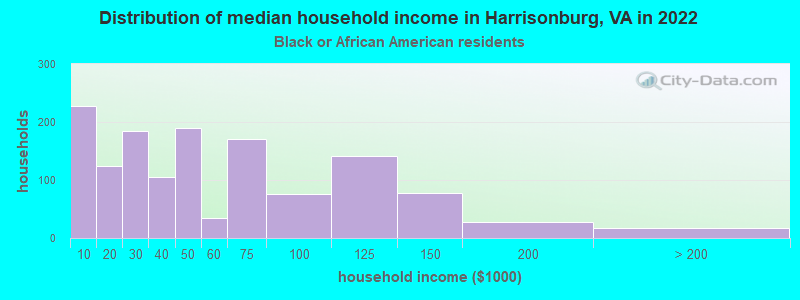
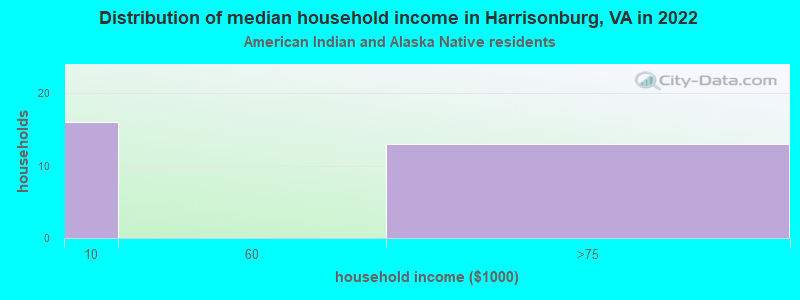
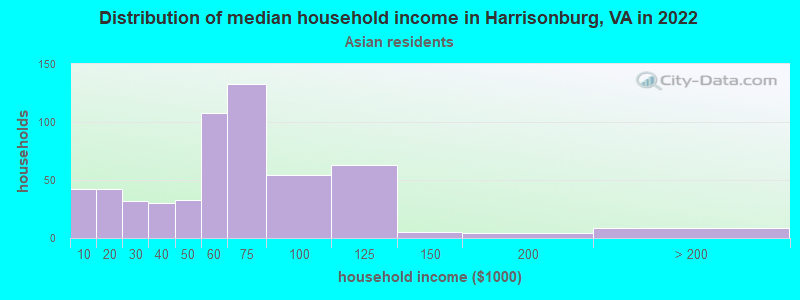
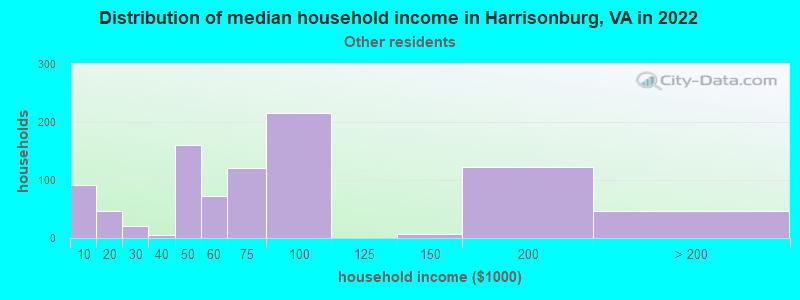
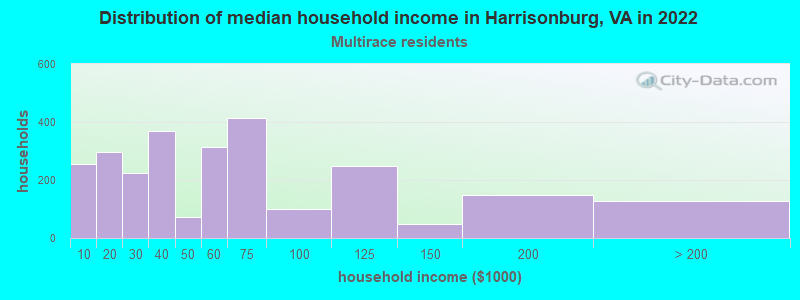
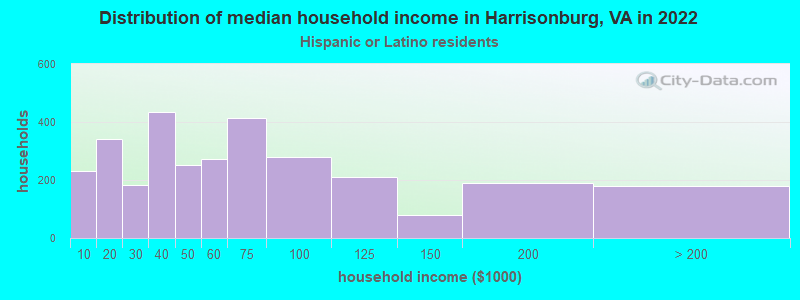
Income and house value in Harrisonburg Median household income in 2022 $55,886 White non-Hispanic householders$25,420 Black householders$57,675 Asian householders$59,495 Some other race householders$83,291 Two or more races householders$46,149 Hispanic or Latino race householdersMedian 2022 house value $328,384 White Non-Hispanic householders$239,353 Black or African American householders $354,275 Asian householders$232,484 Some other race householders$241,202 Two or more races householders$228,257 Hispanic or Latino householders
Median age by race in Harrisonburg
25.9 Median age for White residents26.0 24.7 18.0 Median age for Black or African American residents18.8 21.8 21.3 Median age for American Indian / Alaska Native residents16.8 22.7 36.2 Median age for Asian residents31.4 30.6 -611,955,419.9 Median age for Native Hawaiian / Pacific Islander residents-666,666,666.0 -666,666,666.0 24.8 Median age for Other race residents24.5 25.1 28.7 Median age for Two or more races residents33.2 24.7 25.2 Median age for White alone residents25.4 24.0 28.6 Median age for Hispanic or Latino residents31.6 30.4
Owner/renter occupied households by race in Harrisonburg
House owners and renters - White residents 5,204 39.6% Owner occupied7,932 60.4% Renter occupiedHouse owners and renters - Black or African American residents 191 14.6% Owner occupied1,117 85.4% Renter occupiedHouse owners and renters - American Indian / Alaska Native residents 9 31.6% Owner occupied19 68.4% Renter occupiedHouse owners and renters - Asian residents 321 55.5% Owner occupied257 44.5% Renter occupiedHouse owners and renters - Other race residents 411 38.8% Owner occupied649 61.2% Renter occupiedHouse owners and renters - Two or more races residents 1,261 32.6% Owner occupied2,612 67.4% Renter occupiedHouse owners and renters - White alone residents 4,837 39.7% Owner occupied7,352 60.3% Renter occupiedHouse owners and renters - Hispanic or Latino residents 1,034 24.7% Owner occupied3,151 75.3% Renter occupied
Language usage in Harrisonburg
English speakers - Total 71.7% of residents of Harrisonburg speak English at home.
21.0% of residents speak Spanish at home 4,618 43.7% Speak English very well5,944 56.3% Speak English less than very well11.5% of residents speak other language at home 3,185 55.3% Speak English very well2,578 44.7% Speak English less than very well
English speakers - Born in the United States 89.9% of residents of Harrisonburg speak English at home.
8.5% of residents speak Spanish at home 1,272 87.9% Speak English very well175 12.1% Speak English less than very well3.4% of residents speak other language at home 554 95.4% Speak English very well27 4.6% Speak English less than very well
English speakers - Native, born elsewhere 28.6% of residents of Harrisonburg speak English at home.
53.8% of residents speak Spanish at home 555 31.9% Speak English very well1,185 68.1% Speak English less than very well6.2% of residents speak other language at home 202 100.0% Speak English very well
English speakers - Foreign-born 6.2% of residents of Harrisonburg speak English at home.
59.4% of residents speak Spanish at home 815 16.1% Speak English very well4,246 83.9% Speak English less than very well40.0% of residents speak other language at home 1,599 47.0% Speak English very well1,806 53.0% Speak English less than very well
White (Caucasian) - Speak only English Native:
93.8% (29,201)Foreign-born:
8.2% (187)
White (Caucasian) - Speak another language Native:
5.8% (1,799)Foreign-born:
94.2% (2,138)
Black or African American - Speak only English Native:
89.9% (2,291)Foreign-born:
10.1% (128)
Black or African American - Speak another language Native:
10.7% (273)Foreign-born:
92.6% (1,170)
American Indian / Alaska Native - Speak another language Native:
77.6% (74)Foreign-born:
100.0% (145)
Asian - Speak only English Native:
63.7% (408)Foreign-born:
16.0% (163)
Asian - Speak another language Native:
34.0% (218)Foreign-born:
84.2% (860)
Other race - Speak only English Native:
38.7% (571)Foreign-born:
6.2% (138)
Other race - Speak another language Native:
60.1% (887)Foreign-born:
93.3% (2,061)
Two or more races - Speak only English Native:
57.3% (3,056)Foreign-born:
2.0% (50)
Two or more races - Speak another language Native:
46.4% (2,475)Foreign-born:
98.6% (2,452)
White alone - Speak only English Native:
96.3% (28,790)Foreign-born:
15.1% (284)
White alone - Speak another language Native:
4.3% (1,276)Foreign-born:
100.0% (1,881)
Hispanic or Latino - Speak only English Native:
23.0% (1,388)Foreign-born:
4.5% (223)
Hispanic or Latino - Speak another language Native:
79.0% (4,756)Foreign-born:
95.7% (4,694)
Foreign-born residents in Harrisonburg 9,232 residents are foreign born (9.4% Latin America , 4.3% Asia , 1.9% Africa ).
This city:
17.5%Virginia:
12.6%
Marital status for residents in Harrisonburg Marital status - White (Caucasian) population 15 years and over
Males 57.0% Never married32.9% Now married1.9% Separated1.3% Widowed6.9% DivorcedFemales 56.7% Never married26.6% Now married2.3% Separated5.4% Widowed8.9% DivorcedWomen who gave birth in the past 12 months Now married:
65.8% (136)Unmarried:
34.2% (71)
Women who did not give birth in the past 12 months Now married:
20.7% (2,450)Unmarried:
79.3% (9,411)
Marital status - Black or African American population 15 years and over
Males 52.9% Never married35.8% Now married1.5% Separated0.0% Widowed9.8% DivorcedFemales 70.2% Never married15.0% Now married1.5% Separated3.3% Widowed10.0% DivorcedWomen who did not give birth in the past 12 months Now married:
11.8% (137)Unmarried:
88.2% (1,028)
Marital status - American Indian / Alaska Native population 15 years and over
Males 80.5% Never married19.5% Now married0.0% Separated0.0% Widowed0.0% DivorcedFemales 51.7% Never married48.3% Now married0.0% Separated0.0% Widowed0.0% DivorcedWomen who gave birth in the past 12 months Now married:
100.0% (5)Unmarried:
0.0% (0)
Women who did not give birth in the past 12 months Now married:
66.1% (39)Unmarried:
33.9% (20)
Marital status - Asian population 15 years and over
Males 54.9% Never married34.1% Now married1.5% Separated0.0% Widowed9.5% DivorcedFemales 53.7% Never married37.1% Now married0.0% Separated3.6% Widowed5.5% DivorcedWomen who gave birth in the past 12 months Now married:
100.0% (26)Unmarried:
0.0% (0)
Women who did not give birth in the past 12 months Now married:
23.1% (140)Unmarried:
76.9% (466)
Marital status - Other race population 15 years and over
Males 66.8% Never married24.4% Now married2.9% Separated0.0% Widowed5.9% DivorcedFemales 66.8% Never married23.9% Now married6.1% Separated0.0% Widowed3.2% DivorcedWomen who gave birth in the past 12 months Now married:
59.6% (45)Unmarried:
40.4% (30)
Women who did not give birth in the past 12 months Now married:
26.5% (324)Unmarried:
73.5% (899)
Marital status - Two or more races population 15 years and over
Males 58.2% Never married30.9% Now married2.6% Separated0.0% Widowed8.3% DivorcedFemales 60.5% Never married21.3% Now married1.8% Separated3.3% Widowed13.1% DivorcedWomen who gave birth in the past 12 months Now married:
100.0% (48)Unmarried:
0.0% (0)
Women who did not give birth in the past 12 months Now married:
19.7% (456)Unmarried:
80.3% (1,859)
Marital status - White alone, not Hispanic / Latino population 15 years and over
Males 57.6% Never married32.2% Now married2.1% Separated1.4% Widowed6.7% DivorcedFemales 57.5% Never married25.6% Now married2.1% Separated5.8% Widowed8.9% DivorcedWomen who gave birth in the past 12 months Now married:
54.7% (73)Unmarried:
45.3% (60)
Women who did not give birth in the past 12 months Now married:
19.8% (2,253)Unmarried:
80.2% (9,101)
Marital status - Hispanic or Latino population 15 years and over
Males 54.1% Never married35.0% Now married1.7% Separated0.0% Widowed9.3% DivorcedFemales 56.6% Never married30.0% Now married4.3% Separated0.6% Widowed8.5% DivorcedWomen who gave birth in the past 12 months Now married:
79.7% (154)Unmarried:
20.3% (39)
Women who did not give birth in the past 12 months Now married:
25.8% (808)Unmarried:
74.2% (2,326)
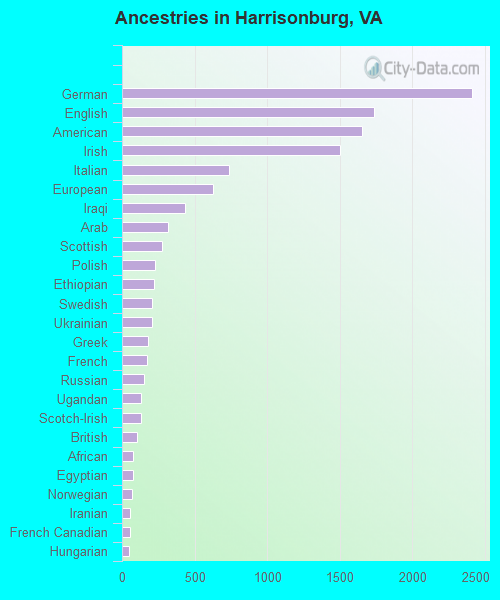
Ancestries in Harrisonburg
2,408 9.9% German1,739 7.1% English1,651 6.8% American1,501 6.1% Irish736 3.0% Italian625 2.6% European435 1.8% Iraqi316 1.3% Arab274 1.1% Scottish227 0.9% Polish221 0.9% Ethiopian207 0.8% Swedish206 0.8% Ukrainian180 0.7% Greek174 0.7% French150 0.6% Russian134 0.5% Ugandan133 0.5% Scotch-Irish100 0.4% British76 0.3% African74 0.3% Egyptian71 0.3% Norwegian52 0.2% Iranian52 0.2% French Canadian51 0.2% Hungarian46 0.2% Yugoslavian45 0.2% Canadian43 0.2% Nigerian41 0.2% Bermudan39 0.2% Scandinavian35 0.1% Eastern European33 0.1% Slovak33 0.1% Danish26 0.1% Sudanese25 0.1% Welsh25 0.1% Jamaican23 0.09% Kenyan23 0.09% Syrian19 0.08% Swiss16 0.07% Northern European15 0.06% Dutch14 0.06% Brazilian9 0.04% Serbian8 0.03% Pennsylvania German8 0.03% Romanian8 0.03% Ghanaian7 0.03% Barbadian7 0.03% Lebanese6 0.02% Latvian5 0.02% Finnish4 0.02% Armenian4 0.02% Austrian3 0.01% Guyanese3 0.01% British West Indian
Geographical mobility in Harrisonburg Same house 1 year ago 25,565 72.0% White (Caucasian)2,874 74.7% Black or African American206 96.1% American Indian / Alaska Native1,135 66.5% Asian3,511 85.6% Other race7,290 65.9% Two or more races23,468 71.2% White alone, not Hispanic / Latino8,954 81.0% Hispanic or LatinoMoved within same county 2,591 7.3% White / Caucasian180 4.7% Black or African American97 5.7% Asian189 4.6% Other race58 0.5% Two or more races2,366 7.2% White alone, not Hispanic / Latino545 4.9% Hispanic or LatinoMoved within same state 4,676 13.2% White / Caucasian620 16.1% Black or African American281 16.5% Asian173 4.2% Other race912 8.2% Two or more races5,002 15.2% White alone, not Hispanic / Latino1,001 9.0% Hispanic or LatinoMoved from different state 1,053 3.0% White / Caucasian25 0.7% Black or African American172 10.1% Asian84 2.1% Other race313 2.8% Two or more races1,129 3.4% White alone, not Hispanic / Latino282 2.5% Hispanic or LatinoMoved from abroad 207 0.6% White198 5.1% Black or African American36 2.1% Asian142 3.5% Other race181 1.6% Two or more races195 0.6% White alone, not Hispanic / Latino297 2.7% Hispanic or Latino
Children Nativity (place of birth) in Harrisonburg
Children under 6 years - Living with two parents Both parents native 737 99.9% Native0 0.1% Foreign-bornBoth parents foreign-born 660 91.8% Native59 8.2% Foreign-bornOne native, one foreign-born parent 284 100.0% NativeChildren under 6 years - Living with one parent Native parent 561 92.6% Native45 7.4% Foreign-bornForeign-born parent 443 93.8% Native29 6.2% Foreign-bornChildren 6 to 17 years - Living with two parents Both parents native 1,766 100.0% NativeBoth parents foreign-born 420 40.3% Native621 59.7% Foreign-bornOne native, one foreign-born parent 275 91.1% Native27 8.9% Foreign-bornChildren 6 to 17 years - Living with one parent Native parent 768 100.0% NativeForeign-born parent 1,135 56.7% Native866 43.3% Foreign-born
Grandparents responsible for own grandchildren in Harrisonburg
Grandparents (30 to 59 years) White / Caucasian 2 0.6% Responsible for grandchildren267 99.4% Not responsible for grandchildrenBlack or African American 8 100.0% Not responsible for grandchildrenAmerican Indian / Alaska Native 24 100.0% Responsible for grandchildrenOther race 132 95.6% Responsible for grandchildren6 4.4% Not responsible for grandchildrenTwo or more races 90 100.0% Not responsible for grandchildrenWhite alone, not Hispanic / Latino 2 1.0% Responsible for grandchildren173 99.0% Not responsible for grandchildrenHispanic or Latino 157 41.9% Responsible for grandchildren218 58.1% Not responsible for grandchildrenGrandparents (60 years and over) White / Caucasian 70 60.9% Responsible for grandchildren45 39.1% Not responsible for grandchildrenBlack or African American 8 100.0% Not responsible for grandchildrenTwo or more races 54 100.0% Not responsible for grandchildrenWhite alone, not Hispanic / Latino 63 57.3% Responsible for grandchildren47 42.7% Not responsible for grandchildrenHispanic or Latino 5 9.0% Responsible for grandchildren50 91.0% Not responsible for grandchildren