Races in Harlingen, Texas (TX) Detailed Stats
Data:
Races - White alone (%)
Races - White alone (% change since 2000)
Races - Black alone (%)
Races - Black alone (% change since 2000)
Races - American Indian alone (%)
Races - American Indian alone (% change since 2000)
Races - Asian alone (%)
Races - Asian alone (% change since 2000)
Races - Hispanic (%)
Races - Hispanic (% change since 2000)
Races - Native Hawaiian and Other Pacific Islander alone (%)
Races - Native Hawaiian and Other Pacific Islander alone (% change since 2000)
Races - Two or more races(%)
Races - Two or more races(% change since 2000)
Races - Other race alone (%)
Races - Other race alone (% change since 2000)
Racial diversity
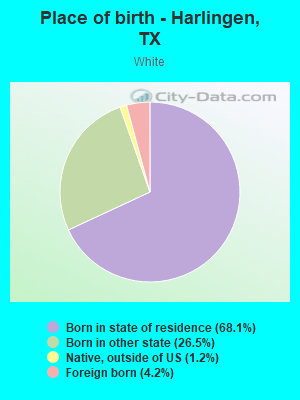
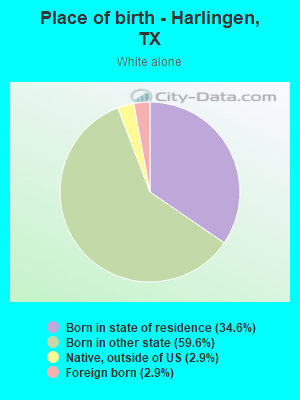
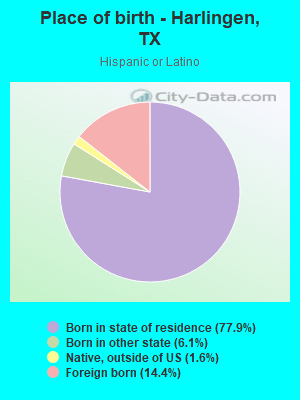
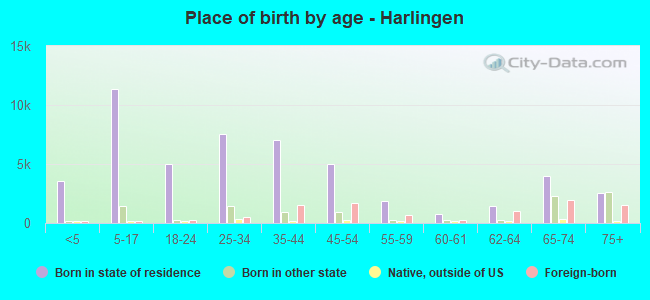
Place of birth - Born in state of residence (%)
Place of birth - Born in state of residence (%) - White
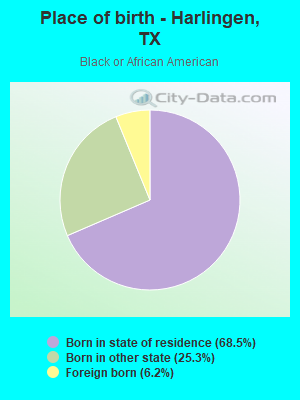
Place of birth - Born in state of residence (%) - Black or African American
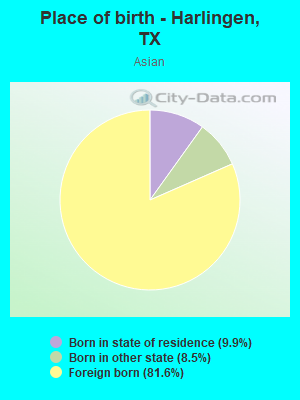
Place of birth - Born in state of residence (%) - Asian
Place of birth - Born in state of residence (%) - Hispanic or Latino
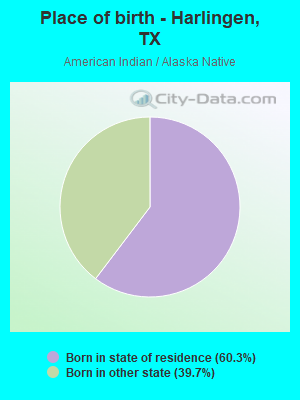
Place of birth - Born in state of residence (%) - American Indian and Alaska Native
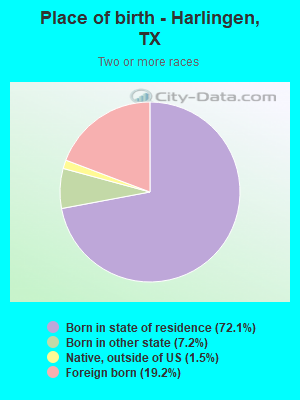
Place of birth - Born in state of residence (%) - Multirace
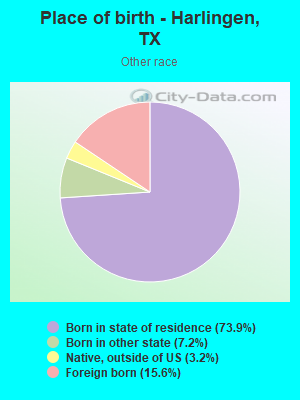
Place of birth - Born in state of residence (%) - Other Race
Place of birth - Born in other state (%)
Place of birth - Born in other state (%) - White
Place of birth - Born in other state (%) - Black or African American
Place of birth - Born in other state (%) - Asian
Place of birth - Born in other state (%) - Hispanic or Latino
Place of birth - Born in other state (%) - American Indian and Alaska Native
Place of birth - Born in other state (%) - Multirace
Place of birth - Born in other state (%) - Other Race
Place of birth - Native, outside of US (%)
Place of birth - Native, outside of US (%) - White
Place of birth - Native, outside of US (%) - Black or African American
Place of birth - Native, outside of US (%) - Asian
Place of birth - Native, outside of US (%) - Hispanic or Latino
Place of birth - Native, outside of US (%) - American Indian and Alaska Native
Place of birth - Native, outside of US (%) - Multirace
Place of birth - Native, outside of US (%) - Other Race
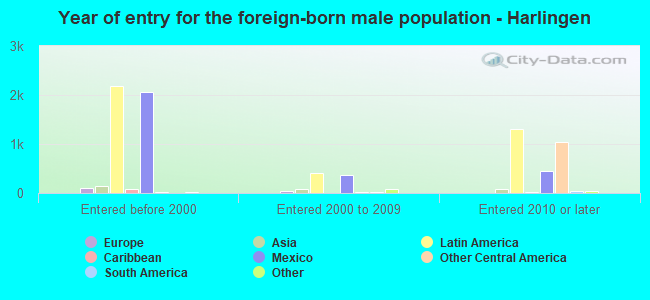
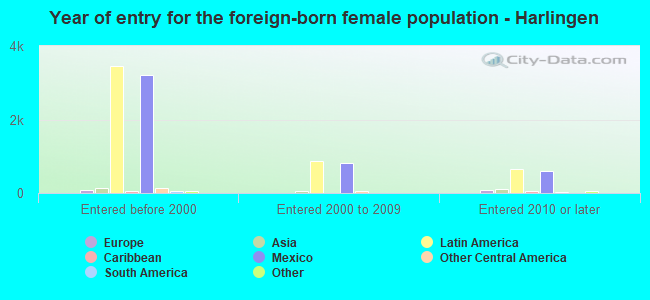
Place of birth - Foreign born (%)
Place of birth - Foreign born (%) - White
Place of birth - Foreign born (%) - Black or African American
Place of birth - Foreign born (%) - Asian
Place of birth - Foreign born (%) - Hispanic or Latino
Place of birth - Foreign born (%) - American Indian and Alaska Native
Place of birth - Foreign born (%) - Multirace
Place of birth - Foreign born (%) - Other Race
Residents speaking English at home (%)
Residents speaking English at home - Born in the United States (%)
Residents speaking English at home - Native, born elsewhere (%)
Residents speaking English at home - Foreign born (%)
Residents speaking Spanish at home (%)
Residents speaking Spanish at home - Born in the United States (%)
Residents speaking Spanish at home - Native, born elsewhere (%)
Residents speaking Spanish at home - Foreign born (%)
Residents speaking other language at home (%)
Residents speaking other language at home - Born in the United States (%)
Residents speaking other language at home - Native, born elsewhere (%)
Residents speaking other language at home - Foreign born (%)
Marital status - Never married (%)
Marital status - Now married (%)
Marital status - Separated (%)
Marital status - Widowed (%)
Marital status - Divorced (%)
Ancestries Reported - Arab (%)
Ancestries Reported - Czech (%)
Ancestries Reported - Danish (%)
Ancestries Reported - Dutch (%)
Ancestries Reported - English (%)
Ancestries Reported - French (%)
Ancestries Reported - French Canadian (%)
Ancestries Reported - German (%)
Ancestries Reported - Greek (%)
Ancestries Reported - Hungarian (%)
Ancestries Reported - Irish (%)
Ancestries Reported - Italian (%)
Ancestries Reported - Lithuanian (%)
Ancestries Reported - Norwegian (%)
Ancestries Reported - Polish (%)
Ancestries Reported - Portuguese (%)
Ancestries Reported - Russian (%)
Ancestries Reported - Scotch-Irish (%)
Ancestries Reported - Scottish (%)
Ancestries Reported - Slovak (%)
Ancestries Reported - Subsaharan African (%)
Ancestries Reported - Swedish (%)
Ancestries Reported - Swiss (%)
Ancestries Reported - Ukrainian (%)
Ancestries Reported - United States (%)
Ancestries Reported - Welsh (%)
Ancestries Reported - West Indian (%)
Ancestries Reported - Other (%)
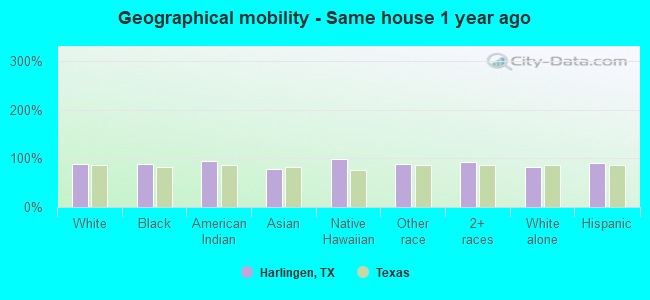
Geographical mobility - Same house 1 year ago (%)
Geographical mobility - Same house 1 year ago (%) - White
Geographical mobility - Same house 1 year ago (%) - Black or African American
Geographical mobility - Same house 1 year ago (%) - Asian
Geographical mobility - Same house 1 year ago (%) - Hispanic or Latino
Geographical mobility - Same house 1 year ago (%) - American Indian and Alaska Native
Geographical mobility - Same house 1 year ago (%) - Multirace
Geographical mobility - Same house 1 year ago (%) - Other Race
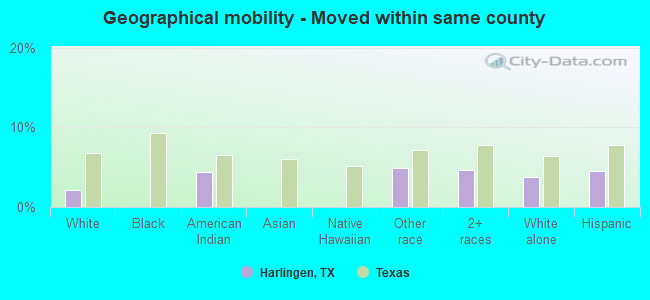
Geographical mobility - Moved within same county (%)
Geographical mobility - Moved within same county (%) - White
Geographical mobility - Moved within same county (%) - Black or African American
Geographical mobility - Moved within same county (%) - Asian
Geographical mobility - Moved within same county (%) - Hispanic or Latino
Geographical mobility - Moved within same county (%) - American Indian and Alaska Native
Geographical mobility - Moved within same county (%) - Multirace
Geographical mobility - Moved within same county (%) - Other Race
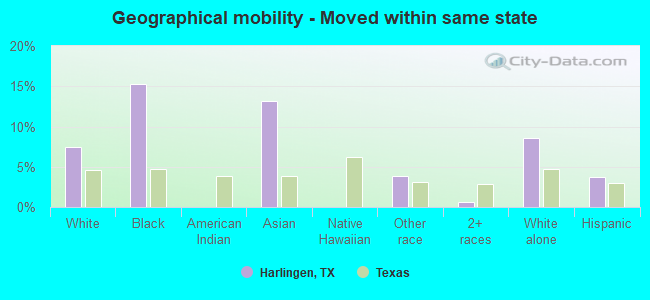
Geographical mobility - Moved from different county within same state (%)
Geographical mobility - Moved from different county within same state (%) - White
Geographical mobility - Moved from different county within same state (%) - Black or African American
Geographical mobility - Moved from different county within same state (%) - Asian
Geographical mobility - Moved from different county within same state (%) - Hispanic or Latino
Geographical mobility - Moved from different county within same state (%) - American Indian and Alaska Native
Geographical mobility - Moved from different county within same state (%) - Multirace
Geographical mobility - Moved from different county within same state (%) - Other Race
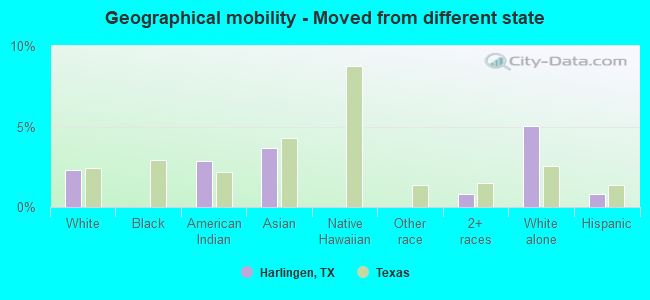
Geographical mobility - Moved from different state (%)
Geographical mobility - Moved from different state (%) - White
Geographical mobility - Moved from different state (%) - Black or African American
Geographical mobility - Moved from different state (%) - Asian
Geographical mobility - Moved from different state (%) - Hispanic or Latino
Geographical mobility - Moved from different state (%) - American Indian and Alaska Native
Geographical mobility - Moved from different state (%) - Multirace
Geographical mobility - Moved from different state (%) - Other Race
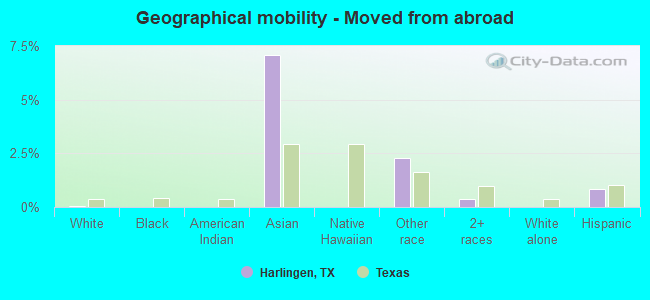
Geographical mobility - Moved from abroad (%)
Geographical mobility - Moved from abroad (%) - White
Geographical mobility - Moved from abroad (%) - Black or African American
Geographical mobility - Moved from abroad (%) - Asian
Geographical mobility - Moved from abroad (%) - Hispanic or Latino
Geographical mobility - Moved from abroad (%) - American Indian and Alaska Native
Geographical mobility - Moved from abroad (%) - Multirace
Geographical mobility - Moved from abroad (%) - Other Race
Place of birth for the foreign-born population - Ireland (%)
Place of birth for the foreign-born population - Denmark (%)
Place of birth for the foreign-born population - Norway (%)
Place of birth for the foreign-born population - Sweden (%)
Place of birth for the foreign-born population - United Kingdom (%)
Place of birth for the foreign-born population - England (%)
Place of birth for the foreign-born population - Scotland (%)
Place of birth for the foreign-born population - Other Northern Europe (%)
Place of birth for the foreign-born population - Austria (%)
Place of birth for the foreign-born population - Belgium (%)
Place of birth for the foreign-born population - France (%)
Place of birth for the foreign-born population - Germany (%)
Place of birth for the foreign-born population - Netherlands (%)
Place of birth for the foreign-born population - Switzerland (%)
Place of birth for the foreign-born population - Other Western Europe (%)
Place of birth for the foreign-born population - Greece (%)
Place of birth for the foreign-born population - Italy (%)
Place of birth for the foreign-born population - Portugal (%)
Place of birth for the foreign-born population - Spain (%)
Place of birth for the foreign-born population - Other Southern Europe (%)
Place of birth for the foreign-born population - Albania (%)
Place of birth for the foreign-born population - Belarus (%)
Place of birth for the foreign-born population - Bosnia and Herzegovina (%)
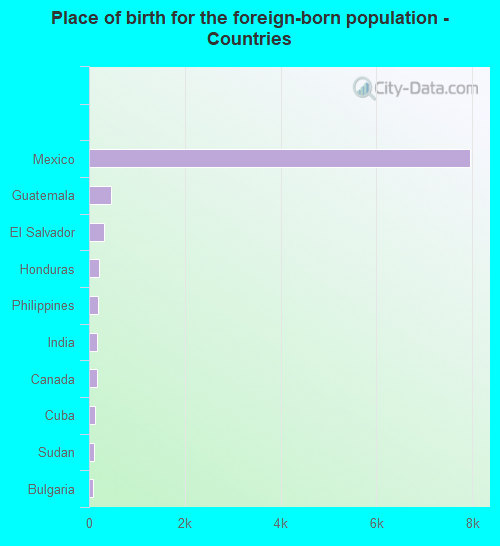
Place of birth for the foreign-born population - Bulgaria (%)
Place of birth for the foreign-born population - Croatia (%)
Place of birth for the foreign-born population - Czechoslovakia (%)
Place of birth for the foreign-born population - Hungary (%)
Place of birth for the foreign-born population - Latvia (%)
Place of birth for the foreign-born population - Lithuania (%)
Place of birth for the foreign-born population - North Macedonia (Macedonia) (%)
Place of birth for the foreign-born population - Moldova (%)
Place of birth for the foreign-born population - Poland (%)
Place of birth for the foreign-born population - Romania (%)
Place of birth for the foreign-born population - Russia (%)
Place of birth for the foreign-born population - Serbia (%)
Place of birth for the foreign-born population - Ukraine (%)
Place of birth for the foreign-born population - Other Eastern Europe (%)
Place of birth for the foreign-born population - China (%)
Place of birth for the foreign-born population - Hong Kong (%)
Place of birth for the foreign-born population - Taiwan (%)
Place of birth for the foreign-born population - Japan (%)
Place of birth for the foreign-born population - Korea (%)
Place of birth for the foreign-born population - Other Eastern Asia (%)
Place of birth for the foreign-born population - Afghanistan (%)
Place of birth for the foreign-born population - Bangladesh (%)
Place of birth for the foreign-born population - India (%)
Place of birth for the foreign-born population - Iran (%)
Place of birth for the foreign-born population - Kazakhstan (%)
Place of birth for the foreign-born population - Nepal (%)
Place of birth for the foreign-born population - Pakistan (%)
Place of birth for the foreign-born population - Sri Lanka (%)
Place of birth for the foreign-born population - Uzbekistan (%)
Place of birth for the foreign-born population - Other South Central Asia (%)
Place of birth for the foreign-born population - Burma (%)
Place of birth for the foreign-born population - Cambodia (%)
Place of birth for the foreign-born population - Indonesia (%)
Place of birth for the foreign-born population - Laos (%)
Place of birth for the foreign-born population - Malaysia (%)
Place of birth for the foreign-born population - Philippines (%)
Place of birth for the foreign-born population - Singapore (%)
Place of birth for the foreign-born population - Thailand (%)
Place of birth for the foreign-born population - Vietnam (%)
Place of birth for the foreign-born population - Other South Eastern Asia (%)
Place of birth for the foreign-born population - Armenia (%)
Place of birth for the foreign-born population - Iraq (%)
Place of birth for the foreign-born population - Israel (%)
Place of birth for the foreign-born population - Jordan (%)
Place of birth for the foreign-born population - Kuwait (%)
Place of birth for the foreign-born population - Lebanon (%)
Place of birth for the foreign-born population - Saudi Arabia (%)
Place of birth for the foreign-born population - Syria (%)
Place of birth for the foreign-born population - Turkey (%)
Place of birth for the foreign-born population - Yemen (%)
Place of birth for the foreign-born population - Other Western Asia (%)
Place of birth for the foreign-born population - Eritrea (%)
Place of birth for the foreign-born population - Ethiopia (%)
Place of birth for the foreign-born population - Kenya (%)
Place of birth for the foreign-born population - Somalia (%)
Place of birth for the foreign-born population - Uganda (%)
Place of birth for the foreign-born population - Zimbabwe (%)
Place of birth for the foreign-born population - Other Eastern Africa (%)
Place of birth for the foreign-born population - Cameroon (%)
Place of birth for the foreign-born population - Congo (%)
Place of birth for the foreign-born population - Democratic Republic of Congo (Zaire) (%)
Place of birth for the foreign-born population - Other Middle Africa (%)
Place of birth for the foreign-born population - Egypt (%)
Place of birth for the foreign-born population - Morocco (%)
Place of birth for the foreign-born population - Sudan (%)
Place of birth for the foreign-born population - Other Northern Africa (%)
Place of birth for the foreign-born population - South Africa (%)
Place of birth for the foreign-born population - Other Southern Africa (%)
Place of birth for the foreign-born population - Cabo Verde (%)
Place of birth for the foreign-born population - Ghana (%)
Place of birth for the foreign-born population - Liberia (%)
Place of birth for the foreign-born population - Nigeria (%)
Place of birth for the foreign-born population - Senegal (%)
Place of birth for the foreign-born population - Sierra Leone (%)
Place of birth for the foreign-born population - Other Western Africa (%)
Place of birth for the foreign-born population - Australia (%)
Place of birth for the foreign-born population - New Zealand (%)
Place of birth for the foreign-born population - Fiji (%)
Place of birth for the foreign-born population - Micronesia (%)
Place of birth for the foreign-born population - Bahamas (%)
Place of birth for the foreign-born population - Barbados (%)
Place of birth for the foreign-born population - Cuba (%)
Place of birth for the foreign-born population - Dominica (%)
Place of birth for the foreign-born population - Dominican Republic (%)
Place of birth for the foreign-born population - Grenada (%)
Place of birth for the foreign-born population - Haiti (%)
Place of birth for the foreign-born population - Jamaica (%)
Place of birth for the foreign-born population - St. Vincent and the Grenadines (%)
Place of birth for the foreign-born population - Trinidad and Tobago (%)
Place of birth for the foreign-born population - West Indies (%)
Place of birth for the foreign-born population - Other Caribbean (%)
Place of birth for the foreign-born population - Belize (%)
Place of birth for the foreign-born population - Costa Rica (%)
Place of birth for the foreign-born population - El Salvador (%)
Place of birth for the foreign-born population - Guatemala (%)
Place of birth for the foreign-born population - Honduras (%)
Place of birth for the foreign-born population - Mexico (%)
Place of birth for the foreign-born population - Nicaragua (%)
Place of birth for the foreign-born population - Panama (%)
Place of birth for the foreign-born population - Other Central America (%)
Place of birth for the foreign-born population - Argentina (%)
Place of birth for the foreign-born population - Bolivia (%)
Place of birth for the foreign-born population - Brazil (%)
Place of birth for the foreign-born population - Chile (%)
Place of birth for the foreign-born population - Colombia (%)
Place of birth for the foreign-born population - Ecuador (%)
Place of birth for the foreign-born population - Guyana (%)
Place of birth for the foreign-born population - Peru (%)
Place of birth for the foreign-born population - Uruguay (%)
Place of birth for the foreign-born population - Venezuela (%)
Place of birth for the foreign-born population - Other South America (%)
Place of birth for the foreign-born population - Canada (%)
Place of birth for the foreign-born population - Other Northern America (%)
Place of birth for the foreign-born population - Other (%)
Latest news about races in Harlingen, TX collected exclusively by city-data.com from local newspapers, TV, and radio stations
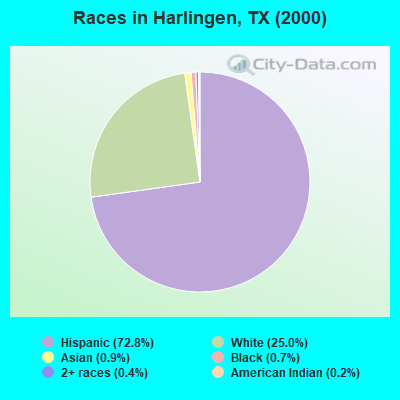
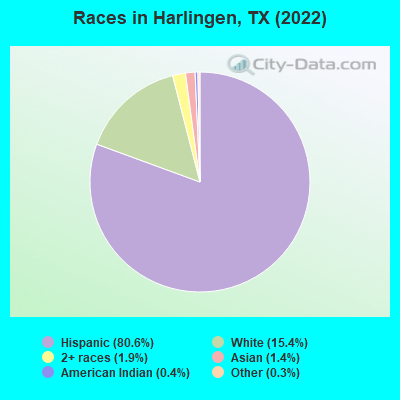
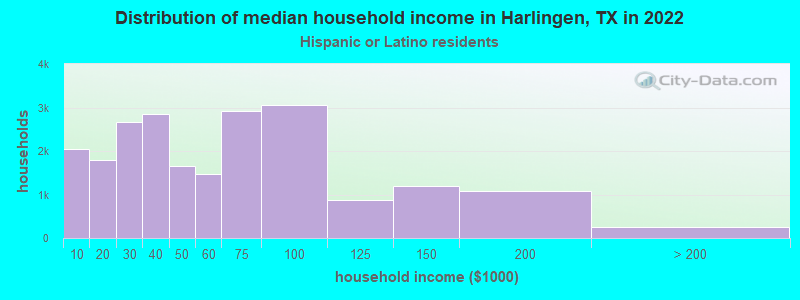
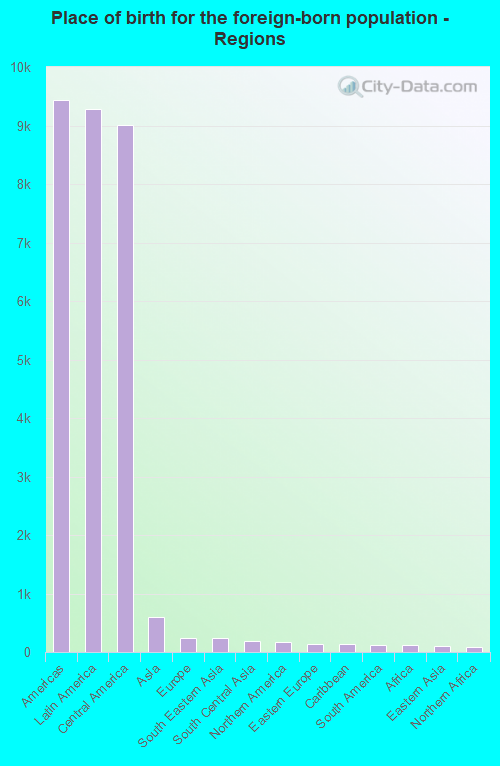
According to 2022 data, the most numerous races in Harlingen, TX are Hispanic (57,768 residents), White alone (11,026 residents), and Black alone (63 residents). 50.0% of Harlingen residents speak English at home. 14.4% of Harlingen, TX residents are foreign-born (12.5% born in Latin America), which is 17.8% less than the foreign-born rate of 17.0% across the entire state of Texas.
Race distribution in Harlingen
2000 2022
10,933,313 52.4% White alone 6,669,666 32.0% Hispanic 2,364,255 11.3% Black alone 554,445 2.7% Asian alone 230,567 1.1% Two or more races 68,859 0.3% American Indian alone 19,958 0.10% Other race alone 10,757 0.05% Native Hawaiian and Other
12,070,642 40.2% Hispanic 11,683,430 38.9% White alone 3,508,706 11.7% Black alone 1,608,173 5.4% Asian alone 956,560 3.2% Two or more races 125,763 0.4% Other race alone 47,023 0.2% American Indian alone 29,275 0.10% Native Hawaiian and Other
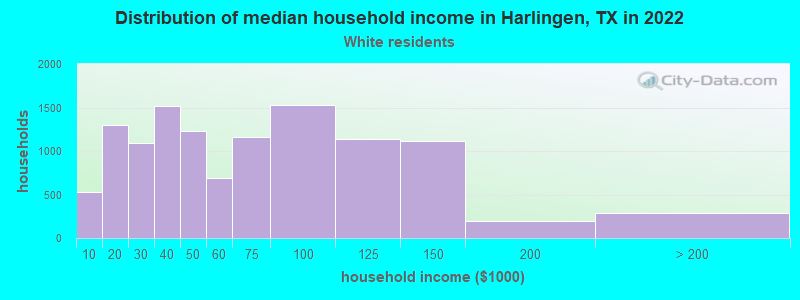
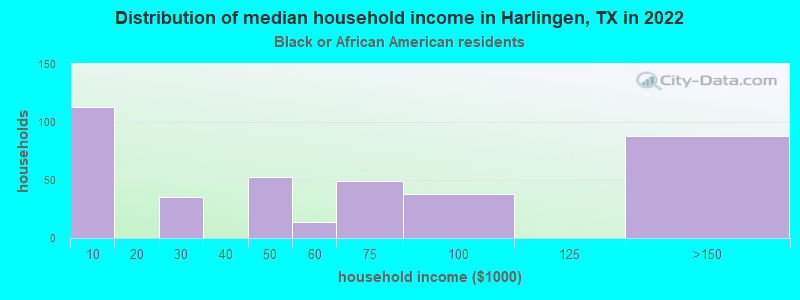
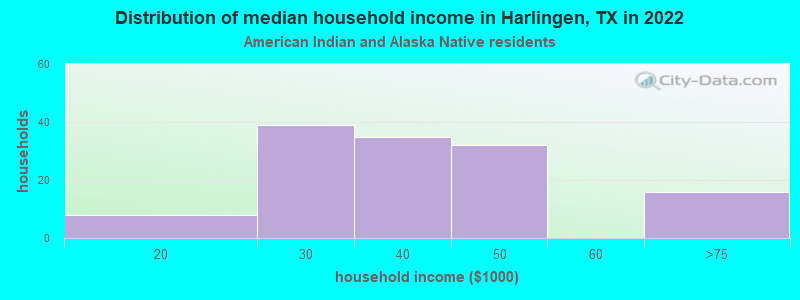
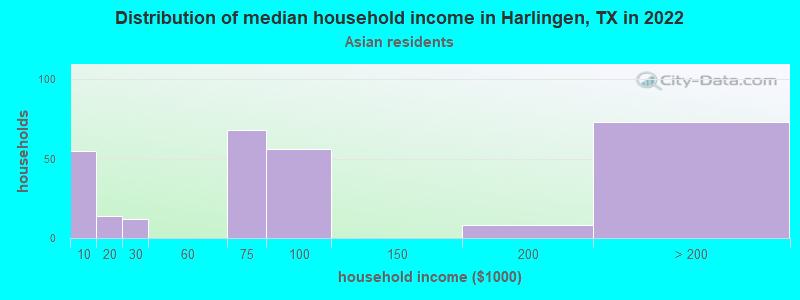
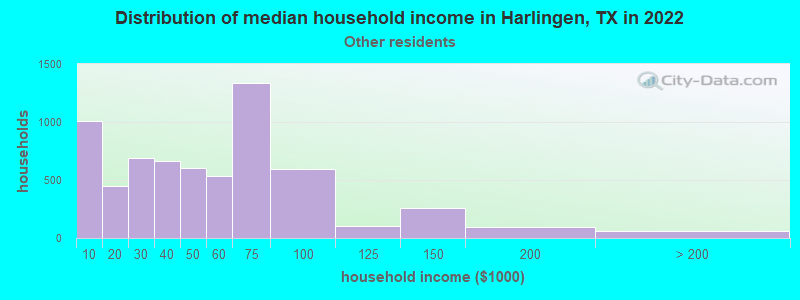
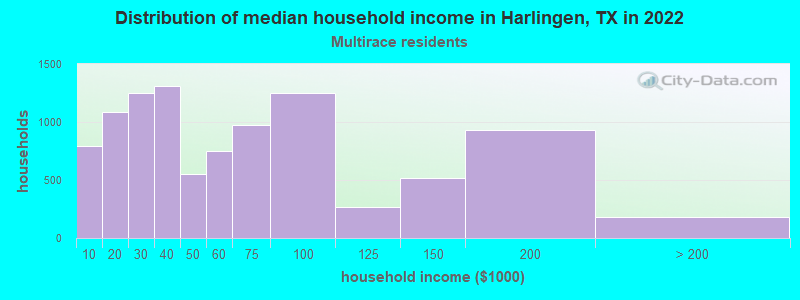
Income and house value in Harlingen Median household income in 2022 $50,744 White non-Hispanic householders$29,066 American Indian and Alaska Native householders$64,530 Asian householders$45,230 Some other race householders$47,414 Two or more races householders$48,542 Hispanic or Latino race householdersMedian 2022 house value $186,004 White Non-Hispanic householders$109,839 Black or African American householders$102,155 American Indian or Alaska Native householders $362,967 Asian householders$95,375 Some other race householders$106,223 Two or more races householders$105,319 Hispanic or Latino householders
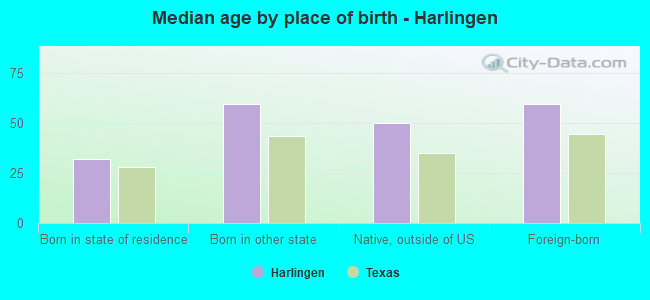
Median age by race in Harlingen
40.8 Median age for White residents42.0 39.6 12.7 Median age for Black or African American residents-666,666,666.0 -666,666,666.0 23.4 Median age for American Indian / Alaska Native residents23.7 26.8 48.4 Median age for Asian residents48.5 41.5 -666,666,666.0 Median age for Native Hawaiian / Pacific Islander residents-666,666,666.0 -666,666,666.0 36.8 Median age for Other race residents35.1 40.2 39.2 Median age for Two or more races residents31.4 45.7 62.8 Median age for White alone residents62.5 63.6 35.1 Median age for Hispanic or Latino residents32.1 39.0
Owner/renter occupied households by race in Harlingen
House owners and renters - White residents 6,614 56.1% Owner occupied5,170 43.9% Renter occupiedHouse owners and renters - Black or African American residents 228 58.6% Owner occupied161 41.4% Renter occupiedHouse owners and renters - American Indian / Alaska Native residents 75 56.6% Owner occupied57 43.4% Renter occupiedHouse owners and renters - Asian residents 245 72.8% Owner occupied91 27.2% Renter occupiedHouse owners and renters - Native Hawaiian / Pacific Islander residents 77 100.0% Owner occupiedHouse owners and renters - Other race residents 2,927 45.7% Owner occupied3,474 54.3% Renter occupiedHouse owners and renters - Two or more races residents 5,764 58.4% Owner occupied4,102 41.6% Renter occupiedHouse owners and renters - White alone residents 4,059 68.5% Owner occupied1,870 31.5% Renter occupiedHouse owners and renters - Hispanic or Latino residents 11,065 50.6% Owner occupied10,797 49.4% Renter occupied
Language usage in Harlingen
English speakers - Total 50.0% of residents of Harlingen speak English at home.
48.9% of residents speak Spanish at home 24,263 73.0% Speak English very well8,961 27.0% Speak English less than very well1.1% of residents speak other language at home 357 48.3% Speak English very well382 51.7% Speak English less than very well
English speakers - Born in the United States 76.2% of residents of Harlingen speak English at home.
23.8% of residents speak Spanish at home 1,868 74.1% Speak English very well652 25.9% Speak English less than very well
English speakers - Native, born elsewhere 46.1% of residents of Harlingen speak English at home.
53.9% of residents speak Spanish at home 470 69.4% Speak English very well207 30.6% Speak English less than very well
English speakers - Foreign-born 18.9% of residents of Harlingen speak English at home.
73.4% of residents speak Spanish at home 2,730 38.8% Speak English very well4,302 61.2% Speak English less than very well7.7% of residents speak other language at home 357 48.3% Speak English very well382 51.7% Speak English less than very well
White (Caucasian) - Speak only English Native:
71.6% (17,453)Foreign-born:
22.1% (253)
White (Caucasian) - Speak another language Native:
28.4% (6,923)Foreign-born:
77.9% (891)
Black or African American - Speak another language Native:
7.7% (96)Foreign-born:
100.0% (92)
Asian - Speak only English Native:
31.6% (41)Foreign-born:
37.4% (250)
Asian - Speak another language Native:
12.3% (16)Foreign-born:
65.7% (439)
Other race - Speak only English Native:
47.7% (6,483)Foreign-born:
33.2% (850)
Other race - Speak another language Native:
52.3% (7,096)Foreign-born:
66.8% (1,710)
Two or more races - Speak only English Native:
39.5% (7,721)Foreign-born:
8.4% (417)
Two or more races - Speak another language Native:
60.5% (11,807)Foreign-born:
91.6% (4,574)
White alone - Speak only English Native:
94.0% (8,750)Foreign-born:
48.7% (140)
White alone - Speak another language Native:
7.4% (686)Foreign-born:
48.8% (141)
Hispanic or Latino - Speak only English Native:
45.0% (20,702)Foreign-born:
15.5% (1,292)
Hispanic or Latino - Speak another language Native:
55.0% (25,353)Foreign-born:
84.5% (7,032)
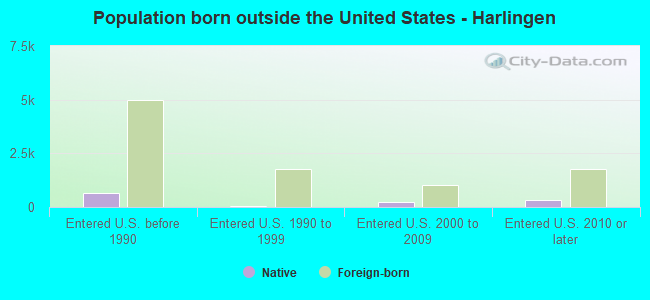
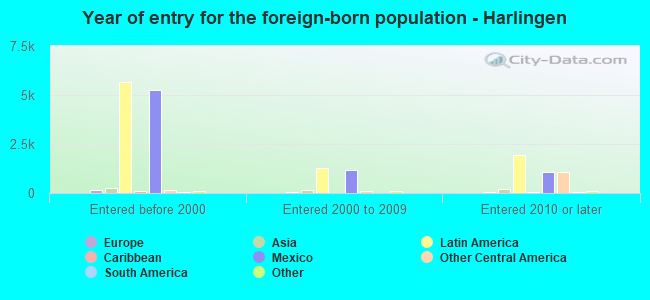
Foreign-born residents in Harlingen 10,400 residents are foreign born (12.5% Latin America ).
This city:
14.4%Texas:
17.1%
Marital status for residents in Harlingen Marital status - White (Caucasian) population 15 years and over
Males 35.7% Never married47.3% Now married3.2% Separated7.6% Widowed6.3% DivorcedFemales 26.1% Never married46.3% Now married3.5% Separated12.3% Widowed11.7% DivorcedWomen who gave birth in the past 12 months Now married:
42.3% (180)Unmarried:
57.7% (246)
Women who did not give birth in the past 12 months Now married:
41.2% (1,890)Unmarried:
58.8% (2,692)
Marital status - Black or African American population 15 years and over
Males 59.7% Never married11.9% Now married0.0% Separated0.0% Widowed28.4% DivorcedFemales 50.8% Never married11.5% Now married4.7% Separated0.0% Widowed33.0% DivorcedWomen who did not give birth in the past 12 months Now married:
14.0% (36)Unmarried:
86.0% (223)
Marital status - American Indian / Alaska Native population 15 years and over
Males 60.0% Never married25.6% Now married0.0% Separated14.4% Widowed0.0% DivorcedFemales 53.8% Never married19.2% Now married0.0% Separated20.5% Widowed6.4% DivorcedWomen who did not give birth in the past 12 months Now married:
17.5% (14)Unmarried:
82.5% (67)
Marital status - Asian population 15 years and over
Males 36.3% Never married61.0% Now married0.0% Separated0.0% Widowed2.7% DivorcedFemales 11.0% Never married77.4% Now married0.0% Separated11.6% Widowed0.0% DivorcedWomen who gave birth in the past 12 months Now married:
100.0% (43)Unmarried:
0.0% (0)
Women who did not give birth in the past 12 months Now married:
83.3% (118)Unmarried:
16.7% (24)
Marital status - Native Hawaiian / Pacific Islander population 15 years and over
Males 0.0% Never married100.0% Now married0.0% Separated0.0% Widowed0.0% DivorcedFemales 0.0% Never married100.0% Now married0.0% Separated0.0% Widowed0.0% DivorcedMarital status - Other race population 15 years and over
Males 40.9% Never married39.7% Now married5.4% Separated3.6% Widowed10.5% DivorcedFemales 43.6% Never married29.4% Now married6.0% Separated7.5% Widowed13.6% DivorcedWomen who gave birth in the past 12 months Now married:
44.7% (37)Unmarried:
55.3% (46)
Women who did not give birth in the past 12 months Now married:
46.3% (1,406)Unmarried:
53.7% (1,628)
Marital status - Two or more races population 15 years and over
Males 47.0% Never married48.0% Now married0.6% Separated2.6% Widowed1.8% DivorcedFemales 36.5% Never married38.5% Now married3.8% Separated6.7% Widowed14.6% DivorcedWomen who gave birth in the past 12 months Now married:
46.0% (86)Unmarried:
54.0% (100)
Women who did not give birth in the past 12 months Now married:
35.0% (1,741)Unmarried:
65.0% (3,238)
Marital status - White alone, not Hispanic / Latino population 15 years and over
Males 17.0% Never married56.1% Now married2.5% Separated13.9% Widowed10.4% DivorcedFemales 12.2% Never married60.8% Now married0.9% Separated19.3% Widowed6.8% DivorcedWomen who gave birth in the past 12 months Now married:
34.2% (48)Unmarried:
65.8% (92)
Women who did not give birth in the past 12 months Now married:
49.7% (653)Unmarried:
50.3% (662)
Marital status - Hispanic or Latino population 15 years and over
Males 46.8% Never married42.9% Now married2.9% Separated2.9% Widowed4.4% DivorcedFemales 40.3% Never married34.9% Now married4.1% Separated7.2% Widowed13.5% DivorcedWomen who gave birth in the past 12 months Now married:
20.6% (133)Unmarried:
79.4% (513)
Women who did not give birth in the past 12 months Now married:
35.7% (4,723)Unmarried:
64.3% (8,500)
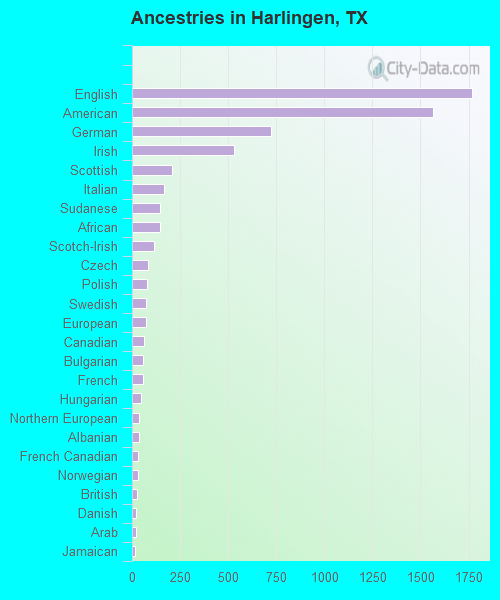
Ancestries in Harlingen
1,768 3.3% English1,565 2.9% American721 1.4% German532 1.0% Irish209 0.4% Scottish169 0.3% Italian146 0.3% Sudanese145 0.3% African117 0.2% Scotch-Irish81 0.2% Czech77 0.1% Polish75 0.1% Swedish73 0.1% European65 0.1% Canadian58 0.1% Bulgarian57 0.1% French49 0.09% Hungarian39 0.07% Northern European34 0.06% Albanian31 0.06% French Canadian30 0.06% Norwegian27 0.05% British21 0.04% Danish19 0.04% Arab17 0.03% Jamaican16 0.03% Eastern European15 0.03% Syrian10 0.02% Basque10 0.02% Iranian10 0.02% Welsh3 0.01% Dutch
Geographical mobility in Harlingen Same house 1 year ago 23,431 88.1% White (Caucasian)733 89.0% Black or African American260 94.4% American Indian / Alaska Native564 78.1% Asian116 98.2% Native Hawaiian / Pacific Islander14,358 89.0% Other race23,593 92.9% Two or more races9,034 82.6% White alone, not Hispanic / Latino50,787 90.1% Hispanic or LatinoMoved within same county 565 2.1% White / Caucasian12 4.3% American Indian / Alaska Native787 4.9% Other race1,166 4.6% Two or more races409 3.7% White alone, not Hispanic / Latino2,564 4.6% Hispanic or LatinoMoved within same state 1,975 7.4% White / Caucasian126 15.3% Black or African American95 13.2% Asian622 3.9% Other race172 0.7% Two or more races940 8.6% White alone, not Hispanic / Latino2,069 3.7% Hispanic or LatinoMoved from different state 605 2.3% White / Caucasian8 2.9% American Indian / Alaska Native26 3.7% Asian200 0.8% Two or more races553 5.1% White alone, not Hispanic / Latino459 0.8% Hispanic or LatinoMoved from abroad 9 0.0% White51 7.1% Asian372 2.3% Other race99 0.4% Two or more races463 0.8% Hispanic or Latino
Children Nativity (place of birth) in Harlingen
Children under 6 years - Living with two parents Both parents native 1,851 100.0% NativeBoth parents foreign-born 327 100.0% NativeOne native, one foreign-born parent 334 100.0% NativeChildren under 6 years - Living with one parent Native parent 3,008 100.0% NativeForeign-born parent 237 100.0% NativeChildren 6 to 17 years - Living with two parents Both parents native 3,636 99.8% Native7 0.2% Foreign-bornBoth parents foreign-born 1,194 93.6% Native81 6.4% Foreign-bornOne native, one foreign-born parent 839 99.0% Native9 1.0% Foreign-bornChildren 6 to 17 years - Living with one parent Native parent 5,807 100.0% NativeForeign-born parent 1,457 51.5% Native1,372 48.5% Foreign-born
Grandparents responsible for own grandchildren in Harlingen
Grandparents (30 to 59 years) White / Caucasian 148 66.1% Responsible for grandchildren76 33.9% Not responsible for grandchildrenBlack or African American 47 100.0% Responsible for grandchildrenOther race 6 11.2% Responsible for grandchildren51 88.8% Not responsible for grandchildrenTwo or more races 87 24.9% Responsible for grandchildren262 75.1% Not responsible for grandchildrenWhite alone, not Hispanic / Latino 46 78.4% Responsible for grandchildren13 21.6% Not responsible for grandchildrenHispanic or Latino 185 36.5% Responsible for grandchildren322 63.5% Not responsible for grandchildrenGrandparents (60 years and over) White / Caucasian 135 22.5% Responsible for grandchildren467 77.5% Not responsible for grandchildrenBlack or African American 28 100.0% Not responsible for grandchildrenOther race 37 40.6% Responsible for grandchildren54 59.4% Not responsible for grandchildrenTwo or more races 108 30.0% Responsible for grandchildren252 70.0% Not responsible for grandchildrenWhite alone, not Hispanic / Latino 33 40.2% Responsible for grandchildren49 59.8% Not responsible for grandchildrenHispanic or Latino 319 34.8% Responsible for grandchildren598 65.2% Not responsible for grandchildren