Races in Hackensack, New Jersey (NJ) Detailed Stats
Data:
Races - White alone (%)
Races - White alone (% change since 2000)
Races - Black alone (%)
Races - Black alone (% change since 2000)
Races - American Indian alone (%)
Races - American Indian alone (% change since 2000)
Races - Asian alone (%)
Races - Asian alone (% change since 2000)
Races - Hispanic (%)
Races - Hispanic (% change since 2000)
Races - Native Hawaiian and Other Pacific Islander alone (%)
Races - Native Hawaiian and Other Pacific Islander alone (% change since 2000)
Races - Two or more races(%)
Races - Two or more races(% change since 2000)
Races - Other race alone (%)
Races - Other race alone (% change since 2000)
Racial diversity
Place of birth - Born in state of residence (%)
Place of birth - Born in state of residence (%) - White
Place of birth - Born in state of residence (%) - Black or African American
Place of birth - Born in state of residence (%) - Asian
Place of birth - Born in state of residence (%) - Hispanic or Latino
Place of birth - Born in state of residence (%) - American Indian and Alaska Native
Place of birth - Born in state of residence (%) - Multirace
Place of birth - Born in state of residence (%) - Other Race
Place of birth - Born in other state (%)
Place of birth - Born in other state (%) - White
Place of birth - Born in other state (%) - Black or African American
Place of birth - Born in other state (%) - Asian
Place of birth - Born in other state (%) - Hispanic or Latino
Place of birth - Born in other state (%) - American Indian and Alaska Native
Place of birth - Born in other state (%) - Multirace
Place of birth - Born in other state (%) - Other Race
Place of birth - Native, outside of US (%)
Place of birth - Native, outside of US (%) - White
Place of birth - Native, outside of US (%) - Black or African American
Place of birth - Native, outside of US (%) - Asian
Place of birth - Native, outside of US (%) - Hispanic or Latino
Place of birth - Native, outside of US (%) - American Indian and Alaska Native
Place of birth - Native, outside of US (%) - Multirace
Place of birth - Native, outside of US (%) - Other Race
Place of birth - Foreign born (%)
Place of birth - Foreign born (%) - White
Place of birth - Foreign born (%) - Black or African American
Place of birth - Foreign born (%) - Asian
Place of birth - Foreign born (%) - Hispanic or Latino
Place of birth - Foreign born (%) - American Indian and Alaska Native
Place of birth - Foreign born (%) - Multirace
Place of birth - Foreign born (%) - Other Race
Residents speaking English at home (%)
Residents speaking English at home - Born in the United States (%)
Residents speaking English at home - Native, born elsewhere (%)
Residents speaking English at home - Foreign born (%)
Residents speaking Spanish at home (%)
Residents speaking Spanish at home - Born in the United States (%)
Residents speaking Spanish at home - Native, born elsewhere (%)
Residents speaking Spanish at home - Foreign born (%)
Residents speaking other language at home (%)
Residents speaking other language at home - Born in the United States (%)
Residents speaking other language at home - Native, born elsewhere (%)
Residents speaking other language at home - Foreign born (%)
Marital status - Never married (%)
Marital status - Now married (%)
Marital status - Separated (%)
Marital status - Widowed (%)
Marital status - Divorced (%)
Ancestries Reported - Arab (%)
Ancestries Reported - Czech (%)
Ancestries Reported - Danish (%)
Ancestries Reported - Dutch (%)
Ancestries Reported - English (%)
Ancestries Reported - French (%)
Ancestries Reported - French Canadian (%)
Ancestries Reported - German (%)
Ancestries Reported - Greek (%)
Ancestries Reported - Hungarian (%)
Ancestries Reported - Irish (%)
Ancestries Reported - Italian (%)
Ancestries Reported - Lithuanian (%)
Ancestries Reported - Norwegian (%)
Ancestries Reported - Polish (%)
Ancestries Reported - Portuguese (%)
Ancestries Reported - Russian (%)
Ancestries Reported - Scotch-Irish (%)
Ancestries Reported - Scottish (%)
Ancestries Reported - Slovak (%)
Ancestries Reported - Subsaharan African (%)
Ancestries Reported - Swedish (%)
Ancestries Reported - Swiss (%)
Ancestries Reported - Ukrainian (%)
Ancestries Reported - United States (%)
Ancestries Reported - Welsh (%)
Ancestries Reported - West Indian (%)
Ancestries Reported - Other (%)
Geographical mobility - Same house 1 year ago (%)
Geographical mobility - Same house 1 year ago (%) - White
Geographical mobility - Same house 1 year ago (%) - Black or African American
Geographical mobility - Same house 1 year ago (%) - Asian
Geographical mobility - Same house 1 year ago (%) - Hispanic or Latino
Geographical mobility - Same house 1 year ago (%) - American Indian and Alaska Native
Geographical mobility - Same house 1 year ago (%) - Multirace
Geographical mobility - Same house 1 year ago (%) - Other Race
Geographical mobility - Moved within same county (%)
Geographical mobility - Moved within same county (%) - White
Geographical mobility - Moved within same county (%) - Black or African American
Geographical mobility - Moved within same county (%) - Asian
Geographical mobility - Moved within same county (%) - Hispanic or Latino
Geographical mobility - Moved within same county (%) - American Indian and Alaska Native
Geographical mobility - Moved within same county (%) - Multirace
Geographical mobility - Moved within same county (%) - Other Race
Geographical mobility - Moved from different county within same state (%)
Geographical mobility - Moved from different county within same state (%) - White
Geographical mobility - Moved from different county within same state (%) - Black or African American
Geographical mobility - Moved from different county within same state (%) - Asian
Geographical mobility - Moved from different county within same state (%) - Hispanic or Latino
Geographical mobility - Moved from different county within same state (%) - American Indian and Alaska Native
Geographical mobility - Moved from different county within same state (%) - Multirace
Geographical mobility - Moved from different county within same state (%) - Other Race
Geographical mobility - Moved from different state (%)
Geographical mobility - Moved from different state (%) - White
Geographical mobility - Moved from different state (%) - Black or African American
Geographical mobility - Moved from different state (%) - Asian
Geographical mobility - Moved from different state (%) - Hispanic or Latino
Geographical mobility - Moved from different state (%) - American Indian and Alaska Native
Geographical mobility - Moved from different state (%) - Multirace
Geographical mobility - Moved from different state (%) - Other Race
Geographical mobility - Moved from abroad (%)
Geographical mobility - Moved from abroad (%) - White
Geographical mobility - Moved from abroad (%) - Black or African American
Geographical mobility - Moved from abroad (%) - Asian
Geographical mobility - Moved from abroad (%) - Hispanic or Latino
Geographical mobility - Moved from abroad (%) - American Indian and Alaska Native
Geographical mobility - Moved from abroad (%) - Multirace
Geographical mobility - Moved from abroad (%) - Other Race
Place of birth for the foreign-born population - Ireland (%)
Place of birth for the foreign-born population - Denmark (%)
Place of birth for the foreign-born population - Norway (%)
Place of birth for the foreign-born population - Sweden (%)
Place of birth for the foreign-born population - United Kingdom (%)
Place of birth for the foreign-born population - England (%)
Place of birth for the foreign-born population - Scotland (%)
Place of birth for the foreign-born population - Other Northern Europe (%)
Place of birth for the foreign-born population - Austria (%)
Place of birth for the foreign-born population - Belgium (%)
Place of birth for the foreign-born population - France (%)
Place of birth for the foreign-born population - Germany (%)
Place of birth for the foreign-born population - Netherlands (%)
Place of birth for the foreign-born population - Switzerland (%)
Place of birth for the foreign-born population - Other Western Europe (%)
Place of birth for the foreign-born population - Greece (%)
Place of birth for the foreign-born population - Italy (%)
Place of birth for the foreign-born population - Portugal (%)
Place of birth for the foreign-born population - Spain (%)
Place of birth for the foreign-born population - Other Southern Europe (%)
Place of birth for the foreign-born population - Albania (%)
Place of birth for the foreign-born population - Belarus (%)
Place of birth for the foreign-born population - Bosnia and Herzegovina (%)
Place of birth for the foreign-born population - Bulgaria (%)
Place of birth for the foreign-born population - Croatia (%)
Place of birth for the foreign-born population - Czechoslovakia (%)
Place of birth for the foreign-born population - Hungary (%)
Place of birth for the foreign-born population - Latvia (%)
Place of birth for the foreign-born population - Lithuania (%)
Place of birth for the foreign-born population - North Macedonia (Macedonia) (%)
Place of birth for the foreign-born population - Moldova (%)
Place of birth for the foreign-born population - Poland (%)
Place of birth for the foreign-born population - Romania (%)
Place of birth for the foreign-born population - Russia (%)
Place of birth for the foreign-born population - Serbia (%)
Place of birth for the foreign-born population - Ukraine (%)
Place of birth for the foreign-born population - Other Eastern Europe (%)
Place of birth for the foreign-born population - China (%)
Place of birth for the foreign-born population - Hong Kong (%)
Place of birth for the foreign-born population - Taiwan (%)
Place of birth for the foreign-born population - Japan (%)
Place of birth for the foreign-born population - Korea (%)
Place of birth for the foreign-born population - Other Eastern Asia (%)
Place of birth for the foreign-born population - Afghanistan (%)
Place of birth for the foreign-born population - Bangladesh (%)
Place of birth for the foreign-born population - India (%)
Place of birth for the foreign-born population - Iran (%)
Place of birth for the foreign-born population - Kazakhstan (%)
Place of birth for the foreign-born population - Nepal (%)
Place of birth for the foreign-born population - Pakistan (%)
Place of birth for the foreign-born population - Sri Lanka (%)
Place of birth for the foreign-born population - Uzbekistan (%)
Place of birth for the foreign-born population - Other South Central Asia (%)
Place of birth for the foreign-born population - Burma (%)
Place of birth for the foreign-born population - Cambodia (%)
Place of birth for the foreign-born population - Indonesia (%)
Place of birth for the foreign-born population - Laos (%)
Place of birth for the foreign-born population - Malaysia (%)
Place of birth for the foreign-born population - Philippines (%)
Place of birth for the foreign-born population - Singapore (%)
Place of birth for the foreign-born population - Thailand (%)
Place of birth for the foreign-born population - Vietnam (%)
Place of birth for the foreign-born population - Other South Eastern Asia (%)
Place of birth for the foreign-born population - Armenia (%)
Place of birth for the foreign-born population - Iraq (%)
Place of birth for the foreign-born population - Israel (%)
Place of birth for the foreign-born population - Jordan (%)
Place of birth for the foreign-born population - Kuwait (%)
Place of birth for the foreign-born population - Lebanon (%)
Place of birth for the foreign-born population - Saudi Arabia (%)
Place of birth for the foreign-born population - Syria (%)
Place of birth for the foreign-born population - Turkey (%)
Place of birth for the foreign-born population - Yemen (%)
Place of birth for the foreign-born population - Other Western Asia (%)
Place of birth for the foreign-born population - Eritrea (%)
Place of birth for the foreign-born population - Ethiopia (%)
Place of birth for the foreign-born population - Kenya (%)
Place of birth for the foreign-born population - Somalia (%)
Place of birth for the foreign-born population - Uganda (%)
Place of birth for the foreign-born population - Zimbabwe (%)
Place of birth for the foreign-born population - Other Eastern Africa (%)
Place of birth for the foreign-born population - Cameroon (%)
Place of birth for the foreign-born population - Congo (%)
Place of birth for the foreign-born population - Democratic Republic of Congo (Zaire) (%)
Place of birth for the foreign-born population - Other Middle Africa (%)
Place of birth for the foreign-born population - Egypt (%)
Place of birth for the foreign-born population - Morocco (%)
Place of birth for the foreign-born population - Sudan (%)
Place of birth for the foreign-born population - Other Northern Africa (%)
Place of birth for the foreign-born population - South Africa (%)
Place of birth for the foreign-born population - Other Southern Africa (%)
Place of birth for the foreign-born population - Cabo Verde (%)
Place of birth for the foreign-born population - Ghana (%)
Place of birth for the foreign-born population - Liberia (%)
Place of birth for the foreign-born population - Nigeria (%)
Place of birth for the foreign-born population - Senegal (%)
Place of birth for the foreign-born population - Sierra Leone (%)
Place of birth for the foreign-born population - Other Western Africa (%)
Place of birth for the foreign-born population - Australia (%)
Place of birth for the foreign-born population - New Zealand (%)
Place of birth for the foreign-born population - Fiji (%)
Place of birth for the foreign-born population - Micronesia (%)
Place of birth for the foreign-born population - Bahamas (%)
Place of birth for the foreign-born population - Barbados (%)
Place of birth for the foreign-born population - Cuba (%)
Place of birth for the foreign-born population - Dominica (%)
Place of birth for the foreign-born population - Dominican Republic (%)
Place of birth for the foreign-born population - Grenada (%)
Place of birth for the foreign-born population - Haiti (%)
Place of birth for the foreign-born population - Jamaica (%)
Place of birth for the foreign-born population - St. Vincent and the Grenadines (%)
Place of birth for the foreign-born population - Trinidad and Tobago (%)
Place of birth for the foreign-born population - West Indies (%)
Place of birth for the foreign-born population - Other Caribbean (%)
Place of birth for the foreign-born population - Belize (%)
Place of birth for the foreign-born population - Costa Rica (%)
Place of birth for the foreign-born population - El Salvador (%)
Place of birth for the foreign-born population - Guatemala (%)
Place of birth for the foreign-born population - Honduras (%)
Place of birth for the foreign-born population - Mexico (%)
Place of birth for the foreign-born population - Nicaragua (%)
Place of birth for the foreign-born population - Panama (%)
Place of birth for the foreign-born population - Other Central America (%)
Place of birth for the foreign-born population - Argentina (%)
Place of birth for the foreign-born population - Bolivia (%)
Place of birth for the foreign-born population - Brazil (%)
Place of birth for the foreign-born population - Chile (%)
Place of birth for the foreign-born population - Colombia (%)
Place of birth for the foreign-born population - Ecuador (%)
Place of birth for the foreign-born population - Guyana (%)
Place of birth for the foreign-born population - Peru (%)
Place of birth for the foreign-born population - Uruguay (%)
Place of birth for the foreign-born population - Venezuela (%)
Place of birth for the foreign-born population - Other South America (%)
Place of birth for the foreign-born population - Canada (%)
Place of birth for the foreign-born population - Other Northern America (%)
Place of birth for the foreign-born population - Other (%)
Latest news about races in Hackensack, NJ collected exclusively by city-data.com from local newspapers, TV, and radio stations
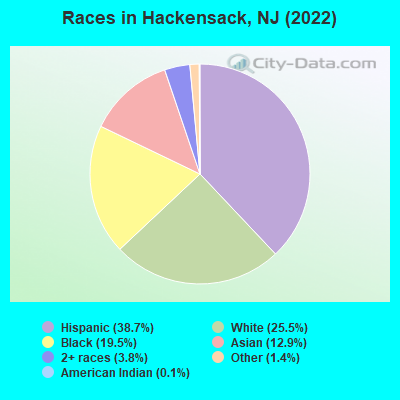
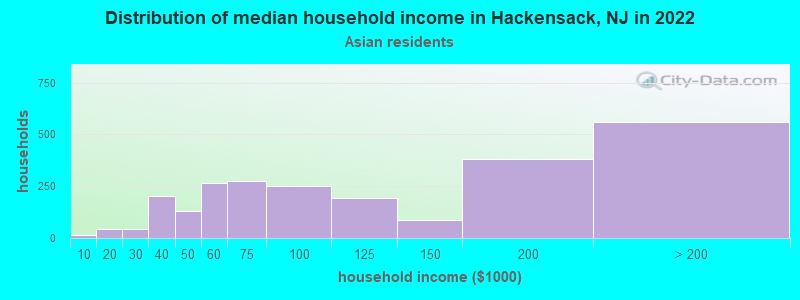
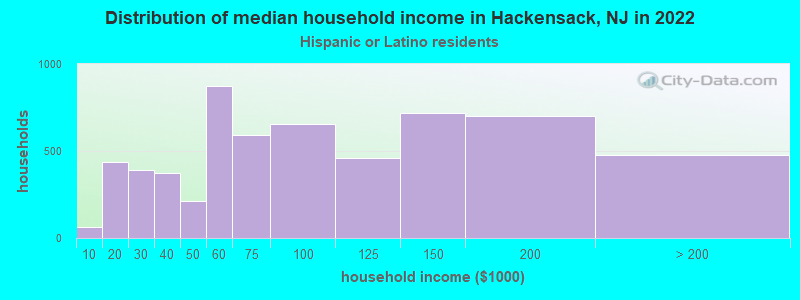
According to 2022 data, the most numerous races in Hackensack, NJ are White alone (11,688 residents), Hispanic (17,716 residents), and Black alone (8,915 residents). 47.6% of Hackensack residents speak English at home. 43.5% of Hackensack, NJ residents are foreign-born (24.1% born in Latin America, 13.0% born in Asia), which is 47.1% greater than the foreign-born rate of 23.0% across the entire state of New Jersey.
Race distribution in Hackensack
2000 2022
17,013 39.9% White alone 11,061 25.9% Hispanic 10,092 23.6% Black alone 3,163 7.4% Asian alone 1,139 2.7% Two or more races 111 0.3% Other race alone 90 0.2% American Indian alone 8 0.02% Native Hawaiian and Other
17,716 38.7% Hispanic 11,688 25.5% White alone 8,915 19.5% Black alone 5,907 12.9% Asian alone 1,718 3.8% Two or more races 655 1.4% Other race alone 63 0.1% American Indian alone
2000 2022
5,557,209 66.0% White alone 1,117,191 13.3% Hispanic 1,096,171 13.0% Black alone 477,012 5.7% Asian alone 133,689 1.6% Two or more races 19,565 0.2% Other race alone 11,338 0.1% American Indian alone 2,175 0.03% Native Hawaiian and Other
4,766,476 51.5% White alone 2,028,470 21.9% Hispanic 1,111,632 12.0% Black alone 923,546 10.0% Asian alone 332,237 3.6% Two or more races 89,847 1.0% Other race alone 8,557 0.09% American Indian alone 934 0.01% Native Hawaiian and Other
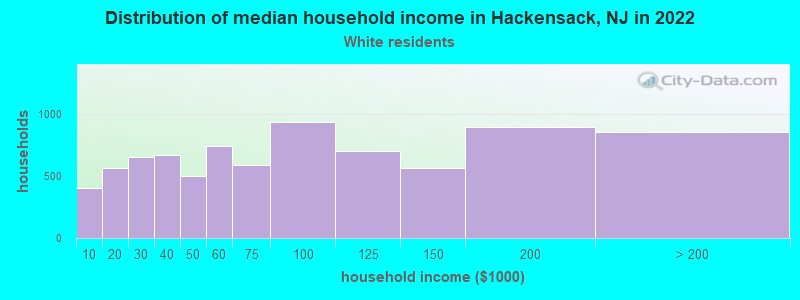
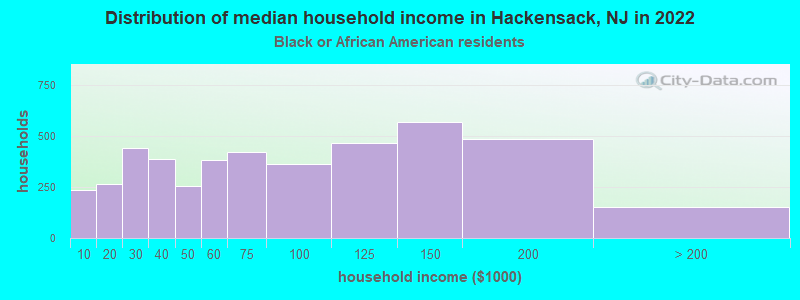
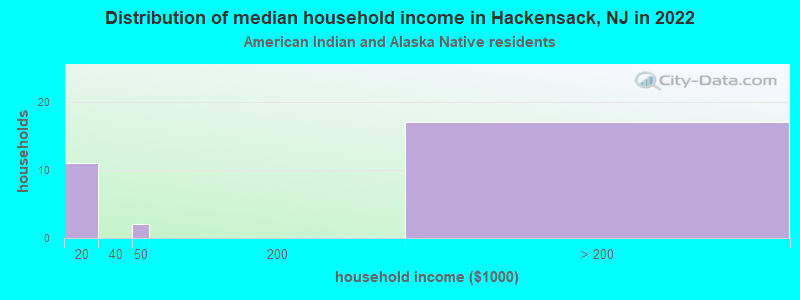
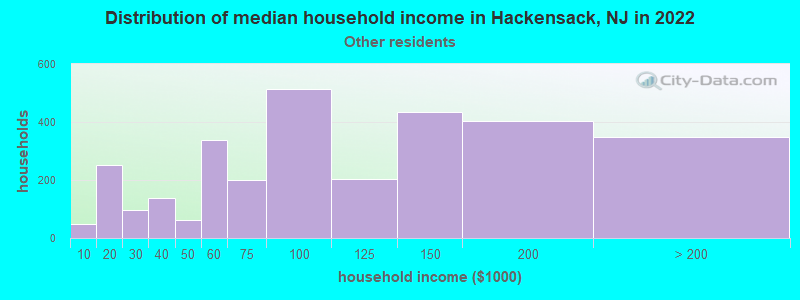
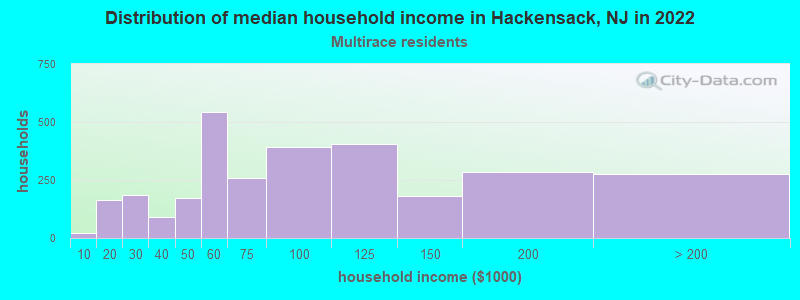
Income and house value in Hackensack Median household income in 2022 $75,247 White non-Hispanic householders$79,666 Black householders$103,083 Asian householders$81,238 Some other race householders$78,022 Two or more races householders$72,750 Hispanic or Latino race householdersMedian 2022 house value $420,593 White Non-Hispanic householders$392,832 Black or African American householders $419,050 Asian householders$383,358 Some other race householders$394,815 Two or more races householders$408,475 Hispanic or Latino householders
Median age by race in Hackensack
45.9 Median age for White residents44.5 48.7 43.8 Median age for Black or African American residents42.5 43.6 8.0 Median age for American Indian / Alaska Native residents37.5 -753,722,794.2 37.3 Median age for Asian residents35.9 39.8 -510,460,250.5 Median age for Native Hawaiian / Pacific Islander residents-514,767,932.0 -713,070,378.3 31.8 Median age for Other race residents31.7 32.7 38.1 Median age for Two or more races residents36.5 43.4 54.5 Median age for White alone residents51.0 57.0 34.9 Median age for Hispanic or Latino residents34.4 35.5
Owner/renter occupied households by race in Hackensack
House owners and renters - White residents 3,230 41.6% Owner occupied4,541 58.4% Renter occupiedHouse owners and renters - Black or African American residents 1,513 36.1% Owner occupied2,673 63.9% Renter occupiedHouse owners and renters - American Indian / Alaska Native residents 1 2.6% Owner occupied50 97.4% Renter occupiedHouse owners and renters - Asian residents 1,016 40.9% Owner occupied1,465 59.1% Renter occupiedHouse owners and renters - Other race residents 1,571 50.0% Owner occupied1,571 50.0% Renter occupiedHouse owners and renters - Two or more races residents 674 22.3% Owner occupied2,355 77.7% Renter occupiedHouse owners and renters - White alone residents 3,049 45.5% Owner occupied3,658 54.5% Renter occupiedHouse owners and renters - Hispanic or Latino residents 1,843 31.2% Owner occupied4,061 68.8% Renter occupied
Language usage in Hackensack
English speakers - Total 47.6% of residents of Hackensack speak English at home.
32.8% of residents speak Spanish at home 7,256 51.0% Speak English very well6,980 49.0% Speak English less than very well21.1% of residents speak other language at home 6,255 68.4% Speak English very well2,893 31.6% Speak English less than very well
English speakers - Born in the United States 73.7% of residents of Hackensack speak English at home.
20.2% of residents speak Spanish at home 1,975 93.1% Speak English very well147 6.9% Speak English less than very well7.4% of residents speak other language at home 770 99.2% Speak English very well6 0.8% Speak English less than very well
English speakers - Native, born elsewhere 29.8% of residents of Hackensack speak English at home.
65.6% of residents speak Spanish at home 409 79.9% Speak English very well103 20.1% Speak English less than very well5.8% of residents speak other language at home 45 100.0% Speak English very well
English speakers - Foreign-born 17.9% of residents of Hackensack speak English at home.
46.5% of residents speak Spanish at home 2,879 31.7% Speak English very well6,203 68.3% Speak English less than very well36.8% of residents speak other language at home 4,370 60.9% Speak English very well2,810 39.1% Speak English less than very well
White (Caucasian) - Speak only English Native:
81.3% (8,665)Foreign-born:
10.5% (456)
White (Caucasian) - Speak another language Native:
16.6% (1,765)Foreign-born:
86.9% (3,791)
Black or African American - Speak only English Native:
91.2% (6,124)Foreign-born:
68.3% (1,483)
Black or African American - Speak another language Native:
8.8% (594)Foreign-born:
32.4% (704)
American Indian / Alaska Native - Speak another language Native:
100.0% (71)Foreign-born:
100.0% (6)
Asian - Speak only English Native:
55.1% (582)Foreign-born:
13.4% (597)
Asian - Speak another language Native:
45.3% (478)Foreign-born:
86.6% (3,874)
Other race - Speak only English Native:
11.0% (399)Foreign-born:
5.8% (314)
Other race - Speak another language Native:
93.6% (3,388)Foreign-born:
94.0% (5,127)
Two or more races - Speak only English Native:
55.5% (2,072)Foreign-born:
16.2% (790)
Two or more races - Speak another language Native:
44.8% (1,671)Foreign-born:
83.1% (4,057)
White alone - Speak only English Native:
90.0% (8,048)Foreign-born:
17.3% (450)
White alone - Speak another language Native:
9.9% (886)Foreign-born:
82.8% (2,152)
Hispanic or Latino - Speak only English Native:
28.8% (1,937)Foreign-born:
8.8% (860)
Hispanic or Latino - Speak another language Native:
73.3% (4,933)Foreign-born:
91.2% (8,935)
Foreign-born residents in Hackensack 19,879 residents are foreign born (24.1% Latin America , 13.0% Asia ).
This city:
43.5%New Jersey:
23.2%
Marital status for residents in Hackensack Marital status - White (Caucasian) population 15 years and over
Males 48.2% Never married33.1% Now married2.5% Separated2.3% Widowed13.8% DivorcedFemales 41.7% Never married28.2% Now married3.6% Separated11.4% Widowed15.1% DivorcedWomen who gave birth in the past 12 months Now married:
36.4% (23)Unmarried:
63.6% (40)
Women who did not give birth in the past 12 months Now married:
30.2% (965)Unmarried:
69.8% (2,233)
Marital status - Black or African American population 15 years and over
Males 40.0% Never married45.7% Now married2.2% Separated2.9% Widowed9.2% DivorcedFemales 48.7% Never married27.6% Now married2.8% Separated7.0% Widowed13.8% DivorcedWomen who gave birth in the past 12 months Now married:
24.3% (19)Unmarried:
75.7% (58)
Women who did not give birth in the past 12 months Now married:
28.9% (716)Unmarried:
71.1% (1,759)
Marital status - Asian population 15 years and over
Males 36.4% Never married57.7% Now married0.6% Separated2.0% Widowed3.3% DivorcedFemales 20.6% Never married61.5% Now married0.8% Separated3.3% Widowed13.8% DivorcedWomen who gave birth in the past 12 months Now married:
100.0% (68)Unmarried:
0.0% (0)
Women who did not give birth in the past 12 months Now married:
51.1% (712)Unmarried:
48.9% (681)
Marital status - Other race population 15 years and over
Males 36.4% Never married50.9% Now married4.4% Separated0.7% Widowed7.5% DivorcedFemales 37.3% Never married43.4% Now married1.9% Separated2.1% Widowed15.3% DivorcedWomen who gave birth in the past 12 months Now married:
64.7% (39)Unmarried:
35.3% (21)
Women who did not give birth in the past 12 months Now married:
43.7% (1,374)Unmarried:
56.3% (1,772)
Marital status - Two or more races population 15 years and over
Males 55.4% Never married32.5% Now married2.5% Separated1.4% Widowed8.1% DivorcedFemales 37.8% Never married32.8% Now married3.9% Separated13.9% Widowed11.6% DivorcedWomen who gave birth in the past 12 months Now married:
73.2% (60)Unmarried:
26.8% (22)
Women who did not give birth in the past 12 months Now married:
36.8% (516)Unmarried:
63.2% (887)
Marital status - White alone, not Hispanic / Latino population 15 years and over
Males 43.6% Never married32.2% Now married3.3% Separated3.2% Widowed17.6% DivorcedFemales 42.0% Never married26.5% Now married3.2% Separated12.9% Widowed15.3% DivorcedWomen who gave birth in the past 12 months Now married:
21.0% (12)Unmarried:
79.0% (46)
Women who did not give birth in the past 12 months Now married:
30.7% (628)Unmarried:
69.3% (1,420)
Marital status - Hispanic or Latino population 15 years and over
Males 49.5% Never married39.8% Now married2.6% Separated0.9% Widowed7.2% DivorcedFemales 40.8% Never married36.0% Now married3.6% Separated5.3% Widowed14.3% DivorcedWomen who gave birth in the past 12 months Now married:
53.9% (58)Unmarried:
46.1% (49)
Women who did not give birth in the past 12 months Now married:
36.2% (1,649)Unmarried:
63.8% (2,906)
Ancestries in Hackensack
1,739 6.1% Italian749 2.6% Jamaican677 2.4% Irish672 2.4% American611 2.2% African471 1.7% Syrian416 1.5% German344 1.2% Palestinian326 1.2% Haitian288 1.0% Greek278 1.0% Ghanaian269 1.0% English262 0.9% Nigerian239 0.8% Albanian224 0.8% Russian198 0.7% Jordanian187 0.7% Polish173 0.6% Eastern European159 0.6% Trinidadian and Tobagonian145 0.5% Turkish135 0.5% Guyanese114 0.4% Egyptian105 0.4% Kenyan89 0.3% European87 0.3% Armenian85 0.3% Lebanese83 0.3% Romanian80 0.3% British West Indian74 0.3% Ethiopian62 0.2% Cape Verdean58 0.2% Hungarian50 0.2% Ukrainian49 0.2% Israeli41 0.1% Welsh40 0.1% Iranian36 0.1% Bulgarian36 0.1% Barbadian32 0.1% Dutch31 0.1% Norwegian29 0.1% West Indian26 0.09% Scottish25 0.09% Northern European19 0.07% Slovak19 0.07% British16 0.06% Finnish16 0.06% South African16 0.06% Zimbabwean10 0.04% Maltese8 0.03% Austrian7 0.02% Lithuanian7 0.02% Swiss5 0.02% Soviet Union4 0.01% Arab2 0.01% Portuguese
Geographical mobility in Hackensack Same house 1 year ago 14,116 88.7% White (Caucasian)8,049 87.4% Black or African American77 73.5% American Indian / Alaska Native4,806 81.7% Asian8,852 88.6% Other race7,605 88.1% Two or more races10,311 88.5% White alone, not Hispanic / Latino15,338 86.4% Hispanic or LatinoMoved within same county 828 5.2% White / Caucasian347 3.8% Black or African American385 6.5% Asian466 4.7% Other race532 6.2% Two or more races669 5.7% White alone, not Hispanic / Latino992 5.6% Hispanic or LatinoMoved within same state 320 2.0% White / Caucasian186 2.0% Black or African American98 1.7% Asian141 1.4% Other race122 1.4% Two or more races297 2.5% White alone, not Hispanic / Latino400 2.3% Hispanic or LatinoMoved from different state 573 3.6% White / Caucasian330 3.6% Black or African American18 16.8% American Indian / Alaska Native279 4.7% Asian74 0.7% Other race121 1.4% Two or more races289 2.5% White alone, not Hispanic / Latino428 2.4% Hispanic or LatinoMoved from abroad 70 0.4% White102 1.1% Black or African American439 7.5% Asian340 3.4% Other race269 3.1% Two or more races80 0.7% White alone, not Hispanic / Latino625 3.5% Hispanic or Latino
Children Nativity (place of birth) in Hackensack
Children under 6 years - Living with two parents Both parents native 135 100.0% NativeBoth parents foreign-born 872 80.5% Native211 19.5% Foreign-bornOne native, one foreign-born parent 332 100.0% NativeChildren under 6 years - Living with one parent Native parent 510 94.7% Native29 5.3% Foreign-bornForeign-born parent 368 99.0% Native4 1.0% Foreign-bornChildren 6 to 17 years - Living with two parents Both parents native 355 93.1% Native26 6.9% Foreign-bornBoth parents foreign-born 1,453 81.0% Native340 19.0% Foreign-bornOne native, one foreign-born parent 495 100.0% NativeChildren 6 to 17 years - Living with one parent Native parent 471 100.0% NativeForeign-born parent 949 53.8% Native815 46.2% Foreign-born
Place of birth for residents in Hackensack 11,370 Americas11,284 Latin America6,100 Asia5,235 South America4,834 Caribbean2,528 South Central Asia1,483 South Eastern Asia1,307 Europe1,217 Western Asia1,213 Central America1,100 Africa782 Eastern Europe781 Eastern Asia515 Western Africa254 Northern Europe232 Eastern Africa207 Southern Europe194 China165 Northern Africa164 Middle Africa86 Northern America50 Western Europe22 Southern Africa1 Oceania1 Australia and New Zealand Subregion3,703 Ecuador2,957 Dominican Republic1,744 India1,220 Philippines1,164 Jamaica847 Colombia474 Korea428 Guatemala347 El Salvador288 Syria284 Ghana270 Guyana259 Peru258 Mexico242 Turkey240 Israel222 Bangladesh211 Cuba194 China194 Trinidad and Tobago182 Russia175 Kuwait174 Nigeria166 Pakistan165 Egypt159 Nepal157 Poland142 Italy140 Congo136 Burma (Myanmar)128 Albania124 Haiti118 England114 Ireland111 Japan109 Kenya106 Ethiopia92 Nicaragua91 Lebanon90 Romania89 Georgia89 Bolivia86 Canada74 Dominica71 Ukraine69 Hungary62 Greece57 Honduras56 Uzbekistan55 Jordan50 Germany45 Thailand39 St. Vincent and the Grenadines38 Argentina37 Iran36 Barbados34 United Arab Emirates34 Vietnam32 Indonesia29 Panama23 Democratic Republic of Congo (Zaire)22 South Africa22 Bulgaria20 Grenada20 United Kingdom16 Zimbabwe13 Brazil13 Malaysia6 Chile6 Sri Lanka6 Uruguay2 Portugal1 Afghanistan1 Australia
Grandparents responsible for own grandchildren in Hackensack
Grandparents (30 to 59 years) White / Caucasian 51 45.3% Responsible for grandchildren62 54.7% Not responsible for grandchildrenBlack or African American 24 100.0% Responsible for grandchildrenOther race 47 61.4% Responsible for grandchildren30 38.6% Not responsible for grandchildrenTwo or more races 33 100.0% Not responsible for grandchildrenWhite alone, not Hispanic / Latino 7 29.8% Responsible for grandchildren17 70.2% Not responsible for grandchildrenHispanic or Latino 108 63.3% Responsible for grandchildren63 36.7% Not responsible for grandchildrenGrandparents (60 years and over) White / Caucasian 57 62.1% Responsible for grandchildren35 37.9% Not responsible for grandchildrenBlack or African American 145 100.0% Not responsible for grandchildrenOther race 55 24.8% Responsible for grandchildren166 75.2% Not responsible for grandchildrenTwo or more races 58 100.0% Not responsible for grandchildrenWhite alone, not Hispanic / Latino 56 58.2% Responsible for grandchildren40 41.8% Not responsible for grandchildrenHispanic or Latino 49 21.9% Responsible for grandchildren175 78.1% Not responsible for grandchildren