Races in Gulf Hills, Mississippi (MS) Detailed Stats
Data:
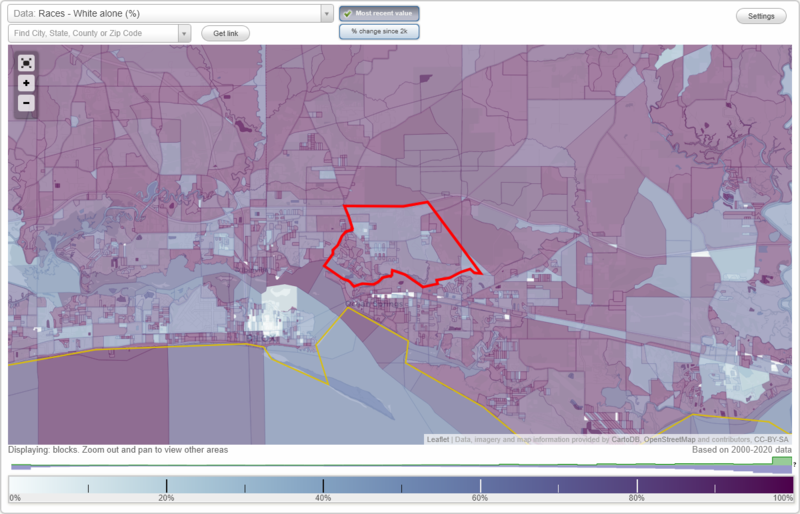
Races - White alone (%)
Races - White alone (% change since 2000)
Races - Black alone (%)
Races - Black alone (% change since 2000)
Races - American Indian alone (%)
Races - American Indian alone (% change since 2000)
Races - Asian alone (%)
Races - Asian alone (% change since 2000)
Races - Hispanic (%)
Races - Hispanic (% change since 2000)
Races - Native Hawaiian and Other Pacific Islander alone (%)
Races - Native Hawaiian and Other Pacific Islander alone (% change since 2000)
Races - Two or more races(%)
Races - Two or more races(% change since 2000)
Races - Other race alone (%)
Races - Other race alone (% change since 2000)
Racial diversity
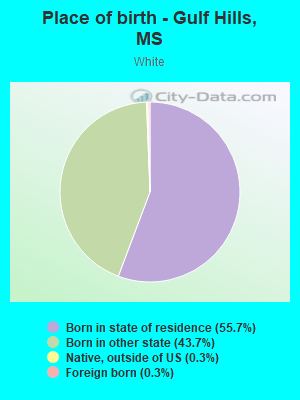
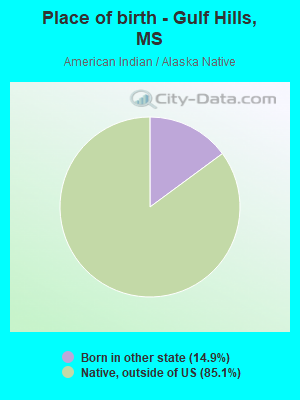
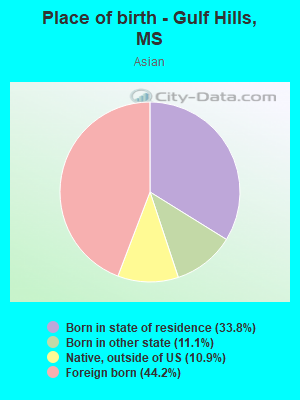
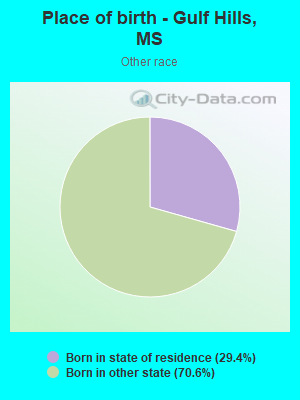
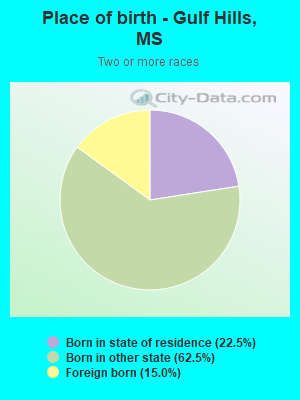
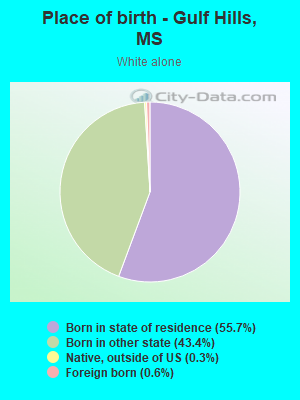
Place of birth - Born in state of residence (%)
Place of birth - Born in state of residence (%) - White
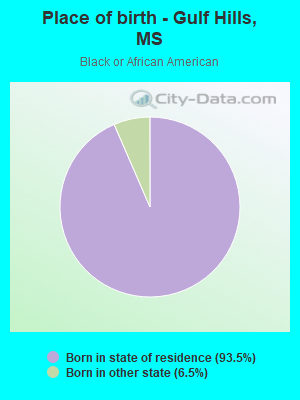
Place of birth - Born in state of residence (%) - Black or African American
Place of birth - Born in state of residence (%) - Asian
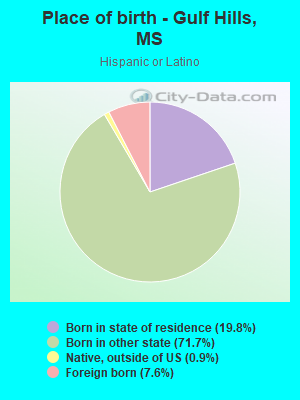
Place of birth - Born in state of residence (%) - Hispanic or Latino
Place of birth - Born in state of residence (%) - American Indian and Alaska Native
Place of birth - Born in state of residence (%) - Multirace
Place of birth - Born in state of residence (%) - Other Race
Place of birth - Born in other state (%)
Place of birth - Born in other state (%) - White
Place of birth - Born in other state (%) - Black or African American
Place of birth - Born in other state (%) - Asian
Place of birth - Born in other state (%) - Hispanic or Latino
Place of birth - Born in other state (%) - American Indian and Alaska Native
Place of birth - Born in other state (%) - Multirace
Place of birth - Born in other state (%) - Other Race
Place of birth - Native, outside of US (%)
Place of birth - Native, outside of US (%) - White
Place of birth - Native, outside of US (%) - Black or African American
Place of birth - Native, outside of US (%) - Asian
Place of birth - Native, outside of US (%) - Hispanic or Latino
Place of birth - Native, outside of US (%) - American Indian and Alaska Native
Place of birth - Native, outside of US (%) - Multirace
Place of birth - Native, outside of US (%) - Other Race
Place of birth - Foreign born (%)
Place of birth - Foreign born (%) - White
Place of birth - Foreign born (%) - Black or African American
Place of birth - Foreign born (%) - Asian
Place of birth - Foreign born (%) - Hispanic or Latino
Place of birth - Foreign born (%) - American Indian and Alaska Native
Place of birth - Foreign born (%) - Multirace
Place of birth - Foreign born (%) - Other Race
Residents speaking English at home (%)
Residents speaking English at home - Born in the United States (%)
Residents speaking English at home - Native, born elsewhere (%)
Residents speaking English at home - Foreign born (%)
Residents speaking Spanish at home (%)
Residents speaking Spanish at home - Born in the United States (%)
Residents speaking Spanish at home - Native, born elsewhere (%)
Residents speaking Spanish at home - Foreign born (%)
Residents speaking other language at home (%)
Residents speaking other language at home - Born in the United States (%)
Residents speaking other language at home - Native, born elsewhere (%)
Residents speaking other language at home - Foreign born (%)
Marital status - Never married (%)
Marital status - Now married (%)
Marital status - Separated (%)
Marital status - Widowed (%)
Marital status - Divorced (%)
Ancestries Reported - Arab (%)
Ancestries Reported - Czech (%)
Ancestries Reported - Danish (%)
Ancestries Reported - Dutch (%)
Ancestries Reported - English (%)
Ancestries Reported - French (%)
Ancestries Reported - French Canadian (%)
Ancestries Reported - German (%)
Ancestries Reported - Greek (%)
Ancestries Reported - Hungarian (%)
Ancestries Reported - Irish (%)
Ancestries Reported - Italian (%)
Ancestries Reported - Lithuanian (%)
Ancestries Reported - Norwegian (%)
Ancestries Reported - Polish (%)
Ancestries Reported - Portuguese (%)
Ancestries Reported - Russian (%)
Ancestries Reported - Scotch-Irish (%)
Ancestries Reported - Scottish (%)
Ancestries Reported - Slovak (%)
Ancestries Reported - Subsaharan African (%)
Ancestries Reported - Swedish (%)
Ancestries Reported - Swiss (%)
Ancestries Reported - Ukrainian (%)
Ancestries Reported - United States (%)
Ancestries Reported - Welsh (%)
Ancestries Reported - West Indian (%)
Ancestries Reported - Other (%)
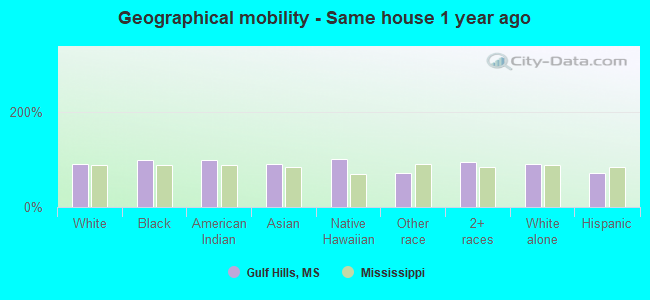
Geographical mobility - Same house 1 year ago (%)
Geographical mobility - Same house 1 year ago (%) - White
Geographical mobility - Same house 1 year ago (%) - Black or African American
Geographical mobility - Same house 1 year ago (%) - Asian
Geographical mobility - Same house 1 year ago (%) - Hispanic or Latino
Geographical mobility - Same house 1 year ago (%) - American Indian and Alaska Native
Geographical mobility - Same house 1 year ago (%) - Multirace
Geographical mobility - Same house 1 year ago (%) - Other Race
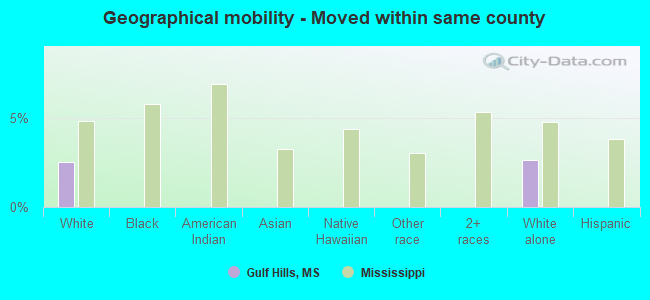
Geographical mobility - Moved within same county (%)
Geographical mobility - Moved within same county (%) - White
Geographical mobility - Moved within same county (%) - Black or African American
Geographical mobility - Moved within same county (%) - Asian
Geographical mobility - Moved within same county (%) - Hispanic or Latino
Geographical mobility - Moved within same county (%) - American Indian and Alaska Native
Geographical mobility - Moved within same county (%) - Multirace
Geographical mobility - Moved within same county (%) - Other Race
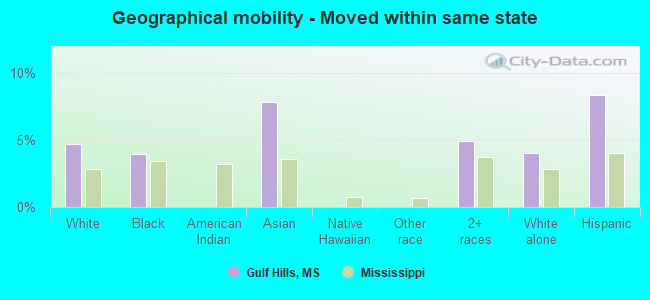
Geographical mobility - Moved from different county within same state (%)
Geographical mobility - Moved from different county within same state (%) - White
Geographical mobility - Moved from different county within same state (%) - Black or African American
Geographical mobility - Moved from different county within same state (%) - Asian
Geographical mobility - Moved from different county within same state (%) - Hispanic or Latino
Geographical mobility - Moved from different county within same state (%) - American Indian and Alaska Native
Geographical mobility - Moved from different county within same state (%) - Multirace
Geographical mobility - Moved from different county within same state (%) - Other Race
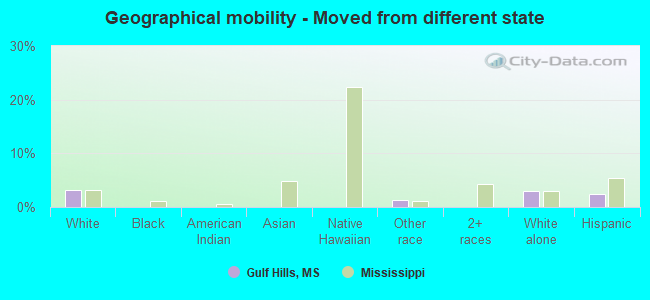
Geographical mobility - Moved from different state (%)
Geographical mobility - Moved from different state (%) - White
Geographical mobility - Moved from different state (%) - Black or African American
Geographical mobility - Moved from different state (%) - Asian
Geographical mobility - Moved from different state (%) - Hispanic or Latino
Geographical mobility - Moved from different state (%) - American Indian and Alaska Native
Geographical mobility - Moved from different state (%) - Multirace
Geographical mobility - Moved from different state (%) - Other Race
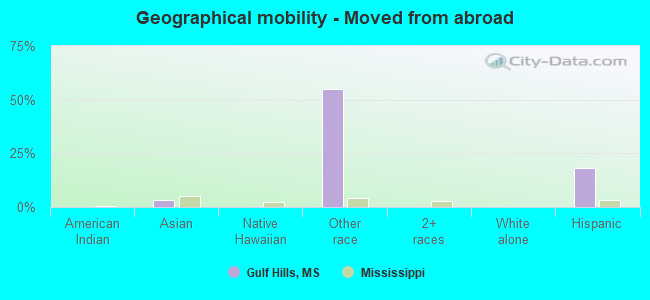
Geographical mobility - Moved from abroad (%)
Geographical mobility - Moved from abroad (%) - White
Geographical mobility - Moved from abroad (%) - Black or African American
Geographical mobility - Moved from abroad (%) - Asian
Geographical mobility - Moved from abroad (%) - Hispanic or Latino
Geographical mobility - Moved from abroad (%) - American Indian and Alaska Native
Geographical mobility - Moved from abroad (%) - Multirace
Geographical mobility - Moved from abroad (%) - Other Race
Place of birth for the foreign-born population - Ireland (%)
Place of birth for the foreign-born population - Denmark (%)
Place of birth for the foreign-born population - Norway (%)
Place of birth for the foreign-born population - Sweden (%)
Place of birth for the foreign-born population - United Kingdom (%)
Place of birth for the foreign-born population - England (%)
Place of birth for the foreign-born population - Scotland (%)
Place of birth for the foreign-born population - Other Northern Europe (%)
Place of birth for the foreign-born population - Austria (%)
Place of birth for the foreign-born population - Belgium (%)
Place of birth for the foreign-born population - France (%)
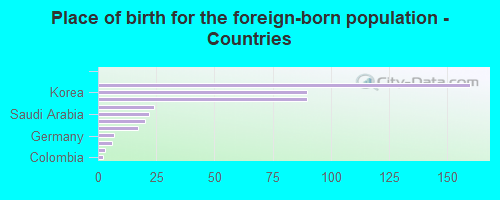
Place of birth for the foreign-born population - Germany (%)
Place of birth for the foreign-born population - Netherlands (%)
Place of birth for the foreign-born population - Switzerland (%)
Place of birth for the foreign-born population - Other Western Europe (%)
Place of birth for the foreign-born population - Greece (%)
Place of birth for the foreign-born population - Italy (%)
Place of birth for the foreign-born population - Portugal (%)
Place of birth for the foreign-born population - Spain (%)
Place of birth for the foreign-born population - Other Southern Europe (%)
Place of birth for the foreign-born population - Albania (%)
Place of birth for the foreign-born population - Belarus (%)
Place of birth for the foreign-born population - Bosnia and Herzegovina (%)
Place of birth for the foreign-born population - Bulgaria (%)
Place of birth for the foreign-born population - Croatia (%)
Place of birth for the foreign-born population - Czechoslovakia (%)
Place of birth for the foreign-born population - Hungary (%)
Place of birth for the foreign-born population - Latvia (%)
Place of birth for the foreign-born population - Lithuania (%)
Place of birth for the foreign-born population - North Macedonia (Macedonia) (%)
Place of birth for the foreign-born population - Moldova (%)
Place of birth for the foreign-born population - Poland (%)
Place of birth for the foreign-born population - Romania (%)
Place of birth for the foreign-born population - Russia (%)
Place of birth for the foreign-born population - Serbia (%)
Place of birth for the foreign-born population - Ukraine (%)
Place of birth for the foreign-born population - Other Eastern Europe (%)
Place of birth for the foreign-born population - China (%)
Place of birth for the foreign-born population - Hong Kong (%)
Place of birth for the foreign-born population - Taiwan (%)
Place of birth for the foreign-born population - Japan (%)
Place of birth for the foreign-born population - Korea (%)
Place of birth for the foreign-born population - Other Eastern Asia (%)
Place of birth for the foreign-born population - Afghanistan (%)
Place of birth for the foreign-born population - Bangladesh (%)
Place of birth for the foreign-born population - India (%)
Place of birth for the foreign-born population - Iran (%)
Place of birth for the foreign-born population - Kazakhstan (%)
Place of birth for the foreign-born population - Nepal (%)
Place of birth for the foreign-born population - Pakistan (%)
Place of birth for the foreign-born population - Sri Lanka (%)
Place of birth for the foreign-born population - Uzbekistan (%)
Place of birth for the foreign-born population - Other South Central Asia (%)
Place of birth for the foreign-born population - Burma (%)
Place of birth for the foreign-born population - Cambodia (%)
Place of birth for the foreign-born population - Indonesia (%)
Place of birth for the foreign-born population - Laos (%)
Place of birth for the foreign-born population - Malaysia (%)
Place of birth for the foreign-born population - Philippines (%)
Place of birth for the foreign-born population - Singapore (%)
Place of birth for the foreign-born population - Thailand (%)
Place of birth for the foreign-born population - Vietnam (%)
Place of birth for the foreign-born population - Other South Eastern Asia (%)
Place of birth for the foreign-born population - Armenia (%)
Place of birth for the foreign-born population - Iraq (%)
Place of birth for the foreign-born population - Israel (%)
Place of birth for the foreign-born population - Jordan (%)
Place of birth for the foreign-born population - Kuwait (%)
Place of birth for the foreign-born population - Lebanon (%)
Place of birth for the foreign-born population - Saudi Arabia (%)
Place of birth for the foreign-born population - Syria (%)
Place of birth for the foreign-born population - Turkey (%)
Place of birth for the foreign-born population - Yemen (%)
Place of birth for the foreign-born population - Other Western Asia (%)
Place of birth for the foreign-born population - Eritrea (%)
Place of birth for the foreign-born population - Ethiopia (%)
Place of birth for the foreign-born population - Kenya (%)
Place of birth for the foreign-born population - Somalia (%)
Place of birth for the foreign-born population - Uganda (%)
Place of birth for the foreign-born population - Zimbabwe (%)
Place of birth for the foreign-born population - Other Eastern Africa (%)
Place of birth for the foreign-born population - Cameroon (%)
Place of birth for the foreign-born population - Congo (%)
Place of birth for the foreign-born population - Democratic Republic of Congo (Zaire) (%)
Place of birth for the foreign-born population - Other Middle Africa (%)
Place of birth for the foreign-born population - Egypt (%)
Place of birth for the foreign-born population - Morocco (%)
Place of birth for the foreign-born population - Sudan (%)
Place of birth for the foreign-born population - Other Northern Africa (%)
Place of birth for the foreign-born population - South Africa (%)
Place of birth for the foreign-born population - Other Southern Africa (%)
Place of birth for the foreign-born population - Cabo Verde (%)
Place of birth for the foreign-born population - Ghana (%)
Place of birth for the foreign-born population - Liberia (%)
Place of birth for the foreign-born population - Nigeria (%)
Place of birth for the foreign-born population - Senegal (%)
Place of birth for the foreign-born population - Sierra Leone (%)
Place of birth for the foreign-born population - Other Western Africa (%)
Place of birth for the foreign-born population - Australia (%)
Place of birth for the foreign-born population - New Zealand (%)
Place of birth for the foreign-born population - Fiji (%)
Place of birth for the foreign-born population - Micronesia (%)
Place of birth for the foreign-born population - Bahamas (%)
Place of birth for the foreign-born population - Barbados (%)
Place of birth for the foreign-born population - Cuba (%)
Place of birth for the foreign-born population - Dominica (%)
Place of birth for the foreign-born population - Dominican Republic (%)
Place of birth for the foreign-born population - Grenada (%)
Place of birth for the foreign-born population - Haiti (%)
Place of birth for the foreign-born population - Jamaica (%)
Place of birth for the foreign-born population - St. Vincent and the Grenadines (%)
Place of birth for the foreign-born population - Trinidad and Tobago (%)
Place of birth for the foreign-born population - West Indies (%)
Place of birth for the foreign-born population - Other Caribbean (%)
Place of birth for the foreign-born population - Belize (%)
Place of birth for the foreign-born population - Costa Rica (%)
Place of birth for the foreign-born population - El Salvador (%)
Place of birth for the foreign-born population - Guatemala (%)
Place of birth for the foreign-born population - Honduras (%)
Place of birth for the foreign-born population - Mexico (%)
Place of birth for the foreign-born population - Nicaragua (%)
Place of birth for the foreign-born population - Panama (%)
Place of birth for the foreign-born population - Other Central America (%)
Place of birth for the foreign-born population - Argentina (%)
Place of birth for the foreign-born population - Bolivia (%)
Place of birth for the foreign-born population - Brazil (%)
Place of birth for the foreign-born population - Chile (%)
Place of birth for the foreign-born population - Colombia (%)
Place of birth for the foreign-born population - Ecuador (%)
Place of birth for the foreign-born population - Guyana (%)
Place of birth for the foreign-born population - Peru (%)
Place of birth for the foreign-born population - Uruguay (%)
Place of birth for the foreign-born population - Venezuela (%)
Place of birth for the foreign-born population - Other South America (%)
Place of birth for the foreign-born population - Canada (%)
Place of birth for the foreign-born population - Other Northern America (%)
Place of birth for the foreign-born population - Other (%)
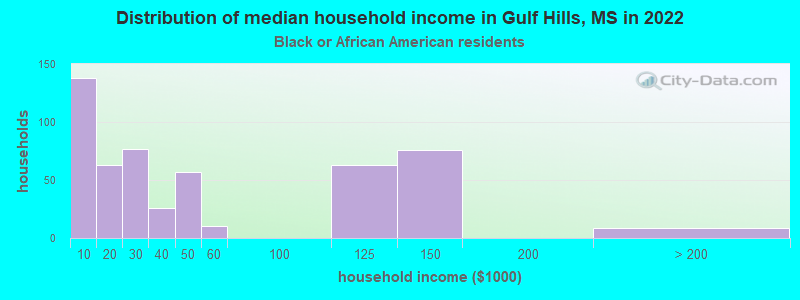
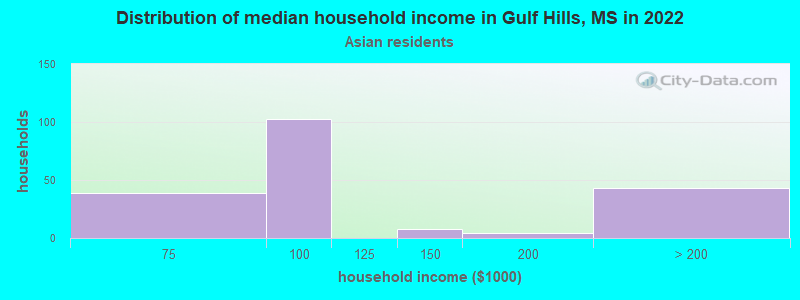
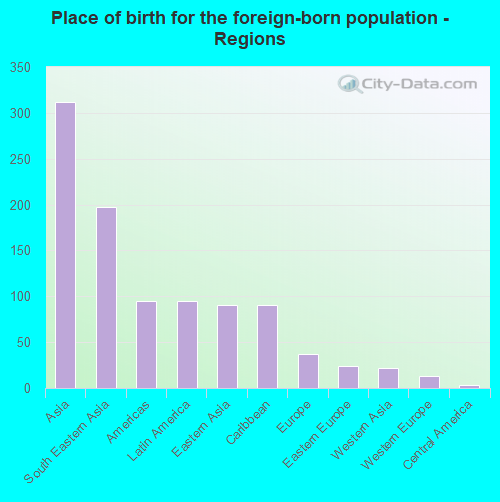
According to 2022 data, the most numerous races in Gulf Hills, MS are White alone (5,555 residents), Black alone (1,120 residents), and Hispanic (993 residents). 85.7% of Gulf Hills residents speak English at home. 5.1% of Gulf Hills, MS residents are foreign-born (3.5% born in Asia, 1.1% born in Latin America), which is 60.8% greater than the foreign-born rate of 2.0% across the entire state of Mississippi.
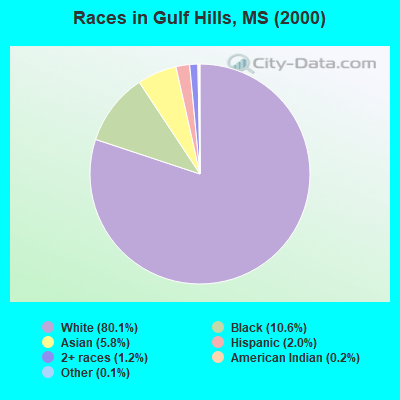
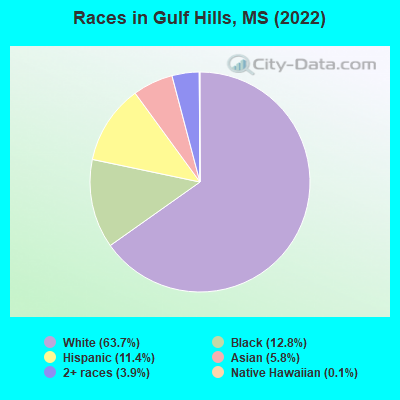
Race distribution in Gulf Hills
2000 2022
1,727,908 60.7% White alone 1,028,473 36.2% Black alone 39,569 1.4% Hispanic 17,272 0.6% Two or more races 18,349 0.6% Asian alone 11,224 0.4% American Indian alone 1,294 0.05% Other race alone 569 0.02% Native Hawaiian and Other
1,625,979 55.3% White alone 1,072,962 36.5% Black alone 97,177 3.3% Hispanic 96,367 3.3% Two or more races 25,217 0.9% Asian alone 12,457 0.4% American Indian alone 9,501 0.3% Other race alone 397 0.01% Native Hawaiian and Other
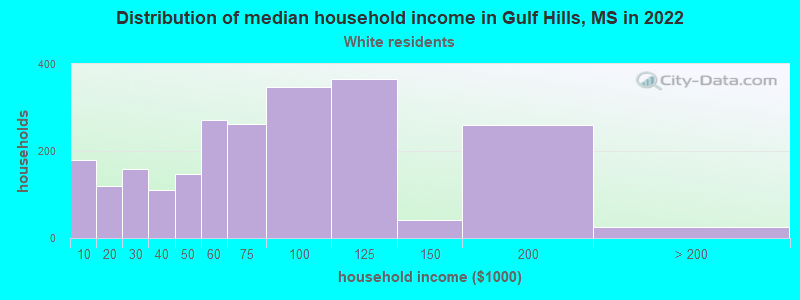
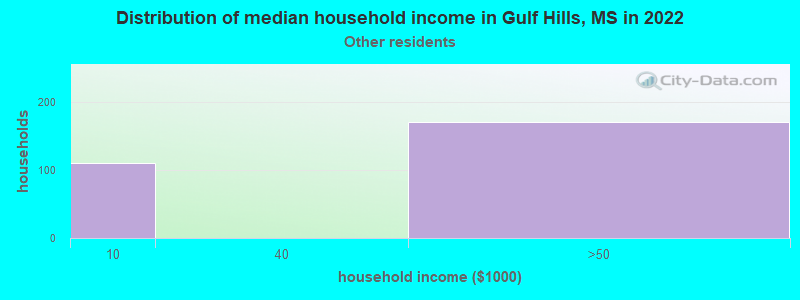
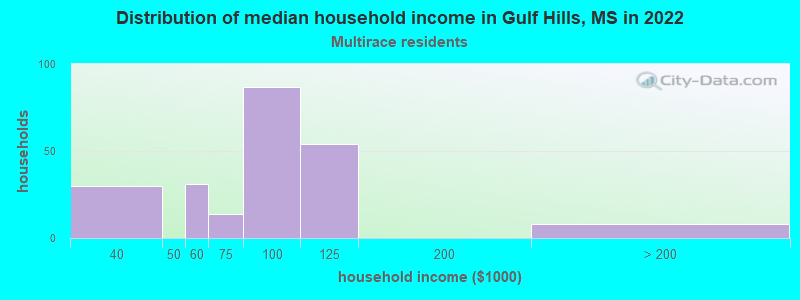
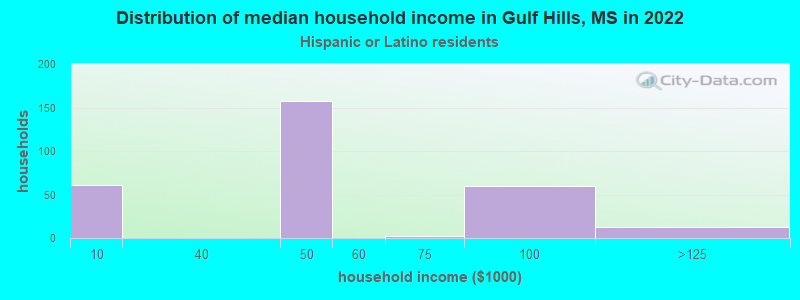
Income and house value in Gulf Hills Median household income in 2022 $64,391 White non-Hispanic householders$66,447 Asian householders$82,446 Two or more races householders$76,644 Hispanic or Latino race householdersMedian 2022 house value $186,769 White Non-Hispanic householders$150,370 Black or African American householders $153,353 Asian householders$323,216 Some other race householders$181,598 Two or more races householders$108,600 Hispanic or Latino householders
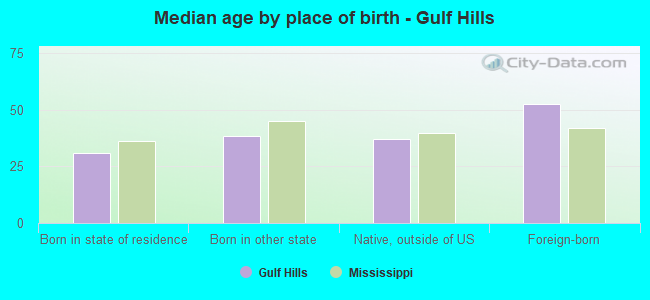
Median age by race in Gulf Hills
36.6 Median age for White residents34.7 37.0 31.0 Median age for Black or African American residents34.8 28.3 -418,786,692.3 Median age for American Indian / Alaska Native residents-433,333,332.9 -710,601,718.5 48.0 Median age for Asian residents47.0 59.9 -666,666,666.0 Median age for Native Hawaiian / Pacific Islander residents-666,666,666.0 -666,666,666.0 27.1 Median age for Other race residents36.0 24.4 37.1 Median age for Two or more races residents26.0 54.1 36.3 Median age for White alone residents34.2 36.6 23.3 Median age for Hispanic or Latino residents26.0 26.8
Owner/renter occupied households by race in Gulf Hills
House owners and renters - White residents 1,840 79.5% Owner occupied475 20.5% Renter occupiedHouse owners and renters - Black or African American residents 276 65.9% Owner occupied143 34.1% Renter occupiedHouse owners and renters - American Indian / Alaska Native residents 14 100.0% Owner occupiedHouse owners and renters - Asian residents 182 37.5% Owner occupied305 62.5% Renter occupiedHouse owners and renters - Native Hawaiian / Pacific Islander residents 34 100.0% Owner occupiedHouse owners and renters - Other race residents 63 38.2% Owner occupied103 61.8% Renter occupiedHouse owners and renters - Two or more races residents 134 65.1% Owner occupied71 34.9% Renter occupiedHouse owners and renters - White alone residents 1,862 78.7% Owner occupied504 21.3% Renter occupiedHouse owners and renters - Hispanic or Latino residents 91 43.9% Owner occupied116 56.1% Renter occupied
Language usage in Gulf Hills
English speakers - Total 85.7% of residents of Gulf Hills speak English at home.
5.7% of residents speak Spanish at home 359 77.4% Speak English very well105 22.6% Speak English less than very well9.2% of residents speak other language at home 368 48.7% Speak English very well388 51.3% Speak English less than very well
English speakers - Born in the United States 86.9% of residents of Gulf Hills speak English at home.
7.4% of residents speak Spanish at home 185 75.8% Speak English very well59 24.2% Speak English less than very well1.8% of residents speak other language at home 58 100.0% Speak English very well
English speakers - Native, born elsewhere 9.8% of residents of Gulf Hills speak English at home.
2.3% of residents speak Spanish at home 4 100.0% Speak English less than very well109.2% of residents speak other language at home 100 52.9% Speak English very well89 47.1% Speak English less than very well
English speakers - Foreign-born 27.4% of residents of Gulf Hills speak English at home.
26.5% of residents speak Spanish at home 48 55.2% Speak English very well39 44.8% Speak English less than very well87.8% of residents speak other language at home 89 30.9% Speak English very well199 69.1% Speak English less than very well
White (Caucasian) - Speak only English Native:
99.5% (5,055)Foreign-born:
73.1% (14)
White (Caucasian) - Speak another language Native:
0.6% (32)Foreign-born:
66.5% (13)
Asian - Speak only English Native:
19.6% (75)Foreign-born:
28.8% (84)
Asian - Speak another language Native:
84.2% (323)Foreign-born:
73.4% (213)
White alone - Speak only English Native:
98.6% (5,073)Foreign-born:
44.9% (15)
White alone - Speak another language Native:
1.6% (85)Foreign-born:
36.7% (12)
Hispanic or Latino - Speak another language Native:
47.2% (417)Foreign-born:
100.0% (88)
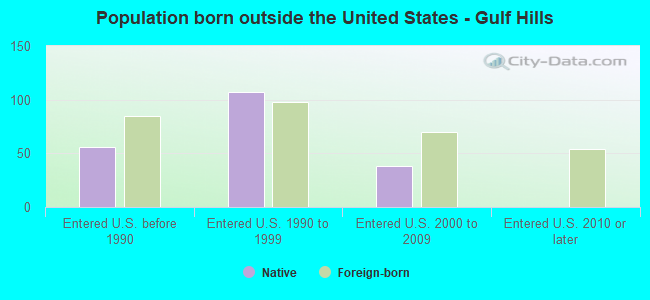
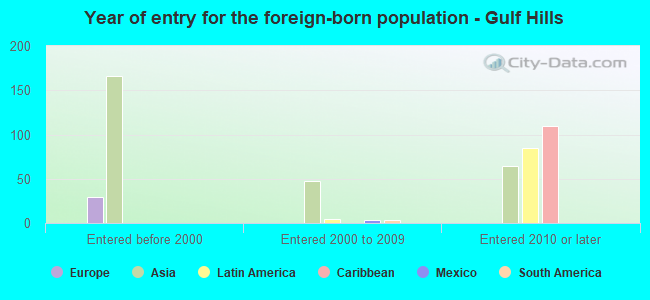
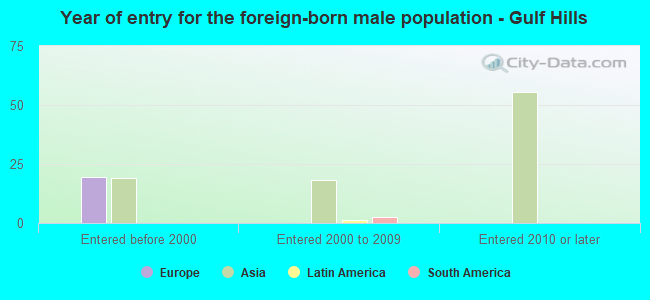
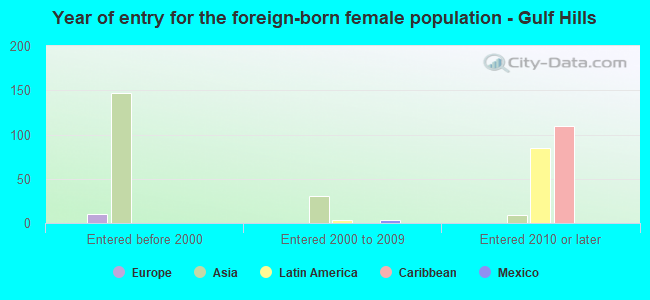
Foreign-born residents in Gulf Hills 445 residents are foreign born (3.5% Asia , 1.1% Latin America ).
This city:
5.1%Mississippi:
2.3%
Marital status for residents in Gulf Hills Marital status - White (Caucasian) population 15 years and over
Males 26.5% Never married66.8% Now married0.4% Separated1.5% Widowed4.8% DivorcedFemales 26.8% Never married49.2% Now married0.0% Separated5.1% Widowed18.9% DivorcedWomen who gave birth in the past 12 months Now married:
77.5% (130)Unmarried:
22.5% (38)
Women who did not give birth in the past 12 months Now married:
40.9% (498)Unmarried:
59.1% (721)
Marital status - Black or African American population 15 years and over
Males 62.2% Never married11.8% Now married0.0% Separated5.9% Widowed20.2% DivorcedFemales 80.1% Never married12.8% Now married0.0% Separated0.0% Widowed7.1% DivorcedWomen who did not give birth in the past 12 months Now married:
9.6% (27)Unmarried:
90.4% (258)
Marital status - Asian population 15 years and over
Males 48.7% Never married51.3% Now married0.0% Separated0.0% Widowed0.0% DivorcedFemales 30.6% Never married56.8% Now married0.0% Separated12.6% Widowed0.0% DivorcedWomen who did not give birth in the past 12 months Now married:
52.3% (104)Unmarried:
47.7% (95)
Marital status - Other race population 15 years and over
Males 45.5% Never married54.5% Now married0.0% Separated0.0% Widowed0.0% DivorcedFemales 0.0% Never married100.0% Now married0.0% Separated0.0% Widowed0.0% DivorcedWomen who did not give birth in the past 12 months Now married:
100.0% (255)Unmarried:
0.0% (0)
Marital status - Two or more races population 15 years and over
Males 8.2% Never married46.9% Now married0.0% Separated40.8% Widowed4.1% DivorcedFemales 19.9% Never married76.8% Now married0.0% Separated0.0% Widowed3.4% DivorcedWomen who did not give birth in the past 12 months Now married:
61.9% (215)Unmarried:
38.1% (132)
Marital status - White alone, not Hispanic / Latino population 15 years and over
Males 26.5% Never married66.8% Now married0.4% Separated1.5% Widowed4.8% DivorcedFemales 26.8% Never married49.2% Now married0.0% Separated5.1% Widowed18.9% DivorcedWomen who gave birth in the past 12 months Now married:
77.5% (132)Unmarried:
22.5% (38)
Women who did not give birth in the past 12 months Now married:
40.9% (509)Unmarried:
59.1% (737)
Marital status - Hispanic or Latino population 15 years and over
Males 38.7% Never married59.0% Now married0.0% Separated0.0% Widowed2.3% DivorcedFemales 11.9% Never married88.1% Now married0.0% Separated0.0% Widowed0.0% DivorcedWomen who did not give birth in the past 12 months Now married:
83.4% (300)Unmarried:
16.6% (60)
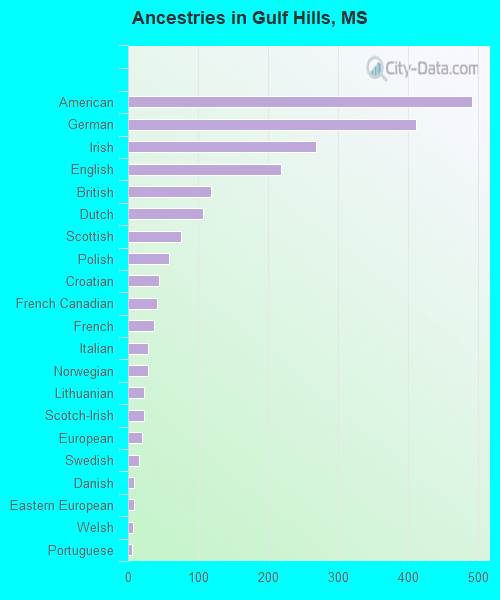
Ancestries in Gulf Hills
491 11.5% American412 9.7% German268 6.3% Irish219 5.1% English118 2.8% British107 2.5% Dutch75 1.8% Scottish58 1.4% Polish44 1.0% Croatian41 1.0% French Canadian37 0.9% French29 0.7% Italian28 0.7% Norwegian23 0.5% Lithuanian23 0.5% Scotch-Irish20 0.5% European15 0.4% Swedish9 0.2% Danish8 0.2% Eastern European7 0.2% Welsh5 0.1% Portuguese
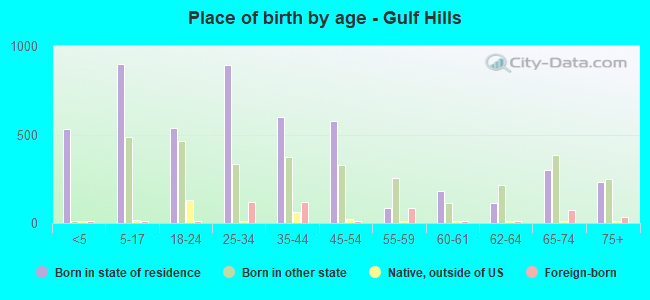
Children Nativity (place of birth) in Gulf Hills
Children under 6 years - Living with two parents Both parents native 421 99.7% Native1 0.3% Foreign-bornOne native, one foreign-born parent 31 77.5% Native9 22.5% Foreign-bornChildren under 6 years - Living with one parent Native parent 159 100.0% NativeForeign-born parent 9 100.0% NativeChildren 6 to 17 years - Living with two parents Both parents native 731 100.0% NativeBoth parents foreign-born 37 100.0% NativeOne native, one foreign-born parent 16 100.0% NativeChildren 6 to 17 years - Living with one parent Native parent 401 100.0% NativeForeign-born parent 28 46.3% Native32 53.7% Foreign-born
Grandparents responsible for own grandchildren in Gulf Hills
Grandparents (30 to 59 years) Black or African American 58 100.0% Not responsible for grandchildren
Grandparents (60 years and over)